International Journal of Civil Infrastructure (IJCI)
ISSN: 2563-8084

Volume 1 - Year 2018 - Pages 9-21
DOI: 10.11159/ijci.2018.002
Residents’ Perceptions on Road Hump Effectiveness in Malaysian Residential Environments
Khairun Sarah Radhiah binti Bachok, Abdul Azeez Kadar Hamsa, Mohd Zin Mohamed, Mansor Ibrahim
International Islamic University Malaysia, Department of Urban and Regional Planning
Jalan Gombak, 50728 Kuala Lumpur, Malaysia
khairunsarah@gmail.com; azeez@iium.edu.my
Abstract - Two common concerns for residents in their respective residential areas are high traffic speeds and noise levels. This paper analyses the perception of residents on the effectiveness of road humps in improving residential living environment based on their effects on traffic speed and noise. The study was conducted in three Malaysian residential areas, specifically Putrajaya, Taman Setiawangsa, and Keramat. A questionnaire survey was distributed to 478 respondents asking for their perceptions on whether road humps have improved their living environment by reducing speed and noise. Binary logistic regression models were also developed to identify variables that affect respondents’ likelihood to agree that existing road humps have improved the living environment of the residents by reducing traffic speed and noise. The result of this study is that the height of road humps affects noise levels and traffic speeds, as average vehicle speeds and LAeq were lowest at the road hump of 90mm height. The respondents’ perceptions of the importance of lower traffic speeds and noise levels, as well as the appropriateness of hump heights and locations, were significant variables in determining the likelihood of their agreement that road humps have improved their living environment.
Keywords: Malaysia, Residential, Road Hump, Vehicle Speed, Traffic Noise.
© Copyright 2018 Authors This is an Open Access article published under the Creative Commons Attribution License terms. Unrestricted use, distribution, and reproduction in any medium are permitted, provided the original work is properly cited.
Date Received: 2017-08-15
Date Accepted: 2018-01-22
Date Published: 2018-02-22
1. Introduction
A common concern shared by residents is that the installation of vertical deflection measures such as road humps can increase noise levels despite slowing down vehicles in their residential area. This concern is mainly due to the increased vehicle decelerations and accelerations when navigating over the vertical measures. However, an additional issue in Malaysia is that road hump installations tend to differ in dimensions, which previous literature has stated can reduce hump effectiveness on traffic speed and noise. Due to residents’ increasing concerns on high vehicle speeds and traffic noise in their residential surroundings, and the prevalence of using road humps in Malaysian residential areas, it is therefore important to assess the residents’ perceptions on whether road humps have benefitted them by reducing speed and noise. This paper intends to assess the factors related to hump dimensions that affect residents’ perceptions of road hump effectiveness on speed and noise levels. The field survey findings are also covered briefly, together with residents’ satisfaction with existing traffic speed and noise levels.
2. Related Works
Previous works by Daniel [1], Kojima, Kubota, Yoshida, Ichihara and Yoshida [2] and Ewing [3] have indicated that road humps are effective in reducing vehicle speeds. In the New Zealand case study, Daniel [1] summarized that road humps with a Watts profile can reduce mean speeds by 6km/h and 85th percentile speeds by 7km/h. Kojima et al. [2] stated that the road humps used in their studies in Japan had reduced average vehicle speeds by 5 percent as compared to when the humps were removed. Also, Ewing [3] stated that 12' feet humps and 14' humps in the United States reduced vehicle speeds by an average of 7.6mph and 7.7mph respectively, which results in a 22 percent and 23 percent speed reduction. The only potential issue is that vehicle speeds may increase at vertical devices when device heights and spacings are inappropriate, as reported by Mao and Koorey [4].
On the other hand, studies conducted by Abbott, Taylor, and Layfield [5] and Bendtsen and Larsen [6] proved that road humps could reduce traffic noise levels by reducing vehicle speeds. Abbott, Taylor, and Layfield [5] stated that the installation of road humps reduced the average noise level from light vehicles by 3.9dB(A) midway and 8.2dB(A) alongside the hump, which corresponded with the speed reductions of 13 km/h and 19km/h respectively. Bendtsen and Larsen’s [6] study indicated that noise levels reduced by 2 to 3dB at humps and 1dB at the midpoint between 2 humps, which corresponded with speed reductions ranging from 5 to 14km/h. A graph that compared the noise levels for locations at and near the hump with predicted ‘before’ levels showed that the levels were lowest at the hump.
However, the noise levels can also increase near humps due to rapid acceleration and deceleration (Hidas, Weerasekera and Dunne [7]; Wewalwala and Sonnadara [8]. Wewalwala and Sonnadara’s [8] study indicated that LAeq was highest as the vehicles approached 20m after the road hump, with heavy vehicles and three-wheelers found to be the highest contributors to the noise levels. The study by Lee, Joo, Oh and Choi [9] also demonstrated that the impacts of road humps could also vary greatly with type, geometry, location, and spacing. They also concluded that the road humps of 3m and 4m width resulted in the highest vehicle acceleration rates and noise levels due to the abrupt changes in speed. Also, Bendtsen and Larsen [6] conducted a social survey to assess the annoyance rate among those living 20-30m away from road humps and those living farther away. Questions asked included whether respondents were annoyed by the traffic noise while inside their residences with the windows closed. At the roads with 60km/h speed limit, 43% of those living near humps reported being annoyed or very annoyed as compared to 13% respondents living far from the road hump. The result shows that the installation of road humps can increase noise annoyance for the residents. Thus it is indicated that despite the speed and noise reductions as discussed above, road humps may not necessarily help improve the living conditions of residential areas.
3. Site Background
The study was conducted in the residential areas of Keramat, Setiawangsa, and Putrajaya in Malaysia. Two sites were selected for each area, which brings the total number of sites to six. The location of each site is as per Figure 1.
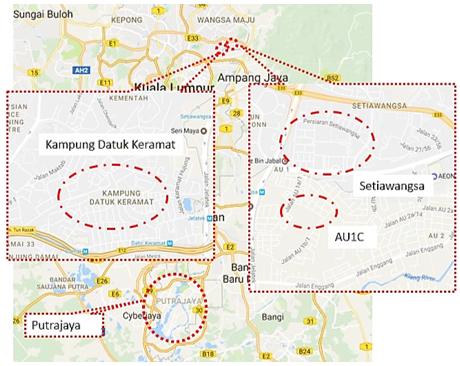
Kampung Datuk Keramat is located within the boundary of the Federal Territory of Kuala Lumpur and is located in the northeast of downtown Kuala Lumpur, bordering the Ampang District in Selangor. Taman Keramat AU1C is located within the Ampang Jaya boundary. Both Kampung Datuk Keramat and Taman Keramat AU1C are older residential areas, which are characterized by narrow two-lane roads. Roads in and out of the Keramat area cater to local and through traffic, particularly for motorists wanting to connect to major roads such as Jalan Jelatek and Jalan Enggang. Kampung Datuk Keramat is mostly comprised of old bungalow plots, while Taman Keramat AU1C has a mixture of bungalow and terrace houses.
Taman Setiawangsa is an eastern suburb of Kuala Lumpur and falls under the jurisdiction of Kuala Lumpur City Hall. Located less than 4 kilometers from the KL city center and bordering the Ampang area, it is newer than Keramat, and the last phase of construction was completed in 2006. It is bordered by major roads such as Jalan Taman Setiawangsa and Jalan Jelatek and is directly accessible by the Duta-Ulu Kelang Expressway (DUKE). The housing composition is a mixture of terrace houses, bungalows, and low-rise apartments.
Putrajaya, the current administrative capital of Malaysia, is located within Sepang District. Putrajaya is a planned township and is divided into 20 precincts consisting of administration buildings, residential areas, educational institutions and open spaces. This study selected one residential precinct (Precinct 11), which is characterized by a proper road hierarchy and thus invites less cut-through traffic. Precinct 11’s housing composition currently includes terrace houses, semi-detached houses, and high-rise apartments. Bungalow lots are also shown in the masterplan; however, they had yet to be constructed when this study was conducted.
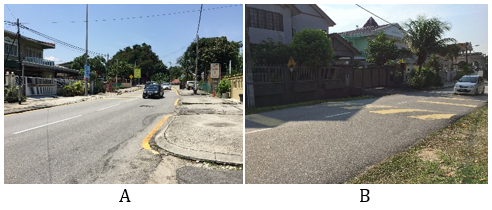
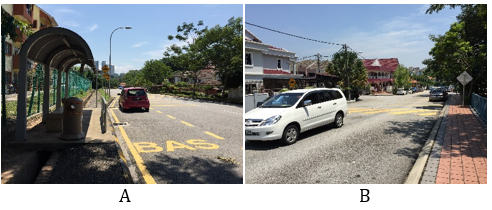
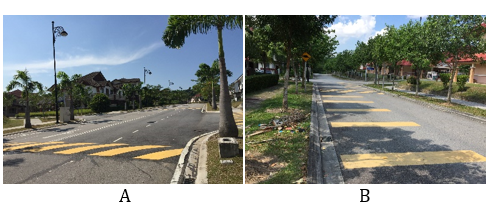
The site photos showing existing site conditions are shown in Figures 2 to 3 below.
4. Methodology
The questionnaire survey was divided into three sections. Key questions asked in Section A were on residents’ satisfaction on existing traffic volume, traffic noise levels and traffic speeds in their area, with the Likert scale ranging from 1 for ‘Extremely Unsatisfied’ to 5 for ‘Extremely Satisfied.' Section B focused on their agreement on whether road humps have improved traffic speed, traffic volume and traffic noise levels in their area. Respondents were also asked whether they agreed that the existing hump characteristics, spacing, and location were appropriate. The Likert scale used in this section ranged from 1 for ‘Strongly Disagree’ to 5 for ‘Strongly Agree.' Section C requested information on the respondents’ background including employment characteristics, their period of residence in the residential area and type of tenure, with questions ranging from open-ended questions on vehicle ownership to questions with categorical answers for tenure, years of residence and socioeconomic status. However, due to the lower responses in categories 1and 5 for Sections A and B, the scale was collapsed into three for data analysis.
The survey was conducted in November 2015 at Keramat, Setiawangsa, and Putrajaya, and distributed through both home drop-off and face-to-face surveys. The population consisted of houses that were located up to a 400 meters radius from the selected road humps and were directly accessible from the selected road. Any major roads crossing the area also served as boundaries for the residential parcels. The sample sizes for each area were calculated based on Krejcie and Morgan [10], and the proportional approach by Pandey and Verma [11] was later used to calculate the proportional allocation of samples according to each residential road and house type. The sample sizes for Keramat, Setiawangsa, and Putrajaya were determined to be 269, 273 and 269 respectively. Out of the total sample size, 478 completed questionnaires were collected with a response rate of 58.9 percent. However, the response rates for Setiawangsa and Putrajaya were considerably lower (40.3% and 58.3% respectively) compared to Keramat (78.4%). The disparity is due to residents’ reluctance to partake in the survey, particularly in Setiawangsa.
The questionnaire data was then analyzed using two methods. The chi-square test of independence was used to analyze the responses by area, while binary logistic regression models were used to identify the variables that statistically significantly affected respondents’ opinions on whether or not existing road humps have improved their living environment.
5. Respondents’ Background
5.1. Keramat
The Keramat sample comprised of 48.3 % males and 51.7% females, out of which a total of 32.3% were aged 51 and above. The average household size was 5.13, while the mean number of earning household members was 2.45.
41.2% reported having lived in the area for more than 21 years, with 38.9% stating that they had lived in the same house for over 21 years. Also, 55.9% stated that they owned the current residence and 44.1% were renting. Out of the 211 respondents, 45% of the respondents were living in terrace houses, 33.2% in bungalows and another 21.3% in flats.
Regarding vehicle ownership, the respondents relied mostly on cars and motorcycles. 84.4% of the respondents own one car or more, while 67.8% own at least one motorcycle.
5.2. Setiawangsa
More than half of the respondents in Setiawangsa were male, with 56.4%; the age distribution of male respondents was relatively uniform for the 20-30, 31-40, 41-50 and 51-60 age brackets. In comparison, the majority (39.6%) of female respondents were 41-50 years old. The average household size was 4.82, and the mean number of earning household members was 2.01.
51% of the respondents were found to have lived for ten years or less in the current residential area, while 22.7% reported having lived there for more than 21 years. 70% of respondents own their houses, which is considerably higher than the percentage of homeowners in Keramat. Out of the 110 respondents, 55.5% lived in terrace houses, 34.5% in flats and 9.1% in apartments.
Car ownership was higher in Setiawangsa as compared to Keramat, with 94.5% owning one car or more. Subsequently, motorcycle ownership was lesser in Setiawangsa with 62.7% owning at least one motorcycle.
5.3. Putrajaya
The sample in Putrajaya comprised of 49% male and 51% female respondents. Most of those surveyed (70.7%) were 31-50 years of age. The average household size was 4.9, and the mean number of earning members in the household was 1.96.
59.9% of the respondents were found to have lived for five years or less in Putrajaya. The percentage of respondents renting are far higher here than in Setiawangsa or Keramat (64.3%) because the houses in the selected area are mostly government quarters. Out of the 157 respondents, 47.8% lived in terrace houses, 50.3% in semi-detached houses and 1.9% in apartments.
Car dependency is high in Putrajaya, with 98.7% of respondents owning one or more cars. A majority of them (50.3%) own two. On the other hand, only 45.2% of the respondents own one or more motorcycles.
6. Residents’ Perceptions of Road Hump Effects on Traffic Noise and Vehicle Speed
6.1. Perception of Speed with 'Road Humps have Improved the Living Environment (LE)’, ‘Satisfaction with Daytime Speeds’ and ‘Satisfaction with Nighttime Speeds’
Figure 5 shows the residents’ perceptions on whether existing road humps have improved their living environment by reducing speed. 67.5% of the residents living in Putrajaya agreed that road humps had improved their living environment by reducing speed. The field measurement on vehicle speeds showed that speeds were lowest, while road hump heights were the highest in Putrajaya. On the other hand, 52.6% of the residents in Keramat agreed that road humps had improved their living environment. The height of the road humps along Jalan (street) AU1C/1 in Keramat was unusually low, which prompts residents to state that it is less effective on the speed of the vehicles especially motorcycles. Jalan Keramat also had high traffic volume, with a high composition of motorcycles and a combination of localized and through traffic.
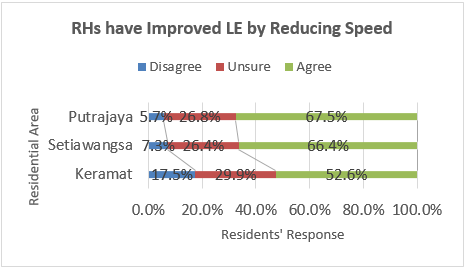
The chi-square test of independence was conducted to assess if there was a statistically significant relationship between residential area and residents’ perceptions of whether road humps have improved the living environment in their area. All expected cell frequencies were greater than five. There was a statistically significant association between residential area and the residents’ perceptions as shown in Figure 5, χ2(4)=17.663, p=.001.
The average traffic speeds were measured at all twelve road humps to assess if the perceptions were in line with the conditions. Table 1 shows the speed variations in the selected sites.
Table 1. Characteristics of Road Humps with Vehicle Speed Recorded.
| Road | Road Hump A | Road Hump B | ||||
| Height (mm) | Width (m) | Speed (km/h) | Height (mm) | Width (m) | Speed (km/h) | |
| Jalan P11D (1) | 60 | 2.0 | 20.2 | 60 | 2.0 | 18.0 |
| Jalan P11H/1 (1) | 90 | 3.7 | 16.3 | 70 | 3.8 | 17.6 |
| Jalan AU1C/1 (2) | 30 | 1.7 | 20.3 | 30 | 1.5 | 22.3 |
| Jalan Keramat (2) | 50 | 3.5 | 24.1 | 50 | 3.0 | 22.5 |
| Persiaran Setiawangsa (3) | 80 | 3.2 | 19.1 | 60 | 3.4 | 19.5 |
| Jln Setiawangsa 21 (3) | 60 | 3.5 | 17.9 | 50 | 2.7 | 18.5 |
(1): Putrajaya, (2):Keramat, (3): Setiawangsa.
Note: Speeds shown are the average value of all vehicles in both directions.
Table 1 shows that the highest traffic speeds across Road Hump A and Road Hump B were recorded in Keramat, which had the lowest hump heights (50mm height along Jalan Keramat, 30mm height along Jalan AU1C/1). This result corresponds with the percentage of dissatisfied residents being the highest in Keramat. In comparison, the lowest traffic speeds were recorded at road humps with the highest height (90 mm for Hump A and 70mm for Hump B). Both humps were located along Jalan P11H/1. Lower traffic volumes also contributed to the lower dissatisfaction levels in Putrajaya.
However, it was also noted that the average speed across Jalan P11D Hump A was higher than in Setiawangsa, which is due to the shorter hump width and wider road length at Jalan P11D.
Figure 6 and 7 shows the residents’ satisfaction with the existing daytime and nighttime vehicle speeds. Satisfaction was highest for Putrajaya residents, at 63.7% for daytime and 71.3% for nighttime respectively. Dissatisfaction was higher than satisfaction in both Keramat and Setiawangsa for daytime speeds, while the opposite was noted for nighttime speeds. Dissatisfaction was generally lower in all three areas for nighttime speeds, as compared to dissatisfaction on daytime speeds; this is assumed to be due to residents being more aware of daytime traffic surrounding their residence as they go about their daily activities during the daytime.
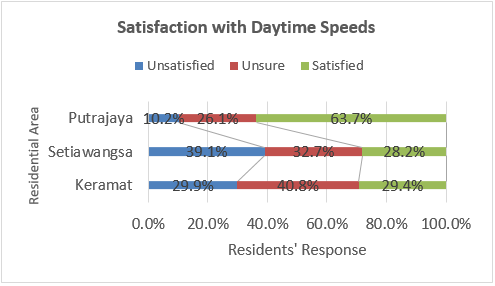
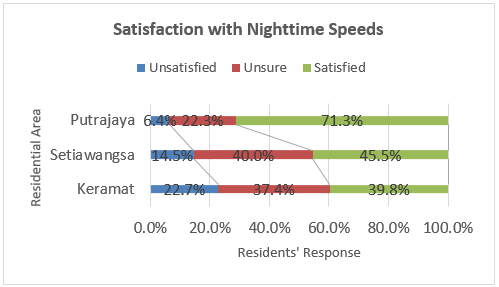
The chi-square test of independence was also conducted to assess if residents’ satisfaction on daytime and nighttime speeds were statistically significantly affected by which residential area they lived in. All expected cell frequencies were greater than five. For daytime speeds, there was a statistically significant association between residential area and the residents’ satisfaction levels as shown in Figure 6, χ2(4)=61.195, p<.0005. The relationship between residential area and satisfaction with nighttime speeds was also statistically significant, χ2(4)=42.404, p<.0005.
6.2. Perception of Noise with ‘Road Humps have Improved Living Environment (LE)’, ‘Satisfaction with Daytime Speeds’ and ‘Satisfaction with Nighttime Speeds’
A high percentage of residents did not perceive that the existing road humps had reduced the noise levels. Figure 8 shows that the residents in Keramat, again, had expressed the highest disagreement (23.7%) that road humps have improved their living environment by reducing noise levels. When interviewed, a resident at Jalan AU1C/1 in Keramat had noted that motorcyclists normally did not slow down at the road humps and they constantly emit louder exhaust noise. As stated previously, Jalan AU1C/1 had unusually low road humps, while the traffic along Jalan Keramat was high and included localized and through traffic. Table 2 shows that the LAeq recorded along Jalan AU1C/1 and Jalan Keramat were the highest (exceeding 64dB at Jalan AU1C/1 and 70dB at Jalan Keramat). On the other hand, 17.3% of the respondents in Setiawangsa have disagreed that the existing road humps have improved their living environment by reducing noise levels. An observation along Persiaran Setiawangsa showed that activities concerning school children studying in a nearby religious school could also contribute to the noise levels. However, it was only intermittent (particularly at 5-6 pm), and at the same time, they were unfamiliar with the administration of the survey.
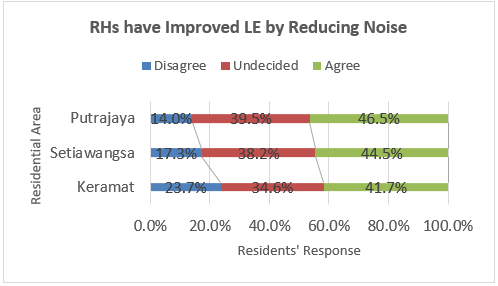
Putrajaya has recorded the lowest percentage of residents disagreeing with that road humps have improved their living environment (14.0%). This lower percentage is attributed to the lower traffic speeds and lower surrounding noise levels. The LAeq recorded along Jalan P11H/1 and Jalan P11D in this residential area were less the permissible noise limit of 60dB, while the traffic volume along Jalan P11H/1 was low with no heavy vehicles observed.
However, the chi-square test for independence determined that the relationship between residential area and the residents’ perceptions was not statistically significant, χ2(4)=5.784, p=.216. All expected cell counts were greater than five. This means that perceptions on whether road humps have improved the living environment by reducing noise did not significantly differ by area, which corresponds with the minimal differences in percentage as shown in Figure 8.
Table 2 also shows that the highest noise levels across Road Hump A and Road Hump B were recorded in Keramat, which had the lowest hump heights among those compared in this study. Also, the high traffic volume along Jalan Keramat also contributed to the noise levels. This result corresponds with the percentage of dissatisfied residents being the highest in Keramat. In particular, the lowest noise levels were recorded along Jalan P11H/1, which had the road humps with the highest heights. The low traffic volume along Jalan P11H/1 also contributed to the lower noise levels along that road.
Table 2. Characteristics of Road Humps with Noise Levels Recorded.
| Road | Road Hump A | Road Hump B | ||||
| Height (mm) | Width (m) | Noise (dB) | Height (mm) | Width (m) | Noise (dB) | |
| Jalan P11D (1) | 60 | 2.0 | 59.0 | 60 | 2.0 | 58.6 |
| Jalan P11H/1 (1) | 90 | 3.7 | 55.3 | 70 | 3.8 | 54.2 |
| Jalan AU1C/1 (2) | 30 | 1.7 | 64.7 | 30 | 1.5 | 64.4 |
| Jalan Keramat (2) | 50 | 3.5 | 70.8 | 50 | 3.0 | 70.8 |
| Persiaran Setiawangsa (3) | 80 | 3.2 | 63.5 | 60 | 3.4 | 62.9 |
| Jln Setiawangsa 21 (3) | 60 | 3.5 | 60.2 | 50 | 2.7 | 60.2 |
(1): Putrajaya, (2): Keramat, (3): Setiawangsa.
Similar to the analysis for speed, the perception on night time noise levels was selected for cross-tabulation between satisfaction with noise levels and residents’ perception on whether road humps have improved the living environment by reducing noise levels. Again, this decision was undertaken as only the nighttime perception was found to be significantly correlated with the residents’ perception. As the majority of the respondents were employed, it is assumed that they would be more attuned to nighttime conditions while they are at home.
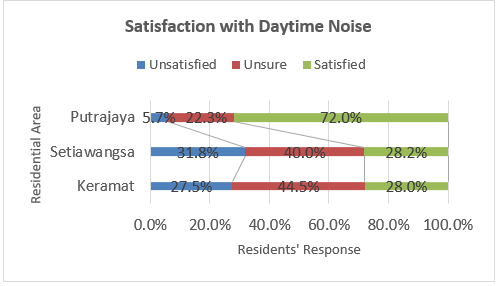
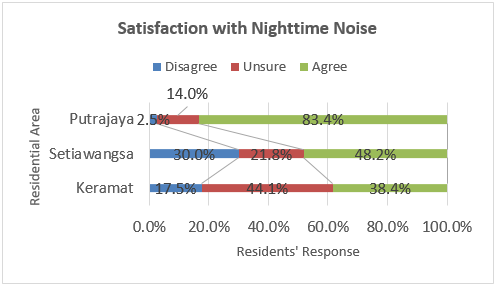
Figure 9 and 10 shows the residents’ satisfaction with the existing daytime and nighttime traffic noise. Similar to the finding for vehicle speed, satisfaction was again highest for Putrajaya residents; 72% reported being satisfied with daytime noise levels, while 83.4% were satisfied with nighttime noise levels. This finding corresponds well with the lower noise levels measured in the area. Dissatisfaction was generally higher in Setiawangsa than in Keramat, despite the higher noise levels recorded along Jalan Keramat and Jalan AU1C/1. It is assumed that having lived longer in the area has made residents in Keramat more accustomed to the noise levels they are subjected to on a daily basis, or that residents there have access to parts of their dwelling that are less exposed to outside noise levels.
The chi-square test of independence determined that residents’ satisfaction on daytime and nighttime noise levels were statistically significantly affected by which residential area they lived in. All expected cell frequencies were greater than five. The relationship between residential area and the residents’ satisfaction levels were statistically significant for daytime noise levels, χ2(4)=88.140, p<.0005 and for nighttime noise levels, χ2(4)=97.398, p<.0005.
The finding in Setiawangsa was found to be in agreement with the field survey results, which determined that noise levels reduced at the road humps but remained above the permissible limits. Noise readings were also taken 40 meters away from the humps, to assess the reduction at the road humps. It was noted from the field survey that the LAeq on Jalan Setiawangsa 21 reduced by 3.7dB at the road humps, and LAeq on Persiaran Setiawangsa reduced by 0.9-1.5dB at the road humps. The finding above explains why respondents were able to agree on the hump effectiveness despite being unsatisfied with the current conditions. Also, a comparison of Figures 5 and 8 also show that respondents in all three areas were more likely to agree that road humps have reduced speed as compared to noise.
7. Binary Logistic Regression Model
7.1. Relationship between Hump Design Factors with Residents’ Perceptions on Whether Road Humps have Improved Living Environment by Reducing Traffic Speed
A binary logistic regression model was computed to evaluate the perceptions of the residents regarding the effects of road humps on traffic speed towards improving their living environment. In computing this model, only two categories of the DV were considered: Otherwise (combined “Unsure” and “Disagree”) and “Agree.” Out of 478 respondents, 60.7% agreed that road humps had improved their living environment by reducing traffic speed.
The variables entered as independent variables (IVs) into the model were selected based on the results of the principal component analysis conducted before this analysis. Two components were retained in the analysis; component 1 represents road hump characteristics, and component 2 represents speed and accident reductions. Both components explain 60.6% of the variance.
All variables were subsequently selected from the component that focused on the residents’ perceptions regarding existing hump characteristics, as shown in Table 3. For IV 1 to 6, the IVs/ predictors consisted of three response categories: “Disagree,” “Unsure” and “Agree”; of which “Agree” was selected as the reference category. While for IV 9, the IVs/ predictors consisted of the response categories “Unimportant,” “Unsure” and “Important”; with “Important” determined as the reference category.
The variables ‘Residential Area’ and ‘Type of House’ were also included in the model to assess the contribution of these variables on the dependent variable.
Table 3. Hump Characteristic-Related Predictor Variables to Predict Respondents’ Agreement.
| DV | Road Humps have Improved Living Environment by Reducing Traffic Speed |
| IV | 1. Number of road humps installed is sufficient for a safer environment (Reference Category: Agree) |
| 2. Spacing between road humps is sufficient for significant speed reduction (Reference Category: Agree) | |
| 3. Road hump heights are appropriate in enforcing the speed limit (Reference Category: Agree) | |
| 4. Road hump heights are consistent (Reference Category: Agree) | |
| 5. Road humps are installed where they are required (Reference Category: Agree) | |
| 6. Drivers can comfortably cross road humps (Reference Category: Agree) | |
| 7. Residential Area (Reference Category: Putrajaya) | |
| 8. Type of House (Reference Category: Bungalow) | |
| 9. Importance of Lower Traffic Speeds in Improving the Living Environment (Reference Category: Important) |
Table 4 lists the coefficients of the independent variables included in the model. The Wald statistics and the significance indicate that the variables that significantly contribute to the DV (p=<0.01) were:
- The number of road humps installed is sufficient for a safer environment
- Road hump heights are appropriate in enforcing the speed limit
- Road humps are installed where they are required
- Type of House
- The importance of Lower Traffic Speeds in Improving the Living Environment.
In order to not violate the assumptions that indicate the model’s goodness of fit, the model’s significance value reported in the Omnibus Tests of Model Coefficients (goodness of fit test) must be p<0.005. On the other hand, the Hosmer-Lemeshow significance value should be p>0.005 [12]. These assumptions were adhered to, with the goodness of fit significance value at p=<0.005 and a Hosmer-Lemeshow significance value of 0.191.
The beta coefficient for those unsure whether the number of road humps was sufficient for a safer environment was negative. The odds ratio revealed that those who agreed on the sufficiency of existing road humps were 2.65 times more likely (Exp(B): 0.377) to agree that road humps have improved the living environment as compared to those who were unsure. On the other hand, the beta coefficient estimated for those who disagreed was positive, but the Wald statistic estimated was found not statistically significant, and the odds ratio will not be elaborated further. Those who agreed that road humps have been installed where required were found to be 2.75 times more likely (Exp(B); 0.363) to agree that road humps have improved the living environment, as compared to those who were unsure.
In regards to the perception of whether road hump heights were appropriate in enforcing the speed limits, the beta coefficient estimated for those who disagreed was negative. Based on the calculated odds ratio, this means that those who agreed on the appropriateness of existing road hump heights were 11.49 times more likely (Exp(B); 0.087) to agree that road humps have improved the living environment as compared to those who disagreed.
In the case of this model, the different residential areas were found to not significantly contribute to the model’s predictive power (p>0.005). Hence no further models were run to assess the respondents’ perceptions in each residential area.
On the other hand, the type of house was found to be a statistically significant predictor in this model. The third and fourth types (terrace and semi-d) reported positive beta coefficients and statistically significant Wald statistics; those who lived in terrace houses were 2.27 times and those in semi-ds 5.76 times more likely to agree that road humps have improved the living environment relative to those who lived in bungalows. A plausible reason was that those living in bungalows were interviewed along Jalan Keramat and Jalan AU1C/1; the issue for Jalan Keramat was that houses were fronting a busy cut-through road, while residents in Jalan AU1C/1 specifically complained that motorcycles did not slow down at the humps. Those who lived in the first and second types (flats and condominiums/ apartments respectively) also reported a positive beta coefficient relative to those in bungalows; however as the Wald statistics were not statistically significant, the odds ratios will not be elaborated further.
Table 4. Results of the Binary Logistic Regression Model
| DV= Road Humps have Improved Living Environment by Reducing Traffic Speed | |||||
| IV | β | SE | Wald | p-value | Exp(B) |
| Constant | 1.279 | .234 | 29.760 | .000 | 3.592 |
| No of RHs installed are sufficient for a safer env. | 11.138 | .004 | |||
| No of RHs installed are sufficient for a safer env. (1) | .434 | .536 | .656 | .458 | 1.543 |
| No of RHs installed are sufficient for a safer env. (2) | -.976 | .354 | 7.607 | .006 | .377 |
| Spacing between RHs is sufficient for significant speed reduction | 1.326 | .515 | |||
| Spacing between RHs is sufficient for significant speed reduction (1) | -.648 | .563 | 1.323 | .250 | .523 |
| Spacing between RHs is sufficient for significant speed reduction (2) | -.121 | .370 | .107 | .743 | .886 |
| RH heights are appropriate in enforcing the speed limit | 21.109 | .000 | |||
| RH heights are appropriate in enforcing the speed limit (1) | -2.442 | .559 | 19.095 | .000 | .087 |
| RH heights are appropriate in enforcing the speed limit (2) | -.092 | .382 | .058 | .809 | .912 |
| RH heights are consistent | 3.276 | .194 | |||
| RH heights are consistent (1) | .951 | .526 | 3.273 | .070 | 2.588 |
| RH heights are consistent (2) | .226 | .355 | .404 | .525 | 1.253 |
| RHs are installed where they are required | 8.270 | .016 | |||
| RHs are installed where they are required (1) | -.412 | .511 | .652 | .419 | .662 |
| RHs are installed where they are required (2) | -1.013 | .353 | 8.225 | .004 | .363 |
| Drivers can comfortably cross road humps | .185 | .911 | |||
| Drivers can comfortably cross road humps (1) | .131 | .417 | .098 | .754 | 1.140 |
| Drivers can comfortably cross road humps (2) | .132 | .343 | .149 | .699 | 1.142 |
| Type of House | 11.000 | .027 | |||
| Type of House (1) | .681 | .434 | 2.465 | .116 | 1.975 |
| Type of House (2) | 2.290 | 1.192 | 3.690 | .055 | 9.874 |
| Type of House (3) | .822 | .395 | 4.327 | .038 | 2.275 |
| Type of House (4) | 1.752 | .570 | 9.428 | .002 | 5.763 |
| Residential Area | 1.559 | .459 | |||
| Residential Area (1) | .454 | .365 | 1.554 | .213 | 1.575 |
| Residential Area (2) | .286 | .398 | .515 | .473 | 1.331 |
| Importance of Lower Traffic Speed in Improving LE | 29.939 | .000 | |||
| Importance of Lower Traffic Speed in Improving LE (1) | -1.367 | .384 | 12.701 | .000 | .255 |
| Importance of Lower Traffic Speed in Improving LE (2) | -1.294 | .262 | 24.462 | .000 | .274 |
| Model Chi-square | 169.685 | .000 | |||
| -2Log likelihood | 471.030 | ||||
| Cox & Snell R square | .299 | ||||
| Nagelkerke R square | .405 | ||||
Note: RH= Road Hump, LE= Living Environment.
Categories for Type of House: 1=Flat, 2=Condo/Apartment, 3= Terrace, 4= Semi-D, 5= Bungalow.
Categories for Residential Area: 1= Keramat, 2= Setiawangsa, 3= Putrajaya.
The perception of whether lower traffic speed is important in improving the living environment also had a Wald statistic that was statistically significant. Both categories of Unimportant and Unsure reported negative beta coefficients. Those who thought lower traffic speeds were vital to a good living environment were 3.92 times more likely (Exp(B):0.255) to agree that road humps have improved the living environment as compared to those who stated lower traffic speed is unimportant. On the other hand, those who agreed on the importance were 3.65 times more likely to agree on the effectiveness of the existing road humps as compared to respondents who were not sure of the importance of lower traffic speeds (Exp(B): 0.274).
The logistic regression model was statistically significant, χ2(20)= 169.685, p=<0.0005. The values for the Cox & Snell and Nagelkerke R2 values indicated that the IVs predicted 29.9% to 40.5% of the DV. The model correctly classified 75.9% of the cases, with sensitivity at 82.8% and specificity of 65.4%.
7.2. Relationship between Hump Design Factors with Residents’ Perceptions on Whether Road Humps Have Improved Living Environment by Reducing Traffic Noise
A binary logistic regression model was run to assess the effects of noise-related perception variables on the likelihood that respondents agreed road humps had improved the living environment. Similar to the speed model, only two categories of the DV were considered: Otherwise (combination of Unsure and Disagree) and Agree. The total number of cases was 478, of which only 43.9% stated that they agreed road humps had improved their living environment by reducing traffic noise. The percentage is considerably lower than the 60.7% reported for traffic speed.
Similar to the model for speed, the variables entered as IVs into the model were selected based on the components retained in the factor analysis previously conducted. The two components retained in the final analysis represented road hump characteristics and vehicle noise reductions, and both components explained 61% of the variance. This model includes the variables listed under the road hump characteristics component, which can be seen in Table 5. For IV 1 to 6, the IVs/ predictors consisted of three response categories: “Disagree,” “Unsure” and “Agree”; of which “Agree” was selected as the reference category. While for IV 9, the IVs/ predictors consisted of the response categories “Unimportant,” “Unsure” and “Important”; with “Important” determined as the reference category.
The variables ‘Residential Area’ and ‘Type of House’ were also included in the model to assess the contribution of these variables on the dependent variable.
Table 5. Hump Characteristic-Related Predictor Variables to Predict Respondents’ Agreement.
| DV | Road Humps have Improved Living Environment by Reducing Traffic Noise |
| IV | 1. Number of road humps installed is sufficient for a safer environment (Reference Category: Agree) |
| 2. Spacing between road humps is sufficient for significant speed reduction (Reference Category: Agree) | |
| 3. Road hump heights are appropriate in enforcing the speed limit (Reference Category: Agree) | |
| 4. Road hump heights are consistent (Reference Category: Agree) | |
| 5. Road humps are installed where they are required (Reference Category: Agree) | |
| 6. Drivers can comfortably cross road humps (Reference Category: Agree) | |
| 7. Residential Area (Reference Category: Putrajaya) | |
| 8. Type of House (Reference Category: Bungalow) | |
| 9. Importance of Lower Traffic Noise in Improving the Living Environment (Reference Category: Important) |
The Wald statistics and the significance values indicated that the variables that significantly contributed to the DV (p=<0.01) were:
- Road hump heights are appropriate in enforcing the speed limit
- Road humps are installed where they are required
- Type of House
- The importance of Lower Traffic Noise in Improving the Living Environment.
As stated prior for the model on speed, the model’s significance value reported in the Omnibus Tests of Model Coefficients (goodness of fit test) must be p<0.005 and the Hosmer-Lemeshow significance value should be p>0.005 to indicate a good fit [12]. These assumptions were not violated for this model, with the goodness of fit significance value at p=<0.005 and a Hosmer-Lemeshow significance value of 0.348.
The beta coefficients estimated for respondents’ perception on whether road hump heights were appropriate in enforcing the speed limits were negative. Based on the calculated odds ratio, those who agreed on the appropriateness of existing road hump heights were 3.57 times more likely (Exp(B): 0.280) to agree that road humps have improved the living environment as compared to those who disagreed. Similarly, the beta coefficients for ‘Road humps are installed where they are required’ were negative. Those who had noted their agreement were more than 3 times more likely (Disagree OR: 3.86, Exp(B): 0.259; Unsure OR: 3.41, Exp(B): 0.293) to agree that road humps have improved the living environment relative to those who disagreed or were unsure.
Table 6. Results of the Binary Logistic Regression Model.
| DV= Road Humps have Improved Living Environment by Reducing Traffic Noise | |||||
| IV | β | SE | Wald | p-value | Exp(B) |
| Constant | 1.120 | .520 | 4.641 | .031 | 3.064 |
| No of RHs installed are sufficient for a safer env. | .264 | .876 | |||
| No of RHs installed are sufficient for a safer env. (1) | -.242 | .474 | .262 | .609 | .785 |
| No of RHs installed are sufficient for a safer env. (2) | -.070 | .327 | .046 | .831 | .933 |
| Spacing between RHs is sufficient for significant speed reduction | .057 | .972 | |||
| Spacing between RHs is sufficient for significant speed reduction (1) | -.126 | .542 | .054 | .816 | .882 |
| Spacing between RHs is sufficient for significant speed reduction (2) | -.043 | .334 | .017 | .897 | .958 |
| RH heights are appropriate in enforcing the speed limit | 6.762 | .034 | |||
| RH heights are appropriate in enforcing the speed limit (1) | -1.274 | .490 | 6.753 | .009 | .280 |
| RH heights are appropriate in enforcing the speed limit (2) | -.278 | .338 | .676 | .411 | .757 |
| RH heights are consistent | 4.215 | .122 | |||
| RH heights are consistent (1) | -.064 | .424 | .023 | .880 | .938 |
| RH heights are consistent (2) | -.606 | .313 | 3.764 | .052 | .545 |
| RHs are installed where they are required | 16.848 | .000 | |||
| RHs are installed where they are required (1) | -1.350 | .511 | 6.983 | .008 | .259 |
| RHs are installed where they are required (2) | -1.228 | .326 | 14.174 | .000 | .293 |
| Drivers can comfortably cross road humps | .236 | .889 | |||
| Drivers can comfortably cross road humps (1) | -.063 | .397 | .025 | .874 | .939 |
| Drivers can comfortably cross road humps (2) | .117 | .303 | .150 | .699 | 1.124 |
| Type of House | 9.797 | .044 | |||
| Type of House (1) | .689 | .435 | 2.503 | .114 | 1.991 |
| Type of House (2) | -1.523 | .925 | 2.713 | .100 | .218 |
| Type of House (3) | .289 | .390 | .550 | .458 | 1.335 |
| Type of House (4) | -.288 | .548 | .276 | .599 | .750 |
| Residential Area | 1.658 | .437 | |||
| Residential Area (1) | -.132 | .344 | .147 | .702 | .877 |
| Residential Area (2) | -.449 | .375 | 1.433 | .231 | .639 |
| Importance of Lower Traffic Noise in Improving LE | 14.948 | .001 | |||
| Importance of Lower Traffic Noise in Improving LE (1) | -1.201 | .354 | 11.496 | .001 | .301 |
| Importance of Lower Traffic Noise in Improving LE (2) | -.715 | .264 | 7.323 | .007 | .489 |
| Model Chi-square | 133.006 | .000 | |||
| -2Log likelihood | 522.588 | ||||
| Cox & Snell R square | .243 | ||||
| Nagelkerke R square | .325 | ||||
Note: RH= Road Hump, LE= Living Environment
Categories for Type of House: 1=Flat, 2=Condo/Apartment, 3= Terrace, 4= Semi-D, 5= Bungalow.
Categories for Residential Area: 1= Keramat, 2= Setiawangsa, 3= Putrajaya.
Interestingly, even though the variable ‘Type of house’ was found to be a statistically significant predictor in this model, no statistically significant Wald statistics were reported for any of the categories. Such a finding indicates that the respondents living in different types of houses did not significantly differ in their perceptions on whether road humps have improved the living environment.
The perception of whether lower traffic noise is important in improving the living environment also had a Wald statistic that was statistically significant. The beta coefficients for respondents replying ‘Unimportant’ and ‘Unsure’ were negative. Those who opined that lower traffic speeds were vital to a good living environment were 3.32 times more likely (Exp(B): 0.301) than those who disagreed, and 2.04 times more likely (Exp(B): 0.489) than those unsure, to agree that road humps have improved the living environment.
Similar to the speed model, the different residential areas did not significantly contribute to the model’s predictive power (p>0.005). Hence no further models were run to assess the respondents’ perceptions in each residential area.
The logistic regression model was statistically significant, Ç̲(20)=133.006, p=<0.0005. The values for the Cox & Snell and Nagelkerke R2 values indicated that the IVs predicted 24.3% to 32.5% of the DV. The model correctly classified 72% of the cases, with sensitivity at 69.0% and specificity of 74.3%.
Conclusions
This paper discussed the perceptions of residents regarding the effect of road humps on their residential living environments, along with a summary of the noise levels and vehicle speeds recorded at the selected road humps. The differences in hump dimensions were shown to have an effect on the noise levels and vehicle speeds, with the lowest noise levels and vehicle speeds recorded at road humps with the highest heights. The lowest vehicle speeds and noise levels were also recorded along Jalan P11H/1, while the highest speeds and noise levels were along Jalan Keramat. Similarly, residents in Putrajaya were most likely to agree that road humps have improved their living environment while residents in Keramat were least likely to agree as such. Residents in all three areas were also more likely to agree that road humps have improved the living environment by reducing speed as compared to reducing noise levels. Residential areas were deemed not to be significant in predicting the respondents’ perceptions on existing road humps, indicating that responses did not vary much among the selected areas. From the results as discussed above, it can be summarized that due to factors such as inadequate hump height and proximity to a busy road, residents in bungalow houses were less likely to agree that road humps have improved the living environment by reducing vehicle speeds. Residents who were unsure or thought that lower traffic speeds and noise were unimportant in improving the living environment were also less likely to agree that road humps have improved their living environment. Also, residents who disagreed that existing road humps were installed where required, and at appropriate heights, were less likely to agree that the road humps have improved their environment by reducing vehicle speeds and traffic noise. It is indicative that respondents’ perceptions on the suitability of hump heights and locations are vital in determining the likelihood of them having a favorable view of road humps in their neighborhood.
Acknowledgements
The authors would like to express their sincere gratitude to MOSTI for providing the research grant for this project (Project ID 06-01-08-SF0201).
References
[1] B. D. Daniel, “The Impacts of Neighbourhood Traffic Management,” Ph.D. Thesis, University of Canterbury, 2012. View Thesis
[2] A. Kojima, H. Kubota, M. Yoshida, S. Ichihara, and S. Yoshida, “Effectiveness of Speed Humps Ranged at Different Intervals Considering Roadside Environment including Vehicle Speed, Noise and Vibration,” Journal of the Eastern Asia Society for Transportation Studies, vol. 9, pp.1913-1924, 2011. View Article
[3] R. H. Ewing, “Traffic Calming: State of the Practice,” Institute of Transportation Engineers, 1999. [Online]. Available: https://nacto.org/wp-content/uploads/2012/06/Ewing-Reid-1999.pdf
[4] J. Mao, and G. Koorey, “Investigating and modelling the effects of traffic calming devices,” In IPENZ Transportation Group Conference, pp.1-14, 2010.
[5] P. Abbott, M. Taylor, and R. Layfield, “The effects of traffic calming measures on vehicle and traffic noise,” in Traffic Engineering & Control: TRL Limited, 1997.
[6] H. Bendtsen, and L.E. Larsen, “Noise and nuisance from road humps,” In International Congress and Exhibition on Noise Control Engineering, 2000. View Article
[7] P. Hidas, K. Weerasekera, M. Dunne, “Negative effects of mid-block speed control devices and their importance in the overall impact of traffic calming on the environment,” Transportation Research Part D, vol. 3, no. 1, pp. 41-50, 1998 View Article
[8] S. N. Wewalwala, and D. U. J. Sonnadara, “Traffic noise enhancement due to speed bumps,” Sri Lankan Journal of Physics, vol. 12, pp.1-6, 2011. View Article
[9] G. Lee, S. Joo, C. Oh, and K. Choi. “An evaluation framework for traffic calming measures in residential areas,” Transportation Research Part D, vol. 25, pp. 68-76, 2013. View Article
[10] R. V. Krejcie, and D. W. Morgan, “Determining sample size for research activities,” Educational and Psychological Measurement, vol. 30, pp. 607-610, 1970. View Article
[11] R. Pandey, and M. R. Verma, “Samples allocation in different strata for impact evaluation of developmental programme,” Rev. Bras. Biom, vol. 26, no. 4, pp. 103-112, 2008.
[12] J. Pallant, SPSS Survival Manual. McGraw-Hill, England, 2016, p. 176.