International Journal of Civil Infrastructure (IJCI)
ISSN: 2563-8084

Volume 3 - Year 2020- Pages 24-40
DOI: 10.11159/ijci.2020.004
Spatial Differentiation and Influencing Factors of Attended Collection and Delivery Points in Nanjing City, China
Muhammad Sajid Mehmood1,2, Gang Li1,2*, Shuyan Xue1,2, Qifan Nie3, Xueyao Ma1,2, Zeeshan Zafar1,2, Adnan Rayit4
1College of Urban and Environmental Sciences, Northwest University
Xi’an 710127, China
2Shaanxi Key Laboratory of Earth Surface System and Environmental Carrying Capacity, Northwest University
Xi’an 710127, China
*
lig@nwu.edu.cn
3Department of Civil, Construction and Environmental Engineering, University of Alabama System, Tuscaloosa
35401, USA
4Agricultural Information Institute, Graduate School Chinese Academy of Agricultural Sciences, Haidian District,
Beijing 100093, China
Abstract - E-commerce and online shopping have become more convenient due to the rapid growth of the internet logistic industry in many developed countries and is particularly popular and suitable in China. The method is primarily based on logistic points like attended collection and delivery points (ACDPs), an emerging industry for economic development. This article includes text analysis, descriptive statistics, and spatial analysis to analyze the operation types, service objects, location distribution, and influencing factors of ACDPs in Nanjing City using point of interest data (POI) of Cainiao stations and China Post stations. The results are as follows: 1) ACDPs have a mainly independent mode of operation, but some are reliant on supermarkets, department stores and individual shops. 2) The main service targets of ACDPs are communities, schools and townships followed by businesses, enterprises, and office buildings. 3) The spatial distribution of ACDPs in Nanjing is asymmetrical, displaying a trend to the northwest direction and a difference in the trend between the N-S and E-W axes. Their layout creates four main core areas and the number of sites decreases with distance from the core. 4) Most of the ACDPs are in urban areas and on residential and industrial land. This study provides insightful ideas for decision makers and planners to help formulate policies that can lead to more sustainable logistic enterprises development and for the companies that want to establish successful CDP networks in big cities.
Keywords: Attended collection and delivery points, China Post stations, Cainiao stations, spatial pattern, influencing factors, Nanjing City.
© Copyright 2020 Authors - This is an Open Access article published under the Creative Commons Attribution License terms. Unrestricted use, distribution, and reproduction in any medium are permitted, provided the original work is properly cited.
Date Received: 2020-09-12
Date Accepted: 2020-10-17
Date Published: 2020-12-23
1. Introduction
Over the past decade, online shopping has become increasingly popular due to the development of information and communication technologies and the widespread access to the Internet, and began to replace traditional shopping methods [1]. For example, in the UK, online sales are expected to extend from 14.5% of total retail sales in 2015 to 19.3% in 2019 [2]. Also, the online sales in New Zealand increased from 6% in 2013 to 7.4% in 2016 [3].
In many European countries, shopping behaviors are changing rapidly. E-commerce has become very popular over the past decade because of the proliferation of IT platforms such as smartphones, tablets, and laptops. Today, about 45% of European shoppers shop online. More precisely, according to the European Commission, 60% of German consumers and 44% of French buyers bought physical and virtual commodities on the Internet at least once in 2013 [4].
Recent electronic commerce has experienced significant growth in various forms, in addition to Business to Business (B2B), Business to Consumer (B2C), and Consumer to Consumer (C2C). Trade channels are growing at a rate of around 20% per year, with total e-commerce revenue in 2014 estimated at around $ 75 billion [5] [6].
In recent years, e-commerce has grown at a double-digit rate and more and more customers are using B2C e-commerce channels to order products online and deliver to their home. However, the supply chain is a new challenge for the logistics industry as it must manage increasing fragmentation to meet customers’ needs. Intense competition, decision makers adopting a consumer-centric economy, suspension of shipments and reverse, and environmental logistics measures have increased the cost of online orders. As a result, the ‘last mile’ is considered the most expensive delivery area [7]–[9].
As recommended by [10] The possible impact of online shopping includes a change in the amount of goods purchased and a change in per capita purchaser expenditure. In addition, online stores can generate trips with the delivery of goods to residential areas and affect the route of the final consumer. The expected advantage of e-shopping for passenger demand is the reduction in travel associated with it. On the other hand, this change may affect freight. First, the supply chain structure needs to be changed to incorporate this part of demand. The purchased product must be distributed to the final consumer (at home or at the pick-up point), the result of which may be related to the delivery of the package and delivery that may be lost (for example, about 12% of the delivery must be a second, [1].
To reduce failure of courier deliveries, a few researches [11]–[14] evaluate alternative delivery methods, as well as Collection and Delivery Point (CDP). CDP is a third-party place where people can retrieve and return products purchased over the Internet and is considered the most cost-effective home delivery option [12]. The CDPs of many European countries (such as the Netherlands, Germany, and France), have become an essential part of the ‘last mile’ movement [15], [16], and CDP is well-defined as the last stop of an enterprise. To consumer delivery services, where the goods are delivered to a certain place (for example, to a place of residence, or a collection point) [17].
If CDPs are located on main roads and close to public transportation hubs, they offer customers with the chance to receive their packages during everyday commuting. Since people no longer need to go to the post office or warehouse separately, this can reduce consumers’ VKT [18].
In addition, when the CDP is in the consumer’s house or near the workplace, instead of traveling by car, you can use non-motorized mode [19]. At the same time, CDPs can also shorten the vehicles-kilometers travel (VKT) of courier companies, because of reduced delivery locations and re-delivery times [20]. Along with CDPs, courier companies do not need to go to every consumer’s household, while packages can be shipped to fewer CDP locations (McLeod and Cherrett, 2009). In addition, CDP can also reduce the risk of package theft; otherwise, these packages will be left unattended at the consumer's doorstep [21].
Shopping, regardless of form, leads to the carriage of goods. In general, shopping also generates consumer traffic. According to data from Sweden and other European countries, shopping trips account for about 20% of all trips and about 10% of the total passenger traffic [22]. Over a third of car shopping trips [23]. However, compared to traditional shopping methods, the impact of e-commerce on travel distance and mode distribution is not fully understood [24]. Although more and more online shopping trends may affect traffic in the future. In addition, in addition to influencing the volume of traffic, modes of movement can also change. Currently, courier, courier and parcel companies are facing serious problems in the city related to urban logistics and last mile delivery (new models of stores and logistics), which has led to an increase in delivery volumes [17], [25].
Scholars have been gradually deepening their research on logistics distribution and pickup points since the implementation of the first pickup point in 2000. [26] analyzed the role of geographical location in the express delivery industry and its position in the spatial organization of logistics activities in Paris. [16] found that there were many advantages in the network development of store pickup points and automated lockers according to a comparative study between France and Germany. [27] analysed the e-commerce pickup network and found that the population, type of land, and residential family pattern, among other factors, have a considerable impact on the layout of pickup points.
Other researchers explored the business model of e-commerce logistics through big data analysis, revealing the basic patterns of “cross-border e-commerce logistics” and analysing the spatial distribution of e-commerce distribution in Belgium during a four-month period, concluding that most problems of cities are related to the last mile of e-commerce logistics [28].
It has been observed that some socio-demographic characteristics are associated with the use of service points. [15], found in a study of online purchasers in the Netherlands that consumers with moderate or high experience with online shopping and limited time use service points more often. It was also noted that women consumers are more likely to use such products. In addition, according to a study by [27]. In France, factors such as home broadband saturation, possession of advanced electronic equipment, frequency of purchase, and the type of residential property (apartment or family home) are key component in determining potential CDP locations.
Typically, the study of delivery points has focused on macro and broad levels. Most discussions about points of delivery services involve courier companies, consumers, demographic factors, behavior, and problems with the delivery of the "last mile". Although little attention was paid to the choice of CDPs. Limited researches examine protected CDPs, and few examine a typical case from a micro-perspective. Visiting collection and distribution points is very essential for resolving the logistical problem of the “last mile”, and their respective spatial characteristics play a vital role in the city.
However, no study has investigated the influencing factors of ACDPs, particularly in the context of where the ACDPs are present on the base of POI data. The aim of this paper is to compare the location of two types of ACDPs with influence factors in the Nanjing city area to analyse the spatial pattern and mechanisms of influence. Firstly, we shed light onto the spatial distribution of the China Post and Cainiao stations by exploring the spatial pattern (i.e., where in Nanjing the ACDPs occur). Secondly, we provide results on support types (e.g., department stores, grocery stores, coffee shops, supermarkets, cigarette and wine shops etc.) and service objects including administrative unit, school, scenic spots, office building and community etc. based on the company name and their addresses. Finally, we analyse the correlation between ACDPs and population, GDP, and land use type. This work helps expand spatial research at the ACDP micro level and provides background information for ACDP location selection and network optimization. This work also served as the scientific basis for optimizing the layout and organization of events in the Chinese logistics industry, and also contributed to solving the problem of the “last mile” in the logistics industry and contributed to the vigorous progress of the Chinese logistics industry.
2. Data Collection and Methods
2.1 Study Area
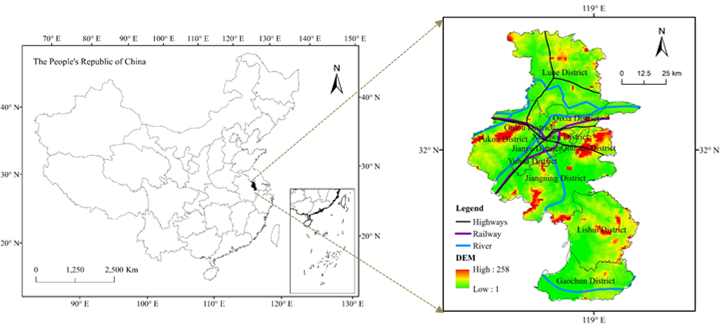
Nanjing (31–14′N - 32–37′N and 118–22′E - 119–14′E) is the capital of Jiangsu Province and the central city of the metropolitan area of Nanjing, located in eastern China in the lower reaches of the Yangtze River and offshore of the Lancang River. As an important central city in eastern China, this city has important national scientific and educational bases and a comprehensive transportation hub approved by the State Council. As of 2018, the city has 11 districts with a total area of 6,587 square kilometers, a built-up area of 971.62 square kilometers, a permanent population of 8.362 million people, an urban population of 6.599 million people and an urbanization rate of 82.5%. It is the only city in the Yangtze River Delta and East China, as well as the International Yangtze River Logistics Center. The Yangtze River Delta exudes an important national gateway for the development of the central and western regions. Nanjing is an important city hub at the strategic crossroads of the eastern coastal economic zone and the Yangtze River economic zone.
Nanjing is China's first national historical and cultural city, an important birthplace of Chinese civilization, and the long-term political, economic, and cultural centre of South China. In the history of the blessings China's Zhengshuo, Nanjing was engaged in human activities from 100,000 to 1.2 million years ago, and the Nanjing humanoid lived in Tangshan from 350,000 to 600,000 years ago. It has a history of more than 7000 years of civilization, a history of urban construction of nearly 2600 years and a history of the construction of the capital for almost 500 years, is known as the " six ancient capitals " and " ten dynasties".
2.2 Data Sources
The use of GIS based information in the field of geography is becoming increasingly common due to rapid advancement in the field of internet technology. Points of Interest (POI) data is a new type of facts that consists of latitude and longitude information, specific location names, categories, and other attribute facts, and plays a crucial function in analysing the characteristics of urban geospatial distribution. Due to the large number and extensive distribution of pilot CDPs, manual records collection is time-consuming and inaccurate, which to some extent impedes progress in getting to know the gathering and transport factors within the region. These POIs have the benefits of wide coverage, excessive popularity accuracy and smooth get right of entry to. POI information can assist to improve the accuracy of micro-surveys at city express sites. Therefore, this look at is based on POI facts and uses the “POI Query” feature provided by using “Metro Data.
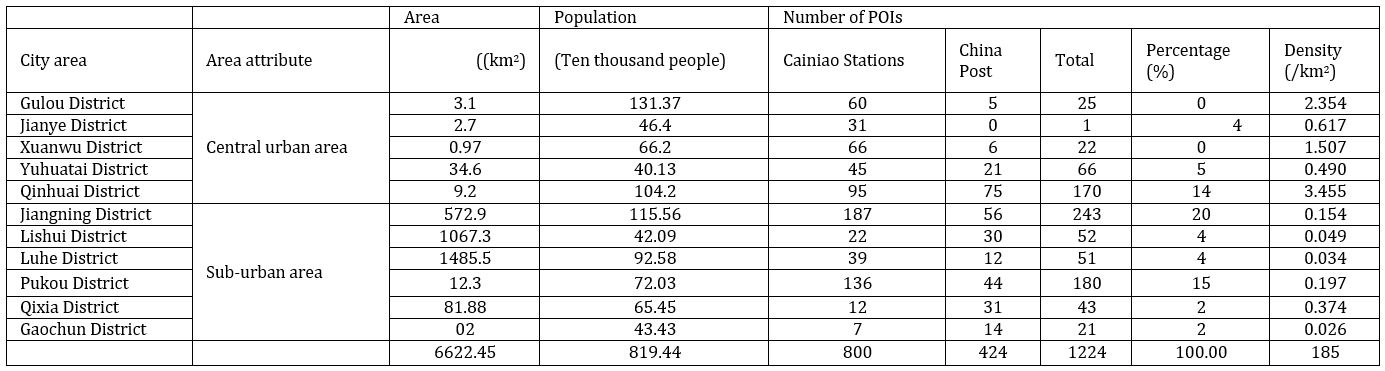
Tech (MDT)” to search for the 1224 Nanjing Express shipping points in December 2018. Among them 800 are the Cainiao stations, and 424 station of China Post (includes the China Post station and EMS), as shown in Table 1. The integrity of the information database changed into evaluated, and the addresses and coordinates had been adjusted, as necessary. This file additionally uses information on land location, population, and consistent with capita GDP within the Nanjing Statistical Yearbook for 2018 and the Land Management Plan in downtown Nanjing (2003–2020), issued by using the Nanjing Municipal Government, to observe the influencing elements of ACDPs in Nanjing. Finally, the Chinese National Geographic Information Center 1: 100,000 vector data are used as an auxiliary records source.
Table 1. Percentage distribution of ACDPs in Nanjing
2.3 Research Methods
2.3.1 Text Analysis
Because the POI data includes facility names, spatial coordinates, and specific addresses, a text analysis was first performed. Baidu Map was used to align the coordinates of the ACDPs and to cross verify the location information. Moreover, the types of support and service objects were aligned with the names and locations, which allowed us to create a comprehensive set of text data for spatial analysis.
2.3.2 Standard Deviational Ellipse
The standard ellipse is a classic spatial distribution analysis algorithm to examine the characteristics of a point dataset. The algorithm is used to measure direction and distribution characteristics of a dataset; ellipse as output [29]. The long axis of the ellipse represents the maximum diffusion direction of the test data, the short axis of the ellipse is the minimum diffusion direction of study data [30]. In this article, an ellipse with a standard deviation of the second order with points of collection and delivery of duties of 95% is selected as the output ellipse for the effective study of the distribution characteristics of collection points in Nanjing.
2.3.3 Kernel Density Estimation Method
As a nonparametric estimation method, kernel density analysis is mainly used for calculations the density of ACDPs in the surrounding community. This method sets up a specific position of the feature points and assign the attribute value of the centre point in the specified threshold range of values. The range is usually a circle of radius, when the points are grouped in the centre with the highest density. Density gradually decreases as the distance decreases; it decreases until the density at a distance becomes 0 [31].
The function is shown in Equation (1):

Where (xi, yi), (xn, yn) are sample points of the two variables (x, y). The correlation coefficients are less than or equal to 1, where 1 is total positive linear correlation, 0 indicates no linear correlation, and -1 is total negative linear correlation. In this paper, Pearson correlation equals to 1 is used to determine the influencing factors of ACDPs in Nanjing.
3. Results
3.1. The basic characteristics of ACDPs in Nanjing
3.1.1. Support type
At the beginning of the logistics industry development, ‘last mile logistics’ ACDPs were working as individual franchises at specific place. The e-commerce industry has been growing, however, with the passage of time. This raises new challenges (high cost, high competition, unstable cargo flow, failed delivery issues) for logistic express delivery. Therefore, to overcome these challenges, delivery companies made new partners as joint ventures. Table 2 shows the ACDPs analysis of the Nanjing Cainiao and China Post stations, showing that the general support types at Cainiao stations are independent (59.25%), where the ACDPs are not relying on any type of support. Most of the remaining ACDPs locations are supermarket-related, representing 11.50%, followed by department stores (4.00%) and cigarette and liquor stores (3.88%) serving business centres. Cainiao Station collaborates with residential companies (2.25%) to show the diversity of utilities in some residential areas. Cainiao Station also has separate stores, such as coffee shops (0.25%), printing shops (0.13%) and photo studios (0.38%). Most photo studios are in schools and universities. Other types of individual stores also work with Cainiao Station (5.88%), but in some cases operate as separate stores.
Table 2. Support types frequency distribution of ACDPs in Nanjing.
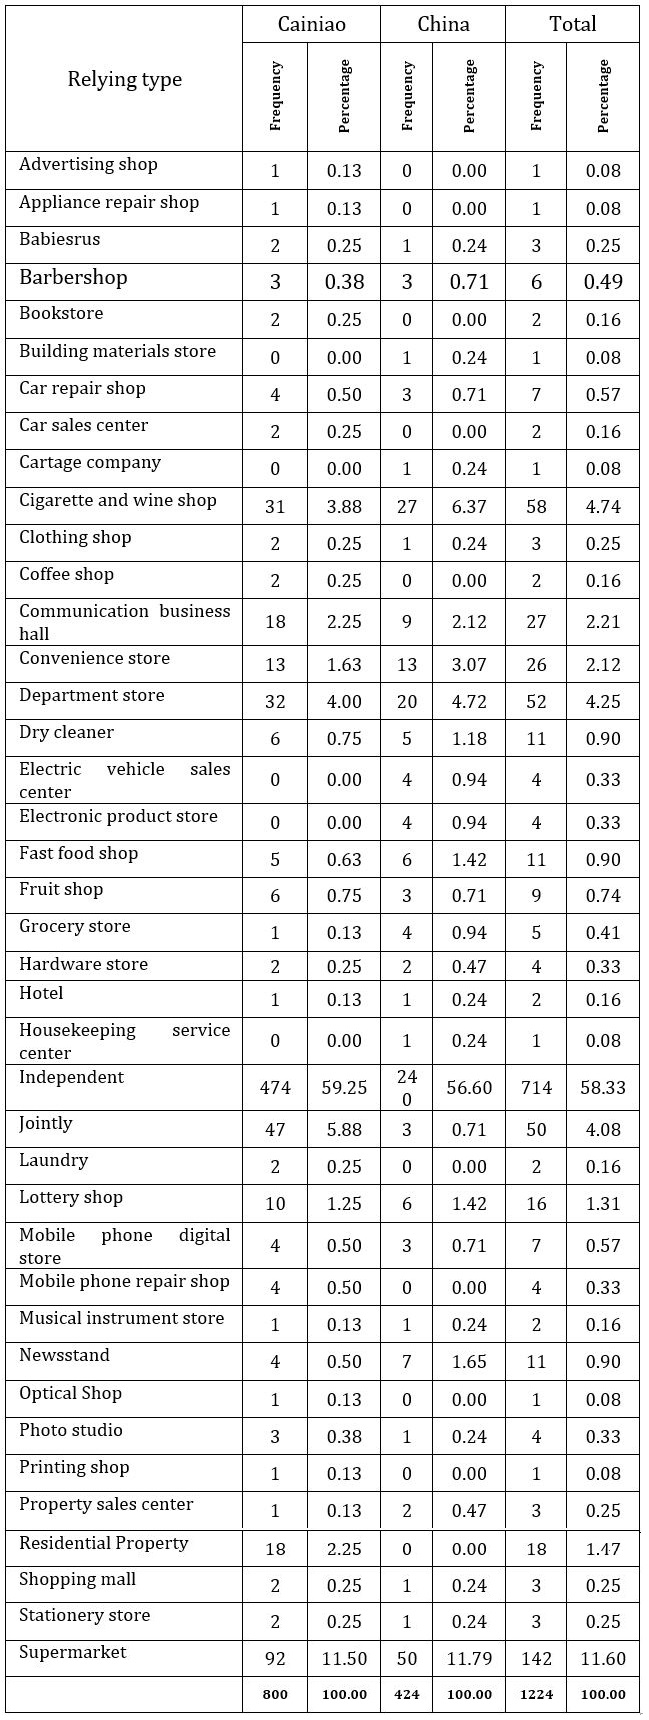
China Post operates independently throughout the city (56.60%). China Post itself has many franchises, supported by supermarkets (11.79%), cigarette and wine stores (6.37%) and department stores (4.72%). In general, franchising is the main mode of operation of the ACDPs in Nanjing, followed by supermarkets, convenience stores, fast food restaurants, electronics stores, shopping centres and other personal stores.
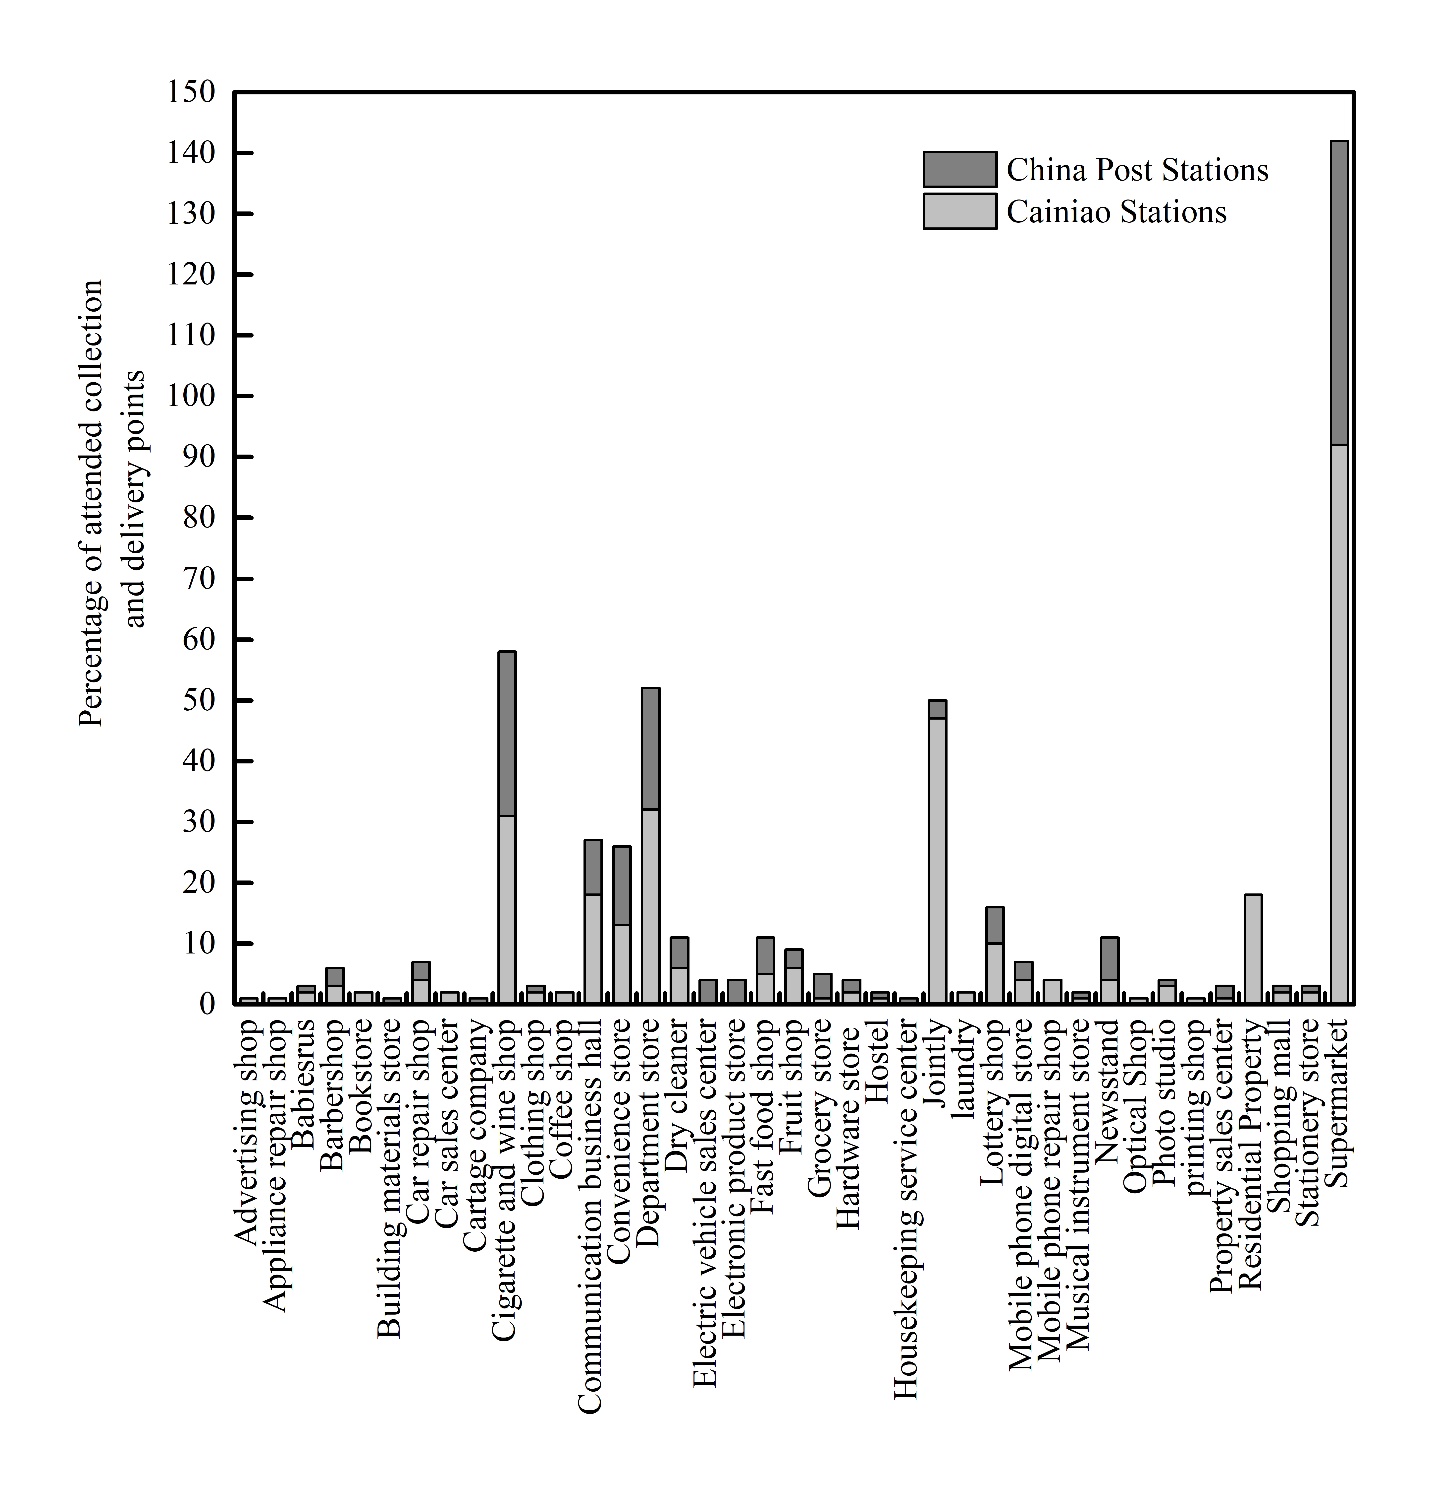
Figure 3 also represents the support type of ACDPs, showing that the main support type for Cainiao stations are supermarkets followed by department stores and cigarette and wine shops, while China post stations are working with the main support types of supermarket, cigarette and wine shops and department stores, respectively.
3.1.2. Service objects
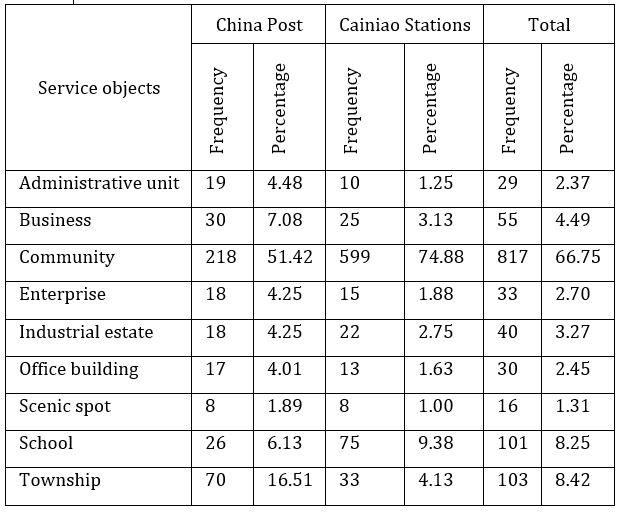
ACDPs are often used to conduct deliveries and transfer ordered goods to shoppers. However, these ACDPs are commonly located at different places such as schools, community, individual stores, etc. as the object distribution location. Where the site is in a community setting, then the client is identified as a community. Similarly, if the site is in a school setting, the client is identified as a school. Table 3 indicates that the major goal of servicing Cainiao Station is a society, which accounts for 77.88% of the total community, followed by schools (9.38%), urban areas (4.13%), and business (3.13%) and industrial areas (2.75%). There are also several office buildings (1.63%), administrative units (1.25%) and scenic spots (1%). The reason for the proliferation of service facilities is that Cainiao Station is a privately held company that primarily works with partners in the e-commerce platform. Therefore, the online-buying mode demonstrates the allocation of Cainiao stations, which depends on the size of the city.
The main facilities for servicing the China Post Station are settlements (51.42%), followed by towns (16.51%), business (7.08%), as well as enterprises and industrial parks, which account for 4.25% of the total. There are several postal stations serving scenic spot (1.89%). Compared to Cainiao Station, China Post's township services are relatively extensive. This facility occurs because China Post is a country-owned company influenced by political aspects. China Post is also located in remote regions. In general, online shopping is dependent on population density and commercial activity, due to which communities, educational institutions and businesses are used as primary sites for ACDPs.
Table 3. ACDP’s Service objects in Nanjing.
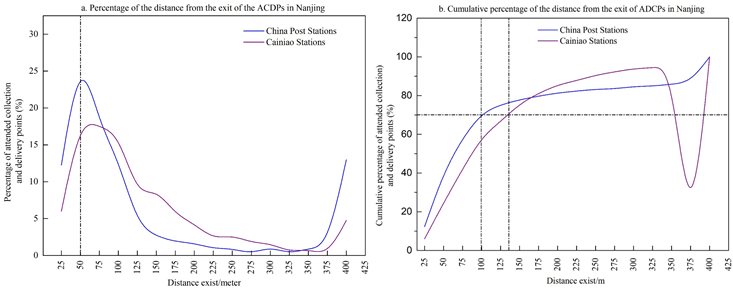
Locations and their distances are the main characteristics of geographical phenomenon. The proper location and distance of ACDPs from the shoppers’ place is cost effective and promotes the sustainable development of ACDPs. Figure 3 shows the distance (in meters) from Cainiao Station and China Post Station to exit the service area. 6% of Cainiao station is 25 meters from the go out, this number rises with distance, reaches a maximum of 70 meters from the exit, then falls and again increases slightly by 375 meters. China Post Station, located 25 meters from the exit, is under 15%, but this percentage increases with distance, till it reaches the highest value 50 meters from the go out, after which indicates a downward trend.
In general, the exit distance from Cainiao Station to China Post Station is 175 meters, which is 80%, which indicates that the distribution between Cainiao Station and China Post Station is mainly 175 meters. 70% of Cainiao Station is within 100 meters, and China Post Station is 70% within 137 meters. In other words, for Cainiao and China Post stations, the proportion of stations within 100 meters of them is the largest, and the number of stations also increases with distance. They are mainly located at 150 to 325 meters from the exit (Figure 4B). If the ACDP in the self-sufficiency institution is far from the place of residence of people, they are all 375 meters from the exit. This is because the service area is relatively far from the site, so the site is far from the exit.
3.2. Spatial Pattern of ACDPs in Nanjing
3.2.1. Overall Pattern
A spatial pattern is a geographical representation in which the location of space and distance is expressed to analyse the direction and manner of positioning of objects. The overall spatial distribution of the ACDPs in Nanjing are following:
The dimensional allocation is asymmetric, because they are mostly concentrated in the central part of the city and less scattered in other areas of the city. Figure 4A shows that Nanjing Cainiao Stations are mainly distributed in four districts: Jiangning District, Qixia District, Pukou District and Qinhuai District. These are the Gulou and Xuanwu areas, in turn. The smallest novice stations in Lishui, Gaochun and Lihue are irregular and uneven. China Post is mainly located in the Gulou area, followed by the Qinhuai, Xuanwu and Jiangning districts. As shown in Figure 4B, the smallest number of China postal stations are in the Luhe District, the Gaochun District, and the Yuhuatai District. The presence and distribution points in Nanjing are primarily allocated in the center of Nanjing, while in the adjacent areas of Nanjing, they are rarely distributed.
smallest number of China postal stations are in the Luhe District, the Gaochun District, and the Yuhuatai District. The presence and distribution points in Nanjing are primarily allocated in the center of Nanjing, while in the adjacent areas of Nanjing, they are rarely distributed.
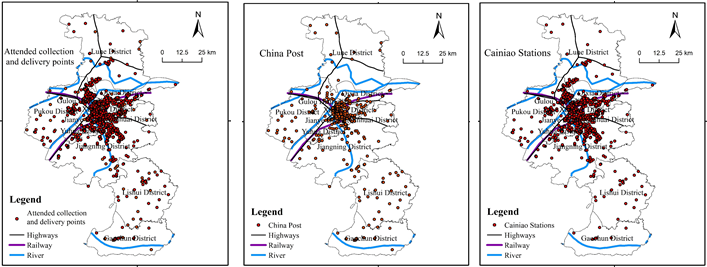
The districts of Jiangning, Pukou, Qinhuai, Gulou and Jiangning have the largest number of reception points. Jiangning District, Pukou District and Qinhuai District have a large population with many residential areas and commercial centers. Visits to ACDPs are common as a result of more frequent economic activities.
Lihue and Gaochun have the smallest number of ACDPs. Although these areas occupy a large area, their economic development is relatively weak, and they are far from city regions. Thus, the markets for Cainiao Station and China Post Station are extraordinarily small in these areas.
The overall patterns indicate dense clusters in the center and light clusters at the edges, as exhibited in Figure 4C. The spatial pattern features of ACDPs in Nanjing is more prominent. In general, the center of the distribution is a condensed zone of express delivery in Xuanwu District, Qinhuai District and Qinhuai District that extends to the edges to make discrete distributions in the surrounding areas because of terrain, the population and economic improvement. The overall spatial pattern for China Post and Cainiao stations and are highly dense inside metropolis center and isolated at the edges of Nanjing city.
3.2.2. Spatial Allocation Directional Features
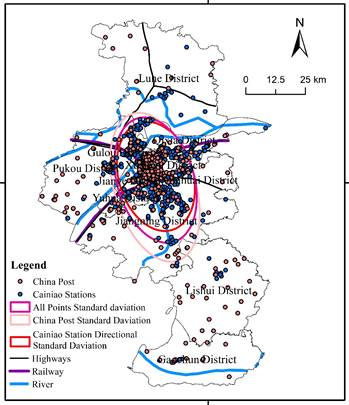
The standard deviation ellipse is a spatial analysis tool that examines the pattern of discrete location points. The standard deviation ellipse can be efficiently applied to analyse the distribution characteristics of the ACDPs in Nanjing. In this article, the secondary standard deviation ellipse containing 95% of positions with an arbitrary configuration is used as the size of the output ellipse. The following results are obtained:
Overall, there is a tendency from southwest to northwest. Figure 5 indicates that there is a large distinction among the vertical and horizontal axes of the Nanjing Cainiao station’s ellipse, which reveals that the direction of Cainiao stations is more obvious. The distribution of post offices is more discrete, the vertical axis is longer than the horizontal. Therefore, China Post Stations is more prominent than Cainiao Stations.
3.2.3. Density Distribution Features
In this study the Cainiao station and China Post station, as well as the nuclear density map of the ACDPs are used as the object of study. In general, ACDP’s distribution in Nanjing have clear agglomeration trends and clear hot spots. The following features can be found in combination with the distribution maps of Nanjing.
1. Overall, there are common asymmetric clusters. Fig. 6A demonstrates Cainiao stations have mainly four hubs. The first important district is inside the north of Qinhuai, which is the most densely populated and agglomeration extensive location. The second key region is the northwest of the Pukou district. As railways and roads cross the western part of the area, this area is the main area. Convenient transportation and densely populated residential areas. The online shopping of citizens’ conduct is frequently. The third key region is the Fenghuang Street in southwest of the Gulou district. This area is the location of community neighbourhood residents’ committees which are merged, adjusted, and interconnected with each other. This is a fully residential area with many online purchases that facilitate the use of express delivery. The fourth core is the Maiqiaoqiao Street in the southwest of Qixia district, bordering with Xuanwu District from west and Gulou District from north. It is the subcenter of Nanjing city and a hub of economics, external windows, and the culture of Qixia district. It is adjacent to Nanjing railway stations and connected with the Nanjing Yangtze River Bridge and Xinshengyu Foreign Trade Port in the north; it is also connected to the Shanghai-Nanjing Expressway, Nanjing Airport Expressway, 312 National Highway, Nanjing Ring Road and other expressways as an important hub of the traffic network; the main roads of the domestic cities meet in a vertical and horizontal direction. Due to the traffic network, there is convenient traffic and transportation; there is online shopping and express delivery, though too less than other areas.
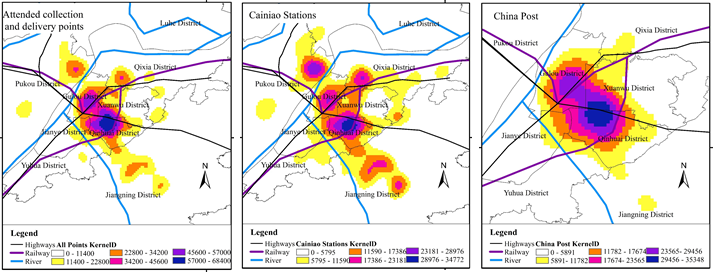
2. While Figure 6B shows that China post stations have only one essential core region, which is the northwest part of Qinhuai district and the west part of the Xuanwu district. Shuang tang Street is the core area of the northwest part of the Qinhuai district; it is bordered by Zhonghu Road in the east, Fengtai Road in the west, Qinhuai River in the south, and Shengzhou Road in the north. The traffic in this area is convenient and prosperous and it has a full range of public welfare facilities. There are high end residential quarters that are beneficial to the movement of products in this area. Suojin village street is in the west part of Xuanwu district, consisting of seven community residents' committees, research institutes, universities and other large units, beautiful scenery, rich culture, and convenient transportation. The location advantage is obvious. the development layout of “one park, four poles” and “four verticals and four horizontals” are based on Xuanwu (innovation) Avenue and Xinzhuang (innovation) Plaza alongside Jiangsu Grand Theatre and City Central Park (CCP) to create a new economic development pattern. Due to these factors (i.e., development, location near institutes, etc.), the movement of people is high, and the population is dense. Therefore, the online shopping pattern in this region is frequent and China post stations are convenient as an emerging logistic delivery express system.
3. The law of distance (the law of the inverse square) seems to work along the edges of asymmetric clustering. Figure 6 clearly confirms that the four major areas of Cainiao Station are crowdedly occupied pickup points. Though, as the results of the kernel density estimation method show, with increasing distance from the main region, the Cainiao station’s quantity declines. The China post stations are distributed with one core area as the most densely populated pickup points area. Nanjing's ACDPs are inversely proportional to the distance from the central region, which is constant with the inverse square law.
3.3. An analysis of influencing factors of ACDPs in Nanjing
ACDPs are important points in the ‘last mile’ delivery express and people’s lives through improvement of the efficiency of ‘last mile’ delivery. These elements want to be taken into consideration when setting up an ACDP network. Generally, ACDPs relay on people for express delivery. Therefore, economic development is the main factor affecting the ACDPs. Online shopping is dependent upon the population where shoppers and buyers are present. So, the population is another important affecting factor of the ACDP distribution. Moreover, traffic is the main component of ‘last mile’ express delivery, which is connected to the road network, indicating that the road is also an influencing factor. ACDPs can also indicate where people are and in what places they are living; the land use type is also an important influencing factor. Of course, there are other factors influencing the ACDPs, such as parking availability at ACDPs, safe and secure place, hours of operations of ACDPs, e-commerce development, policies, online shopping behaviour. However, it is difficult to obtain data for these characteristics. Therefore, this paper analyses the population density, GDP, traffic accessibility and land use type as influencing factors on the distribution of ACDPs in Nanjing.
3.3.1. Regional economic level
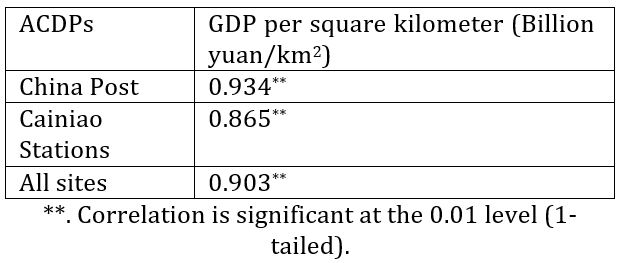
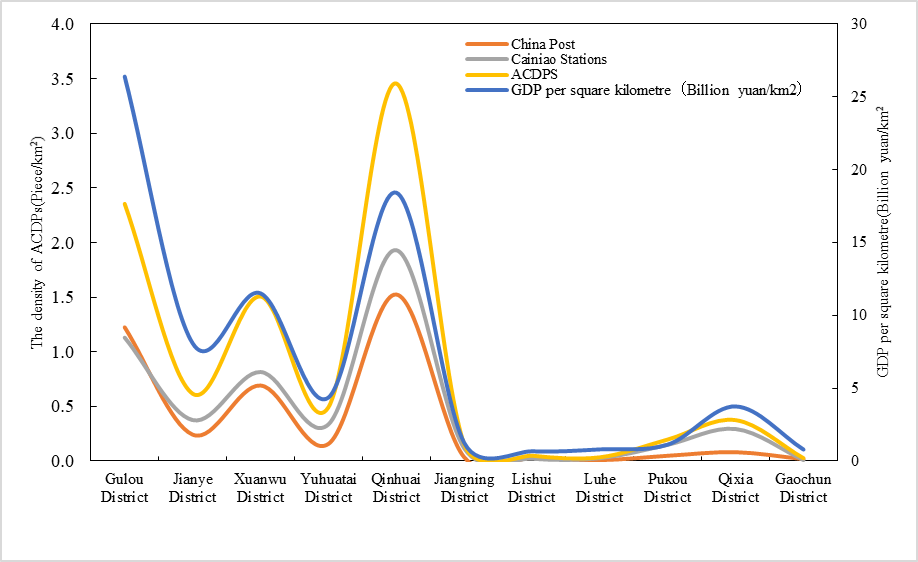
Pearson's correlation analysis was conducted between 10,000 yuan per square kilometer GDP and ACDPs. Table 4 suggests that the correlation among GDP per square kilometer and the Cainiao Station’s density is 0.865, while the correlation with the density of China Post Station is 0.934. The correlation of all ACDPs is 0.903, which is significant at a confidence level of 99%, which indicates that Nanjing’s regional economic level is closely related to the density of ACDPs. Figure 7 shows that the density of logistic and information flows per capita in the Gulou, Jiangning and Qinhuai districts is very high, due to the increase in GDP per square kilometer due to densely populated areas. As a result, both Cainiao Station and China Post have created many ACDPs in these areas. Yuhuatai and Lishui districts have low total GDP, large area, low population density, and relatively low regional economic development, which is why the number of ACDPs in this region is small.
4. Correlation between ACDPs and GDP in Nanjing.
Table 4. Correlation between ACDPs and GDP in Nanjing.
3.3.2. Population Distribution Factor
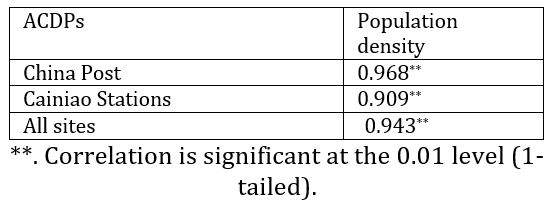
Population is one of the key driving factors of ACDP’s location in an area. ACDP and population density data was utilized for carrying out correlation analysis. The location of ACDP is highly dependent on the population. We used population density data and ACDP data for each area in Nanjing for correlation tests. Table 5 shows that the association between China Post and population density is 0.968, and the relationship between the population and Cainiao Station is 0.909. The correlation between population density and all ACDPs is 0.943. The correlation between Cainiao Station and the population, all points and the population reached 99%, which indicates that ACDPs, China Post Stations and Cainiao Stations are closely related to population density. All ACDPs are very relevant for the population.
Table 5. Correlation between ACDPs and the population in Nanjing.
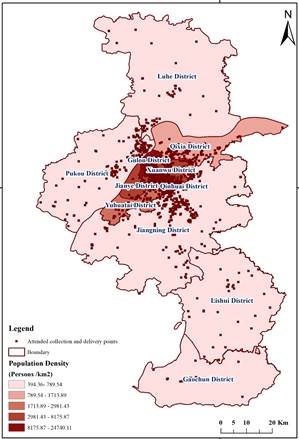
This article also includes the population densities of various streets of Nanjing city, which is superimposed with the China post stations and Cainiao stations, obtaining the association between ACDPs and the population distribution of Nanjing. Figure 8 shows that the distribution of ACDPs in Nanjing demonstrate a strong consistency with population distribution of each city district. The areas of Gulou, Jiangning and Qinhuai districts are the areas with the highest population distribution and the areas with the highest density of express delivery points. These are mostly distributed in the city center because this region is densely populated while population in the remote area is scattered and the appearance of pickup points is low, leading to the sparse distribution of ACDPs. Overall, all sites are consistent with population density.
3.3.3. The Convenience of Traffic
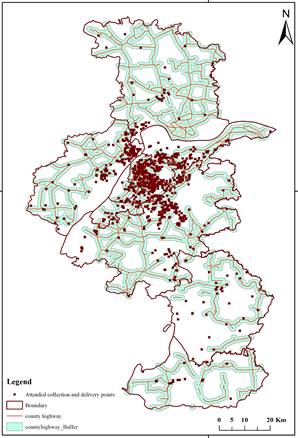
Roads are the main component of the “last mile” logistic distribution, they allow consumers to pick up packages during daily trips. However, If the ACDPs are placed along with roads at walking distance or biking distance then they can become even more convenient to the consumer. Therefore, ArcGIS was used to perform 1 km buffer analysis; the one-kilometer range was used to find the intersection of ACDPs with main traffic lines (county highways) of Nanjing city (Figure 9).
The results show that the distribution of pickup points from various districts is mainly along the main roads of urban areas while central city areas have a dense traffic road network where pickup points are also concentrated. The road network density is low at the edges of city where the traffic accessibility is relatively weak. Thus, fewer pickup points appeared. The distribution of courier sites varies depending on the convenience of moving. Overall, all sites were convenient to road networks.
3.3.4.Types of Land Use
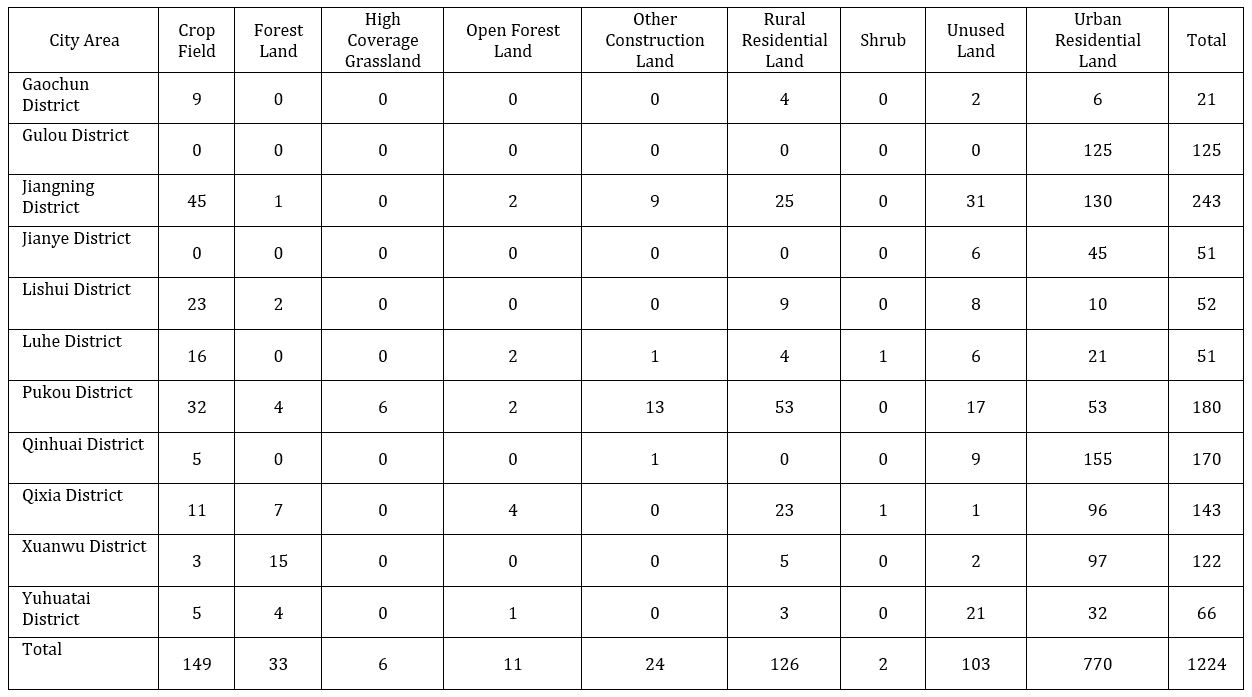
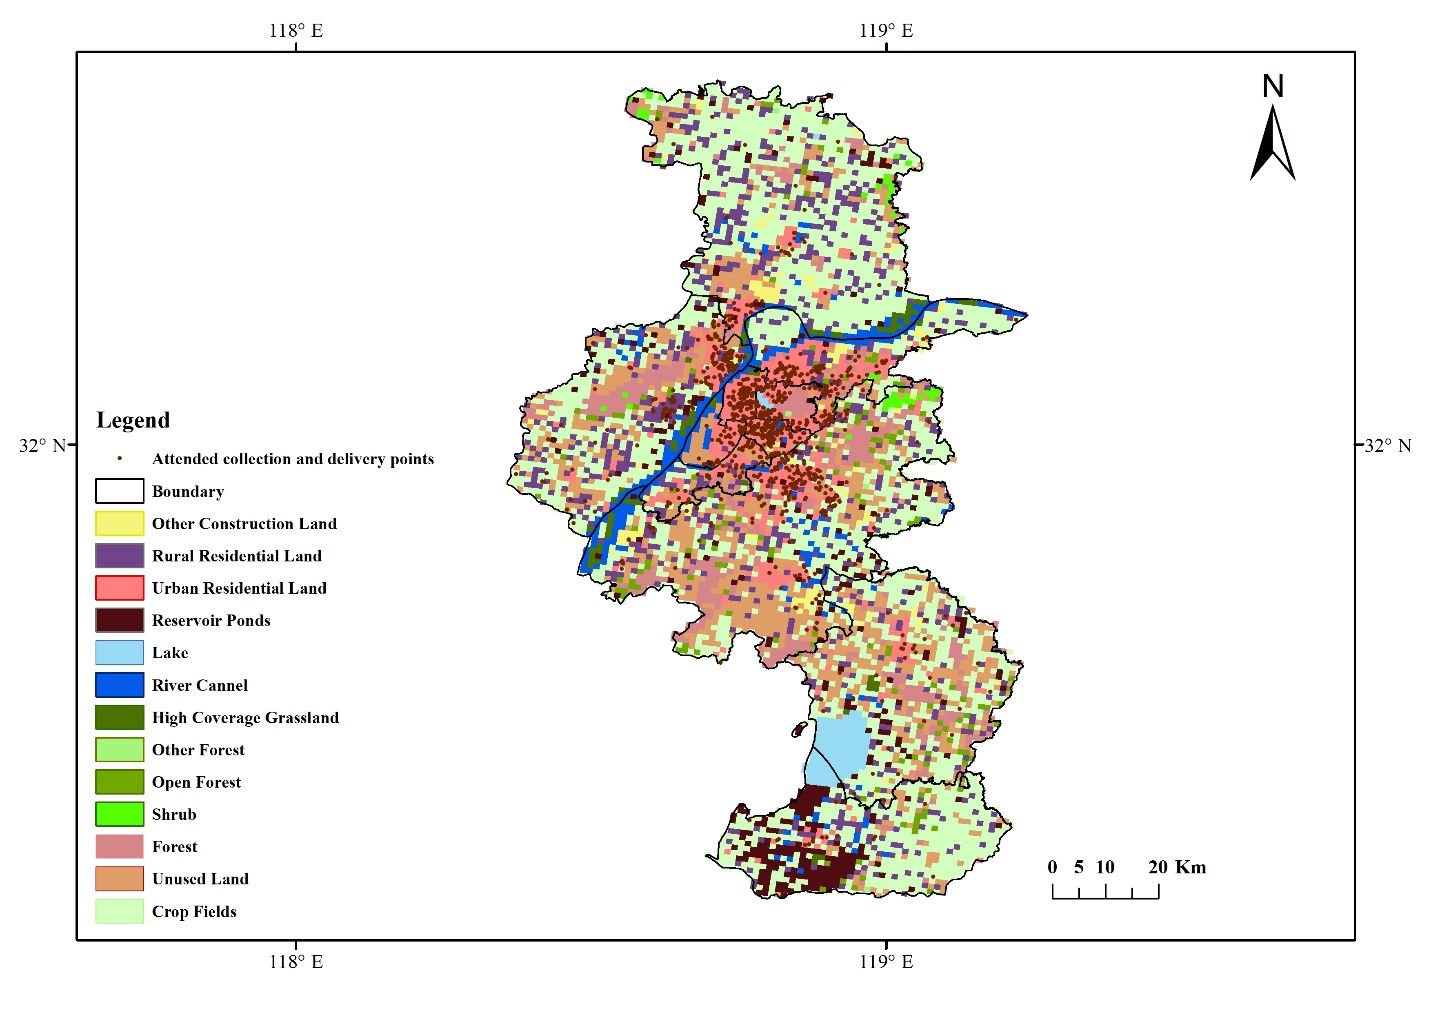
It was found that the ACDP’s quantity distributed in urban residential areas was the largest. Population density in urban residential areas is excessive, and generally the trend of online shopping in residential areas is way higher than the rest of the land types. Second, the impact of crop fields sites on the ACDPs is mainly reflected in the distribution of crop lands compared with human activities. Farmers are the main force behind the online shopping consumption. The number of rural residents reflects the number of online purchases in the region and the extent of population migration, which to some extent contributed to the improvement of the shipping enterprise in the vicinity. However, the express delivery stations located in crop fields land type are comparatively less than urban areas, as the consumers rarely go for online shopping options. Other land kinds consisting of forest land, high coverage grassland, open forest land and shrub are occupied with fewer sites. As a result, they are less relevant to the spatial distribution of ACDPs. (See table 6) Nanjing City Center land use plan (2003-2020) can be combined with ACDPs (Figure 10) to visually show that the quantity distribution of ACDPs is consistent with land use types. Consequently, the ACDP’s count in any area highly depends on the land type of that region.
Table 6. Quantity of ACDPs in various land use types in Nanjing.
4. Discussion
The study of the spatial structure of ACDPs in Nanjing and its influencing factors has certain theoretical significance for site selection. This article analyses and discusses the spatial structure of ACDPs in Nanjing in accordance with the characteristics of express delivery sites, their spatial distribution and the factors that influence them. ACDPs can be in residential areas, shopping centers, shops, commercial centers, or public places where many customers can access them over short distances. ACDPs is a delivery option that helps increase customer satisfaction and optimize last mile delivery. Due to the infrastructure of road facilities, as well as the entrances and exits where customers are located, ACDPs is usually located where non-motorized (i.e. bicycle and pedestrian) transportation is possible. This reduces the impact of home delivery and helps urban mobility.
ACDPs are important research objects in the logistic geography. However, previous studies on the logistic geography have not yet formed a complete theoretical framework and independent system to study ACDPs in-depth. Due to the nature of POI data and its lack of time series evolution, the temporal aspects must be further explored in future studies. As there is shopping behaviour present where these ACDPs occurred which prior studies have not considered,, in the future, an in-depth analysis of these aspects is needed that will be helpful in application of geospatial aspects; such study could enhance the development of logistic geography in the new era.
ACDPs are present where shopper’s lifestyle patterns are made. In the future, POI data related to shopper’s lives combined with night-time lighting data can be used to explore the population and urbanization and city growth pattern. Also, POI data can be used with multi source data like socioeconomic data, demographic data, and remote sensing imagery. to analyse the urban structure and urban growth boundary evolution.
5. Conclusions and Policy Implications
Based on the research objectives, analyses of elementary attributes, spatial patterns and influencing factors of the ACDPs in Nanjing city, the following conclusions are presented.
The basic characteristics of ACDPs in Nanjing appear in their density distribution, the distribution of support types, the characteristics of service targets and location choice. The ACDPs are operating mainly as two type of supports: franchises and as independent. Schools, Communities, and enterprises are the primary services that customers utilize as their personal express delivery points, supported by administrative units, towns, firms, and attractions. Most ACDPs are situated near facility region exits.
The spatial structure of ACDP in Nanjing is especially exhibited inside the overall characteristics, directional distribution, and density distribution features. The spatial pattern is asymmetrical, presenting the characteristics of ‘denser clustered in the center of city and fewer are spreading at the edges of city’. The overall pattern of distribution is highly dense in the center of the city and isolated at the edges of city. The general tendency is northwest and southwest beside the vertical axis and showing the trinuclear clustering.
ACDP’s quantity has been mainly influenced by the economic level of the region, and the delivery points have a positive relationship with the economic growth of that area. The ACDPs are strongly dependent on population. All ACDPs are strongly significant with the population distribution density. The other most important factor is the convenience of transportation which affects the number and distribution of ACDPs. With the ease of transportation, such as the availability of road, the number of sites varies. The ACDPs had strong relationship with land use types. Most ACDPs are distributed on urban residential land and rural residential land.
This study has important implications for decision makers and planners in logistics companies. After examining the spatial variability and influencing factors of ACDP in Nanjing, we found that the city center provided the appropriate ACDP cluster, and that ACDP was located mainly next to the main road connecting buyers' homes. This phenomenon is common throughout the city. Based on the results of this study, policies need to be developed to optimize road network design and improve demand management for ACSPs. To create a viable ACDP environment for residents, more urban reconstruction strategies related to ACDP are needed in urban areas.
For urban science planning, the spatial characteristics of ACDP, such as location, density, and direction, are important. For example, both types of ACDP have different location settings. Beginner stations are very consistent with population distribution, and the distribution of rookie stations in urban areas is rare. In addition, as a result of land-use analysis, most ACDPs are well planned in residential areas.
Consequently, ACDP planners must emphasize the spatial equality of ACDP in order to improve the distribution of new regions based on land use and population density. Geospatial analysis helps ACDP’s planners determine where ACDP supply and demand do not match.
Acknowledgements
This study was supported by grants from Tang Scholar Program of Northwest University (No.2016). The first author would like to thank his parents who support him in this work.
References
[1] J. Visser, T. Nemoto, and M. Browne, ‘Home delivery and the impacts on urban freight transport: A review’, Procedia-social and behavioral sciences, vol. 125, pp. 15–27, 2014.
[2] ‘UK Retail and Ecommerce: Economic, Sales and Buyer Trends for 2016–2021 - eMarketer’. https://www.emarketer.com/Report/UK-Retail-Ecommerce-Economic-Sales-Buyer-Trends-20162021/2002112 (accessed Dec. 26, 2019).
[3] P. O’Sullivan, ‘Online Shopping: Pearls and Pitfalls for New Zealand Consumers–How to Increase Consumer Protection and Build Consumer Confidence’, PhD Thesis, ResearchSpace@ Auckland, 2017.
[4] J. Beckers, I. Cárdenas, and A. Verhetsel, ‘Identifying the geography of online shopping adoption in Belgium’, Journal of Retailing and Consumer Services, vol. 45, pp. 33–41, 2018.
[5] ‘E-Commerce and a New Demand Model for Logistics Real Estate’, Prologis, Feb. 22, 2017. https://www.prologis.com/logistics-industry-research/e-commerce-and-new-demand-model-logistics-real-estate (accessed Dec. 26, 2019).
[6] Prologis, ‘E-Commerce and a New Demand Model for Logistics Real Estate | Prologis’, 2014. https://www.prologis.com/logistics-industry-research/e-commerce-and-new-demand-model-logistics-real-estate (accessed Dec. 17, 2019).
[7] J. Fernie, L. Sparks, and A. C. McKinnon, ‘Retail logistics in the UK: past, present and future’, International Journal of Retail & Distribution Management, vol. 38, no. 11/12, pp. 894–914, 2010.
[8] R. Gevaers, E. Van de Voorde, and T. Vanelslander, ‘Characteristics and typology of last-mile logistics from an innovation perspective in an urban context’, City Distribution and Urban Freight Transport: Multiple Perspectives, Edward Elgar Publishing, pp. 56–71, 2011.
[9] X. Wang, L. Zhan, J. Ruan, and J. Zhang, ‘How to choose “last mile” delivery modes for e-fulfillment’, Mathematical Problems in Engineering, vol. 2014, 2014.
[10] P. L. Mokhtarian, ‘A conceptual analysis of the transportation impacts of B2C e-commerce’, Transportation, vol. 31, no. 3, pp. 257–284, 2004.
[11] V. Kämäräinen, J. Saranen, and J. Holmström, ‘The reception box impact on home delivery efficiency in the e-grocery business’, International Journal of Physical Distribution & Logistics Management, vol. 31, no. 6, pp. 414–426, 2001.
[12] M. Punakivi and J. Saranen, ‘Identifying the success factors in e-grocery home delivery’, International Journal of Retail & Distribution Management, vol. 29, no. 4, pp. 156–163, 2001.
[13] A. Punel and A. Stathopoulos, ‘Exploratory analysis of crowdsourced delivery service through a stated preference experiment’, 2017.
[14] L. Song, T. Cherrett, F. McLeod, and W. Guan, ‘Addressing the last mile problem: transport impacts of collection and delivery points’, Transportation Research Record, vol. 2097, no. 1, pp. 9–18, 2009.
[15] J. W. J. Weltevreden, ‘B2c e-commerce logistics: The rise of collection-and-delivery points in the Netherlands’, International Journal of Retail and Distribution Management, vol. 36, no. 8, pp. 638–660, 2008. View Article
[16] E. Morganti, S. Seidel, C. Blanquart, L. Dablanc, and B. Lenz, ‘The Impact of E-commerce on Final Deliveries: Alternative Parcel Delivery Services in France and Germany’, in Transportation Research Procedia, 2014, vol. 4, pp. 178–190. View Article
[17] R. Gevaers, E. Van De Voorde, and T. Vanelslander, ‘Characteristics and typology of lastmile logistics from an innovation perspective in an Urban context’, City Distribution and Urban Freight Transport: Multiple Perspectives, pp. 56–71, 2011. View Article
[18] H. J. Brummelman, B. Kuipers, and N. Vale, ‘Effecten van Packstations op Verkeersbewegingen (Impacts of Locker Points on Mobility)’, TNO Inro, Delft, Netherlands, 2003.
[19] F. McLeod, T. Cherrett, and L. Song, ‘Transport impacts of local collection/delivery points’, International Journal of Logistics Research and Applications, vol. 9, no. 3, pp. 307–317, Sep. 2006. View Article
[20] S. Forkert and C. Eichhorn, ‘Innovative Approaches in City Logistics. Alternative Solutions for Home Delivery’, Policy notes. Disponível em: http://www.nichestransport.org/fileadmin/archive/Deliverables D, vol. 4, 2007.
[21] A. C. McKinnon and D. Tallam, ‘Unattended delivery to the home: an assessment of the security implications’, International Journal of Retail & Distribution Management, vol. 31, no. 1, pp. 30–41, 2003.
[22] L. W. Hiselius, L. S. Rosqvist, and E. Adell, ‘Travel behaviour of online shoppers in Sweden’, Transport and Telecommunication Journal, vol. 16, no. 1, pp. 21–30, 2015.
[23] L. W. Hiselius, L. S. Rosqvist, and E. Adell, ‘Travel behaviour of online shoppers in Sweden’, Transport and Telecommunication, vol. 16, no. 1, pp. 21–30, 2015. View Article
[24] J. B. Edwards, A. C. McKinnon, and S. L. Cullinane, ‘Comparative analysis of the carbon footprints of conventional and online retailing: A “last mile” perspective’, International Journal of Physical Distribution & Logistics Management, vol. 40, no. 1/2, pp. 103–123, 2010.
[25] J. W. J. Weltevreden and O. Rotem-Mindali, ‘Mobility effects of b2c and c2c e-commerce in the Netherlands: a quantitative assessment’, Journal of Transport Geography, vol. 17, no. 2, pp. 83–92, 2009. View Article
[26] A. Heitz and A. Beziat, ‘The parcel industry in the spatial organization of logistics activities in the Paris Region: inherited spatial patterns and innovations in urban logistics systems’, Transportation Research Procedia, vol. 12, pp. 812–824, 2016.
[27] E. Morganti, S. Seidel, C. Blanquart, L. Dablanc, and B. Lenz, ‘The impact of e-commerce on final deliveries: alternative parcel delivery services in France and Germany’, Transportation Research Procedia, vol. 4, pp. 178–190, 2014.
[28] I. Cárdenas, J. Beckers, and T. Vanelslander, ‘E-commerce last-mile in Belgium: Developing an external cost delivery index’, Research in transportation business & management, vol. 24, pp. 123–129, 2017.
[29] T. Eryando, D. Susanna, D. Pratiwi, and F. Nugraha, ‘Standard Deviational Ellipse (SDE) models for malaria surveillance, case study: Sukabumi district-Indonesia, in 2012’, Malaria Journal, vol. 11, no. 1, p. P130, 2012.
[30] R. S. Yuill, ‘The standard deviational ellipse; an updated tool for spatial description’, Geografiska Annaler: Series B, Human Geography, vol. 53, no. 1, pp. 28–39, 1971.
[31] X. J. Cai, Z. F. Wu, and J. Cheng, ‘Analysis of road network pattern and landscape fragmentation based on kernel density estimation’, Chin. J. Ecol, vol. 31, no. 1, pp. 158–164, 2012.