International Journal of Civil Infrastructure (IJCI)
ISSN: 2563-8084

Volume 3 - Year 2020- Pages 41-47
DOI: 10.11159/ijci.2020.005
Model Test and Corresponding Simulation on Compressive Characteristics of Soilbags
Tatsuya Doi1, Yoshitaka Murono1, Ho Cho2
1Railway Technical Research Institute
2-8-38 Hikari-cho, Kokubunji-shi, Tokyo, Japan
doi.tatsuya.45@rtri.or.jp; murono.yoshitaka.51@rtri.or.jp
2Nagoya Institute of Technology
Gokiso-cho, Showa-ku, Nagoya, Aichi, Japan
cho.ho@nitech.ac.jp
Abstract - It is known that response acceleration of superstructure supported by spread foundation will decrease due to the rocking of the footing when subjected to earthquake loading, which makes it possible to reduce the cross section of the pier supporting the superstructure. However, supporting ground of a spread foundation should have enough bearing capacity. Therefore, when a spread foundation is constructed on soft ground, it should be improved by replacement of gravel or ground improvement method to increase the bearing capacity. The authors have already proposed a foundation by replacing the soft ground beneath a footing with soilbags. It is well-known that soilbags will receive much larger compressive force than filled material only. Thus, it is expected that soilbags will withstand large load beneath the footing even during earthquake. In verifying the effectiveness of the proposed foundations, the compressive characteristics of soilbags is crucial. Therefore, in this study, a compression test on soilbags was conducted and the compressive characteristics of soilbags was carefully investigated. Moreover, numerical simulation of the compression test was carried out and the mechanism of compression deformation of soilbags was examined. The calculated results coincided almost exactly with the experimental results. The calculated results also showed that vertical stress was largely shared by the centre part of soilbags, where restraint effect of a bag was more prominent.
Keywords: Soilbag, compression characteristics, subloading tij model, spread foundations with soilbags.
© Copyright 2020 Authors - This is an Open Access article published under the Creative Commons Attribution License terms. Unrestricted use, distribution, and reproduction in any medium are permitted, provided the original work is properly cited.
Date Received: 2020-11-20
Date Accepted: 2020-11-24
Date Published: 2020-12-23
1. Introduction
It is known that response acceleration of superstructure supported by spread foundation will decrease due to the rocking of the footing when subjected to earthquake loading [1-3], which makes it possible to reduce the cross section of the pier supporting the superstructure. However, the supporting ground of a spread foundation should have enough bearing capacity. Therefore, when a spread foundation is constructed on soft ground, the soft ground should be improved by replacement of gravel or ground improvement method to increase the bearing capacity.
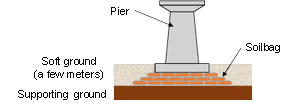
The authors have already proposed a foundation by replacing the soft ground beneath a footing with soilbags [4-5], as shown in Figure 1. It is well-known that soilbags will receive much larger compressive force than filled material only [6]. Thus, it is expected that soilbags will be utilised as the method of improving soft ground beneath the footing. It should be noted that the geotextile soilbags [7], which consist of geotextile and crushed stone, are assumed to be adopted in the proposed foundation instead of general soilbags often used in disaster recovery. That is because quite large compressive force will act beneath the footing of railway piers during an earthquake.
In verifying the effectiveness of the proposed foundations, the compressive characteristics of soilbags is crucial. Although the cyclic shear characteristics of geotextile soilbags have been clarified by the past experiments [7], the compressive characteristics of geotextile soilbags is not clarified sufficiently. Therefore, in this study, a compression test on geotextile soilbags (hereinafter simply called “soilbags”) was conducted and the compressive characteristics of soilbags was carefully investigated. Moreover, numerical simulation of the compression test was carried out and the mechanism of compression deformation of soilbags was examined.
2. Compression Test on Soilbags [5]
2. 1. Outline of Compression Test on Soilbags
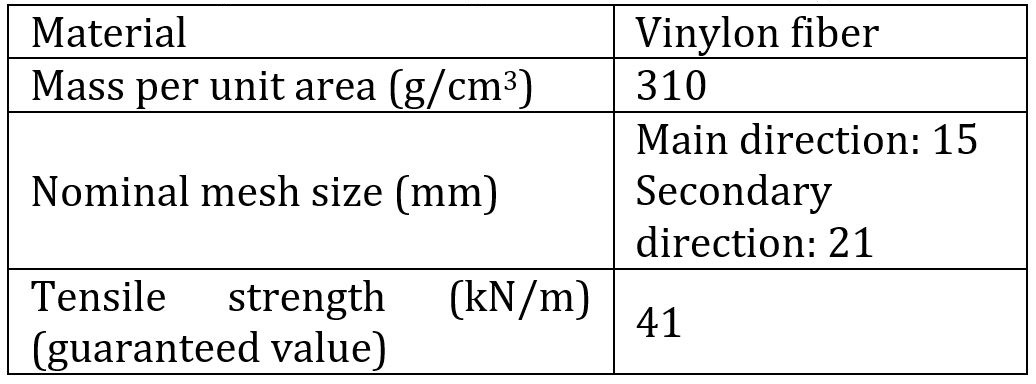
The schematic view of the model test on newly-proposed foundation is shown in Figure 2. The size of the soilbag specimen is 300 mm in width, 300 mm in depth, and 100 mm in height. Specification of geotextile used in the experiment is listed in Table 1. Mechanically stabilized crushed stone (M30) was filled into the soilbag and the specimen was compacted so that the dry density was approximately 1.8 g/cm3. The crushed stone was at air-dried state and its water content was 1.3 %. Nonwoven fabric whose tensile strength was sufficiently smaller than that of the geotextile was laid between the geotextile and the crushed stone to prevent the crushed stone from leaking out.
Arrangement of monitoring sensors is shown in Figure 3. Vertical load, vertical displacement of loading plate, horizontal deformations of the soilbag specimen were measured. Vertical load was measured by load cell installed on the loading plate, vertical displacement of the loading plate and horizontal deformation of the specimen were measured by laser displacement sensors. The laser displacement sensor for horizontal deformation can measure deformation distribution in the range of 70 mm. The compression test was conducted at loading rate of 0.5 mm/min by a loading device with a maximum loading capacity of 1,000 kN.
2. 2. Test Result
Relationship between vertical stress and vertical strain of the specimen is shown in Figure 4. Here the vertical stress in Figure 4 is defined as the value of load cell divided by the upper surface area of the test
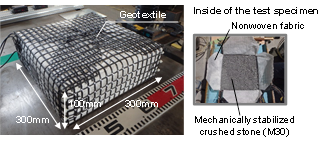
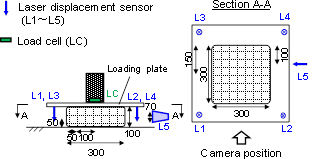
Table 1: Specification of geotextile used in experiment.
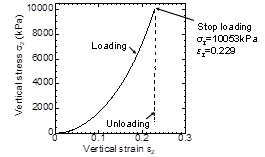
specimen (0.09 m2). The vertical strain in Figure 4 is defined as the vertical settlement, which is calculated as the average of the values of four laser displacement sensors measuring the settlement of loading plate, divided by the initial height of test specimen. The broken line shown in Figure 4 represents the unloading process. From Figure 4, it can be seen that the compression stiffness of the specimen increases with the increase of vertical strain. This can be explained as follows: (i) the circumference of the specimen becomes large as the compression increases; (ii) a tensile force generated in the geotextile; (iii) the horizontal pressure from the geotextile restrain the crushed stone, leading to an increase of the strength and the stiffness of the crushed stone [6]. Actually, as can be seen from the horizontal deformation distribution of the specimen shown in Figure 5, the side of the specimen deforms along the horizontal direction as the compression increases.
From Figure 4, it can also be seen that the compression stiffness does not decrease even after the vertical stress exceeds 10000 kPa. Moreover, as can be seen from the photos of the specimen after loading shown in Figure 6, neither collapse of the specimen nor the leaking of crushed stone was observed, although some damaged points were observed in the geotextiles. In the typical examples of railway pier listed in Japanese Design Code [8], the vertical stress under a footing of a pier is about 200 kPa for stationary load and about 2000 kPa for earthquake load. Therefore, under the conditions of the present experiments, the soilbags have enough compression strength on the condition that they are laid under railway piers. On the other hand, as can be seen from Figure 4, the smaller vertical strain, the smaller compression stiffness. Therefore, it is feasible to compact soilbags to a sufficient density.
3. Numerical Simulation of the Compression Test [9]
3. 1. Overview of Simulation of Compression Test on Soilbags
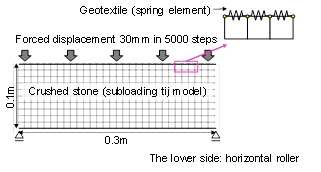
Numerical simulation of the compression test was
also conducted to clarify the mechanism of compression
deformation of the soilbags. The numerical model of the
compression test is shown in Figure 7. Numerical
simulation was conducted by 2D FEM, in which the
crushed stone was modelled as plane strain elements.
Subloading tij model [10] was adopted as the
constitution law for the crushed stone. The subloading
tij model is formulated by extending previous models
such as the Cam clay model. The subloading tij model
particularly considers some mechanical characteristics
of soils, which the Cam clay model cannot describe,
(i) Influence of intermediate principal stress on the
deformation and strength of soil
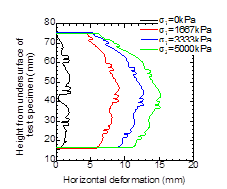
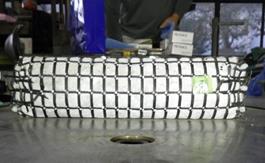
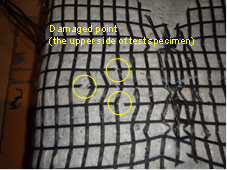
Figure 6: Outlook of soilbag specimen after loading
(ii) Stress path dependency of the direction of plastic
flow
(iii) Positive dilatancy during strain hardening
(iv) Influence of density and/or confining pressure on
the deformation and strength
Moreover, geometrical nonlinearity was also considered. Geotextile was modelled as spring element and its stiffness value was calculated as tensile elasticity of geotextile used in the experiment per unit width (950kN/m [11]) divided by length of spring element (0.01 m), namely 95000 kN/m2.
In this study, geotextile of side of test specimen was not modelled. The reason for this is explained below. In actual behavior, it is assumed that the tension of the geotextiles is continuous in the vertical and horizontal corners. However, this phenomenon cannot be reproduced because the nodes of crushed stone and that of the geotextile are in close contact including in the corners of the model. On the other hand, under conditions where the soilbag is compressed, it is assumed that the effect of restraining the crushed stone in the horizontal direction by the upper and lower geotextiles have a large influence on the entire behavior. Therefore, in this study, the upper and lower geotextiles were modelled, while the side geotextiles were not modelled.
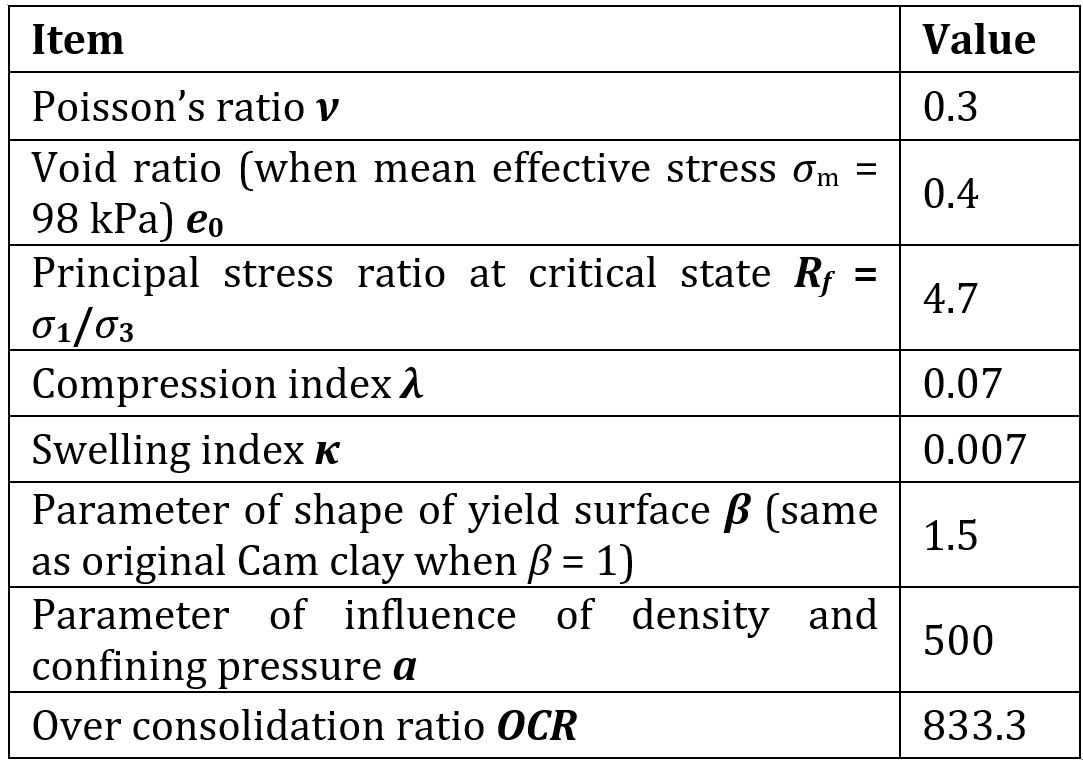
The initial stress field of the crushed stone were set to σxx=σyy=σzz=0.9 kPa, τxy=0.0 kPa, which were based on an assumption that vertical stress of crushed stone before compression distributes isotropically. Parameters of the crushed stone are shown in Table 2, were evaluated accurately by comparing the element simulation results with correspond results of a large-scale triaxial tests. This large-scale triaxial tests, whose sample size is 600 mm in height and 300 mm in diameter, were conducted separately from the present compression test. The material was the same crushed stone as those in the compression test and the dry density was 1.85 g/cm3, close to the dry density of crushed stone of the soilbag. The results of the large-scale triaxial tests and the element simulation are shown in Figure 8, by which it is clear that the numerical simulation conducted in this research is strictly based on the elementary behaviour of the geomaterial. The program of FEM used in this research is called as DBLIEVES [12].
3. 2. Results and discussion about the simulation
In simulating the vertical loading test, a prescribed vertical displacement of 30 mm, exactly the
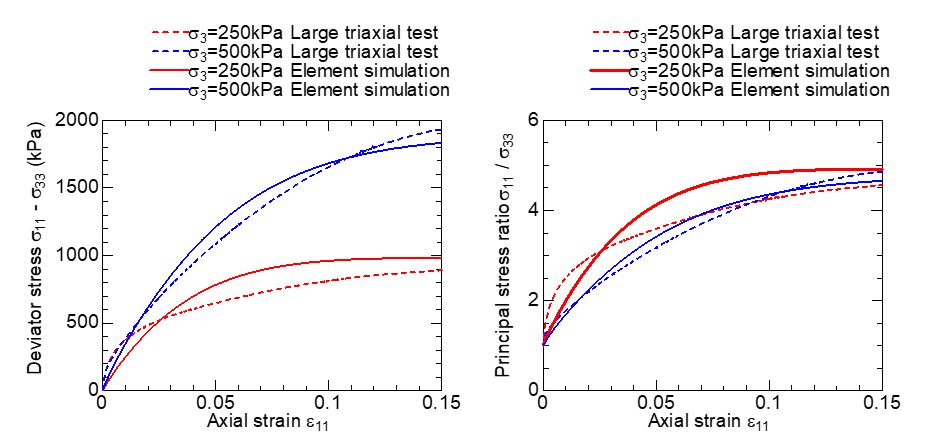
Table 2: Parameters of numerical simulation
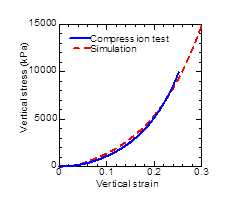
same as the test, was applied to the model in 5000 steps. Figure 9 shows the comparison between the loading test and the corresponding simulation about the vertical stress-strain relationship, from which it can be seen that the simulation coincided almost exactly with
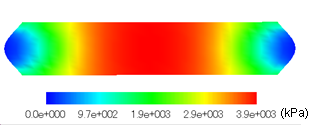
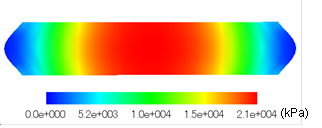
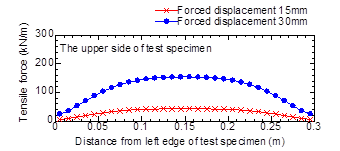
the experimental results. Figure 10 shows the contour of stress at the end of vertical loading, in which, the values of the stress and the strain are taken as positive at compression. From Figure 10 (a), it can be seen that horizontal stress is generated at the centre of the soilbags, where the restraint effect of the geotextile is more prominent. From Figure 10 (b), it can be seen that similar to the horizontal stress, the vertical stress is also largely generated at the centre of the soilbags for the same reason. Fig. 11 shows the distribution of tensile force within the geotextile at upper side. From Figure 11, it can be seen that the tensile force is large at the centre of the soilbags, which is consistent with the horizontal stress distribution shown in Figure 10 (a). The distribution of the tensile force within the geotextile at lower side is almost the same as the upper side.
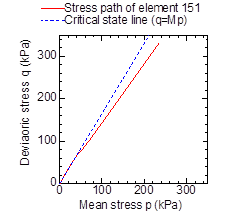
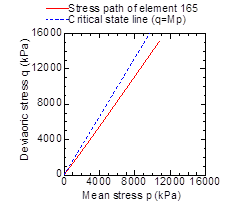
Stress paths of the crushed stone at different positions are shown in Figure 12. Here deviatoric stress q is defined by Eq. 1 as:
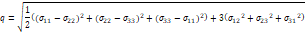
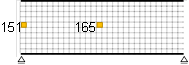
The elements in interest are element 151 and element 165, as shown in Figure 12 (a). In Figure 12 critical state line is plotted together. The gradient of critical state line M (=1.657) is calculated from the principal stress ratio at critical state Rf (=4.7). From Figure 12, it can be seen that element 165 does not reach critical state, while the element 151 does reach the critical state. This is because the restrict effect of the geotextile is small at the edge of the soilbags and the deviatoric stress becomes large.
4. The effect of strength of filling material and rigidity of geotextile on the deformation characteristics of soilbag
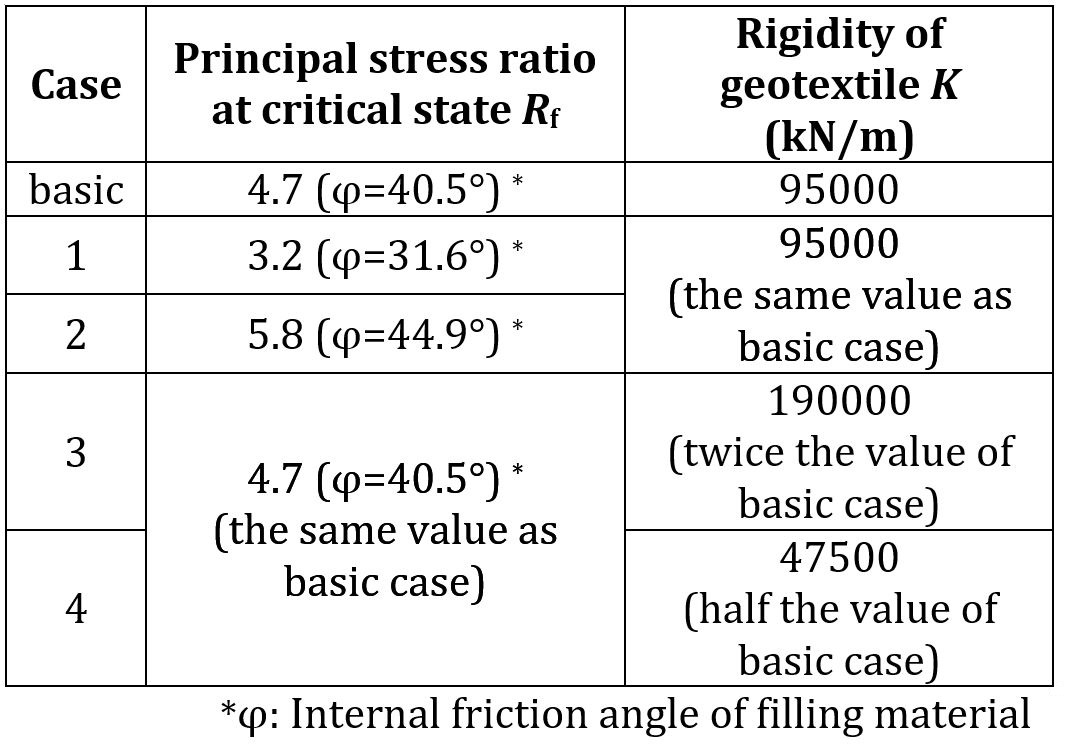
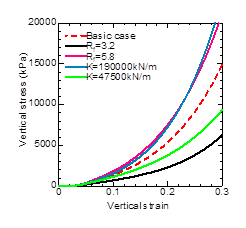
It was confirmed that the simulation coincided almost exactly with the experimental results in chapter 3. In this chapter, the effect of the internal friction angle of filling material and rigidity of geotextile on the deformation characteristics of soilbag is evaluated using the analysis model constructed in chapter 3. Hereafter, the reproduction analysis in chapter 3 is referred to be as “basic case.”
Analytical conditions are shown in Table 3. The principal stress ratio at critical state Rf was changed to 3.2 in Case 1, which corresponded to internal friction angle of 31.6°. In Case2, Rf was changed to 5.8, which corresponded to internal friction angle of 44.9°. The rigidity of geotextile in Case 3 was change to 190000 kN/m, which is twice the value of basic case. The rigidity of geotextile in Case 4 was change to 47500 kN/m, which is half the value of basic case. Both the values of rigidity of geotextile in Case 3 and Case 4 are in the expected range of value of actual geotextile.
Figure 13 shows the comparison of vertical stress – vertical strain relationships. From Figure 13, it is confirmed that both principal stress ratio at critical state Rf and the rigidity of geotextile have great effect on the deformation characteristics of soilbags. In actual design, therefore, it is important to select filling material and geotextile in accordance with the required strength and rigidity of soilbags. It should be noted that the analysis model in this study does not consider rupture of geotextile. In actual design, therefore, it is required to confirm that the response value of the tensile force of geotextile does not exceed the tensile strength of the geotextile.
5. Conclusion
In this study, a vertical compression test on
soilbags was conducted and the compressive
characteristics of soilbags was carefully investigated.
Moreover, numerical simulation on the corresponding
compression test was also carried out and the
deformation mechanism of the soilbags was discussed
in detail. The conclusions are outlined below.
1) The test results showed that compression
stiffness of soilbags increased as the compression
Table 3: Calculation conditions
strain increased, and that the soilbags have
enough bearing capacity to support the footing of
railway bridge.
2) The results of the numerical simulation coincided
almost the same as those of test, showing the high
applicability of the numerical method used in the
present research.
3) Vertical stress was largely shared by the centre
part of the soilbags, where the restraint effect of
soilbags is more prominent.
4) Both the principal stress ratio at critical state and
the rigidity of geotextile have great effect on the
deformation characteristics of soilbags. Therefore,
it is important to select filling material and
geotextile in accordance with the required
strength and rigidity of soilbags in actual design.
References
[1] Y. Hayashi, “Damage reduction effect due to basement uplift of buildings,” J. Struct. Constr. Eng., AIJ, no. 485, pp. 53-62, Jul., 1996. View Article
[2] K. Kawashima and K. Hosoiri, “Effect of nonlinear ricking response of spread foundations on the hysteretic behaviour of bridges,” Journal of JSCE, no. 703/ I-59, pp. 97-111, 2002. View Article
[3] H. Haya and A. Nishimura, “Proposition of design method of spread foundation considering large scale earthquake force,” Journal of JSCE, no. 595/ VI-39, pp. 127-140, 1998. View Article
[4] A. Hino, Y. Murono, A, Toyooka, and T. Doi, “Shaking table tests for seismic response of piers on soilbags,” Proceedings of the 20th Symposium on Performance-based Seismic Design Method for Bridges, pp. 137-140, 2017 (in Japanese).
[5] T. Doi, N. Oshida, A. Toyooka, and Y. Murono, “Bearing Capacity Characteristics of Spread Foundation Supported by Soilbags - Part. 1 Compression Test of Soilbag -,” 53rd Japan National Conference on Geotechnical Engineering, 2018.
[6] H. Matsuoka, S. Liu, T. Hasebe, and R. Shimao, “Deformation-strength properties and design methods of soilbag assembly,” Journal of JSCE, no. 764/ III-67, pp. 169-181, 2004. View Article
[7] T. Nonaka, K. Kojima, T. Yonezawa, T Sato, T. Morino, and H Aoki, PROPERTY OF GABION LAID BETWEEN THE HEAD PART OF IMPROVEMENT PILE AND CONCRETE SLAB FOR PILE SLAB TRACK, Geosynthetics Engineering Journal, no. 27, 93-100, 2012. View Article
[8] Railway Technical Research Institute, Design Standards for Railway Structures and Commentary Design Example RC Pier (Spread Foundations), 2015 (in Japanese).
[9] T. Doi, Y. Murono, H. Iwai, and H. Cho, “Analytical Study on Bearing Capacity Characteristics of Spread Foundation on Soft Ground Replaced by Soilbags,” 54th Japan National Conference on Geotechnical Engineering, 2019.
[10] T. Nakai and M. Hinokio, “A SIMPLE ELASTOPLASTIC MODEL FOR NORMALLY AND OVER CONSOLIDATED SOILS WITH UNIFIED MATERIAL PARAMETERS,” SOILS AND FOUNDATIONS, vol. 44, no. 2, 53-70, 2004. View Article
[11] H. Kato, H. Nishioka, K. Kojima, Y. Tamura, M. Kiguchi, T. Morino, Y. Suyama, and H. Aoki, COMPARISON OF THE STRAIN MEASUREMENT RESULT OF GEOTEXTILE UNDER THE LABORATORY TENSILE TEST AND THE FIELD TENSILE TEST, Geosynthetics Engineering Journal, no. 28, 221-228, 2013. View Article
[12] G. L. Ye, “DBLEAVES: User's manual,” Version 1.6, Shanghai Jiaotong University, China, 2011 (in Japanese and Chinese).