International Journal of Civil Infrastructure (IJCI)
ISSN: 2563-8084

Volume 4 - Year 2021- Pages 9-15
DOI: 10.11159/ijci.2021.002
Experimental and Numerical Analysis on the Rate-Dependent Cyclic Lateral Load on a Single Pile in Sand
Naba Raj Shrestha1, Masato Saitoh1, Chandra Shekhar Goit1, Alok Kumer Saha2
1Saitama University, Graduate School of Science and Engineering
255 Shimo-Okubo, Sakura-ku, Saitama, Japan
shrestha.n.r.322@ms.saitama-u.ac.jp; saity@mail.saitama-u.ac.jp; chandra@mail.saitama-u.ac.jp
2Bangladesh Atomic Energy Commission
E-12/A, Agargoan, Dhaka-1207, Bangladesh
alokbaec@gmail.com
Abstract - The loading rate effect on a single pile subjected to cyclic lateral loads is studied experimentally and numerically. In the experiment, a scaled model pile embedded in cohesionless sand is housed in a laminar shear box under 1g condition. Loads are applied with a horizontal actuator rigidly connected to the pile-head allowing only horizontal translation. The results show the significant effect of loading rate in bearing capacity of the lateral pile subjected to cyclic loading. Further, the variation of the lateral resistance of the piles is found to be a linear function of logarithmic of the loading rate. However, no effect of loading rate appears in the bending moment, deflection, and soil reaction profile along the pile depth, which indicates that soil near the pile shows a consistent failure pattern despite a significant change in the loading velocity. Experimental results are further verified with numerical analysis using a 3D FEM model.
Keywords: Cyclic load, Single pile, Rate effect, Finite element model.
© Copyright 2021 Authors - This is an Open Access article published under the Creative Commons Attribution License terms. Unrestricted use, distribution, and reproduction in any medium are permitted, provided the original work is properly cited.
Date Received: 2020-12-21
Date Accepted: 2020-12-21
Date Published: 2021-03-03
1. Introduction
Single piles in coastal and offshore structures are inevitably subjected to repetitive lateral loads. Earthquakes, wind, waves, blasts, and water pressures may generate such cyclic lateral loads to the pile-supported structures. These loads have a wide range of amplitudes and velocities at different time events. Generally, all the cyclic loading sequences can be characterized by four parameters: a) the maximum applied load, b) the load variation amplitude, c) the number of cycles, and d) the loading rate. A number of studies have been conducted in the past considering the first three parameters for the soil-pile system subjected to cyclic loading.[1-4] However, to the best of the authors' knowledge, the fourth parameter, i.e., the effect of loading rate on the cyclic lateral loads, has been neglected in most of the experimental investigations as well as analytical and numerical modeling.
In this study, a scaled single pile model embedded in dry homogeneous sand is investigated for lateral cyclic loading with a wide range of loading rate and displacement amplitudes. The effect of loading rate on the failure pattern of the soil near the pile is analyzed in terms of a load-deflection curve at the pile-head, bending moment distributions, pile deflections profile, and soil reaction profile along the pile depth.
The experimental results are further verified with a numerical model using the 3D Finite Element Model (3D-FEM) using a commercial software platform PLAXIS 3D (v20.03) which provided a versatile tool that is capable of modeling soil continuity, so nonlinearity, and soil-pile interface behavior.
2. Model Test
Scaling of a full-scale prototype to the fit in the laboratory test models are of fundamental importance for the simulation of the actual behavior of soil and structure material under reduced stresses, compared to the prototype. For the present experimental investigation, the scaling law derived by Kokusho and Iwatate [5] incorporating the effect of low confining pressure of soil pertaining to 1g condition was used. The similitude law considers the ratio of forces acting on the model and the prototype, suggesting a relationship between the model and prototype as,
where 𝜔m and 𝜔p are the cyclic loading frequency on the model and corresponding frequency on the prototype respectively, 𝛾m and 𝛾p are the dynamic strain on the model and corresponding strain on the prototype respectively, 𝜂 is the density scaling ratio of the model to the prototype and 𝜆 is the geometric scaling ratio of the model to the prototype.
For the current experiment, 𝜂 was adopted as 0.81, and 𝜆 was adopted as 0.05. The physical dimensions and properties of the prototype and model used in this study are summarized in Table 1.
2. 1. Experimental Setup
The experimental setup consists of a laminar shear box which is rigidly bolted with a unidirectional shaking table owned by Saitama University, Japan. The base plate size of the shaking table is 1800 mm ⨯ 1800 mm with ±200 mm maximum stroke. The inside measurements of the shear box are 1200 mm in loading direction, 800 mm perpendicular to the loading direction, and 1000 mm in depth (Figure 1). A similar experimental setup is followed in other lateral pile load testing experiments [6-8].
2. 2. Sand
Dry, homogeneous and cohesionless Gifu sand found in Japan was employed in the experiment. The standard properties of the Gifu sand include the specific gravity 2.64 maximum diameter 0.84 mm, coefficient of uniformity 1.59, maximum and minimum void ratio 1.13 and 0.72, respectively. The friction angle of the Gifu sand is 40.7°.
The sand was put inside the shear box in seven successive layers and each layer of sand was compacted with shaking table vibration of amplitude 7 m/s 2 and frequency 40 Hz to get the desired density of soil (1.46 Mg/m3). The corresponding void ratio was found to be 0.81 with an estimated relative density of 78%.
2. 3. Pile
A solid cylindrical pile made of polyoxymethylene homopolymer (POM-H) with a diameter (d) = 40 mm and length (L) = 900 mm was used. A solid cubical POM-H pile-head (125 mm ⨯ 125 mm ⨯ 125 mm) was rigidly connected with the horizontal actuator providing restraints in movements except in the direction of loading. A vertical gap of 35 mm between the top surface of sand and pile cap was provided to eliminate the resistance of the pile cap. Figure 1(a) shows the experimental setup of the single pile embedded in the sand.
Table 1: Prototype to model relation
| Items | Prototype | Model | Units |
| Length of pile (L) | 18.0 | 0.9 | m |
| Diameter of Pile (d) | 0.8 | 0.04 | m |
| Density of Pile (𝜌p) | 2.4 | 1.5 | Mg/m3 |
| Young’s modulus of pile (Ep) | 25.0 | 2.8 | GPa |
| Depth of soil (H) | 20.0 | 1.0 | m |
| Density of soil (ρs) | 1.8 | 1.46 | Mg/m3 |
| Shear wave velocity (Vs) | 171.5 | 96.0 | m/s |
| Natural frequency of soil (fn) | 2.14 | 24.0 | Hz |
5. Finite Element Modelling
2. 4. Pile Instrumentation
19 pairs of strain gauges were applied over the length of the pile, as shown in Figure 2, to measure the induced bending strain in the loading direction. Strain gauges at shallow depth were placed at close spacing knowing the bending moments and displacements are confined to the pile depths immediately below the pile-head. The curvature is simply calculated by dividing the bending strain by the radius of the pile. Further, the moment (M) at depth z is calculated by multiplying the curvature with flexural rigidity (EpIp) of the pile. Finally, double differentiation and integration of the bending moment, as shown in Eqs. (3) - (4), provides an indirect estimate of soil resistance, p, and the lateral deflection of the pile, y, respectively,


Since the bending moment obtained from the experiment was a discrete data set, a continuous smooth data set was obtained from a data fitting. Various solutions for the data fitting and processing for a laterally loaded pile are available in literature such as [9] and [10]. In this experiment, a polynomial equation method was used to process the experimentally measured bending strain data.
2. 5. Loadings
The loadings were applied at the pile-head using a digitally controlled unidirectional hydraulic actuator (±10 kN, ±150 mm). Four different displacement amplitudes of 5% of d (2 mm), 10% of d (4 mm), 15% of d (6 mm), and 20% of d (8mm) with three different loading rates of 0.01 mm/s, 10 mm/s, and 250 mm/s were applied for consecutive 3 cycles. The soil was brought back to the initial state after completing one loading rate case with all the displacement amplitude. The loading was applied in the ascending order of the loading amplitude for a selected loading rate case.
3. Numerical Model
Validation of experimental results is carried out with a three-dimensional nonlinear finite element model. Cyclic loads like that of the experimental model were applied to the numerical model which is also similar in physical dimension as shown in Figure 3.
3. 1. Pile and soil properties
The pile model is built with a linear elastic material having properties as listed in Table 1. To consider the nonlinearity in the soil model, the hardening soil model with small-strain stiffness (HS small) is utilized. HS small model describes the stiffness of the soil more accurately by using different stiffness parameters in comparison to simple linear perfectly plastic models such as the widely used Mohr-Coulomb model. The HS small formulation involves the degradation of the shear stiffness with the shear strain and it takes into account the high stiffness at the small strain level which is regained upon load reversal and also shows hysteresis that provides damping in the dynamic calculation [11]. The properties of the sand used in the modeling are summarized in Table 2 which are derived from a series of triaxial test results. The interface strength reduction factor, Rinter is calculated by trial-and-error to fit the experimental data.
3. 2. Meshing
The soil elements and pile including piles cap are modeled with 10-noded tetrahedral elements. The total number of nodes and elements for the single pile model as illustrated in Figure 3 are 35325 and 23696, respectively.
3. 3. Boundary Conditions
The bottom surface of the soil boundary is fixed against all movements in all directions, whereas the soil surface is free to move in all directions. The soil is free to move in the loading direction and vertical boundaries are fixed against movement into the orthogonal direction to resemble the laminar shear box.
Table 2. HS small data set for sand.
| Parameter | Value | Unit |
| Density, 𝛾 (dry) | 15 | kN/m3 |
| Cohesion, c | 1 | kN/m2 |
| Friction angle, 𝜙 | 40.7 | degree |
| Dilatancy, 𝜓 | 16 | degree |
| Interface strength reduction, Rinter | 0.67 | - |
|
Secant stiffness,
|
15000 | kN/m2 |
|
Oedometer stiffness,
|
12000 | kN/m2 |
|
Elastic u-r-stiffness,
|
45000 | kN/m2 |
| Shear stiffness, G0 | 32000 | kN/m2 |
| Threshold shear strain, γ0.7 | 1.55⨯10-4 | - |
| Stress exponent, m | 0.7 | - |
| Poisson’s ratio, 𝜈’ | 0.2 | - |
| Failure ratio, Rf | 0.9 | - |
| Coeff. of lateral stress, K0 | 0.34 | - |
| Rayleigh Damping, 𝜉1 & 𝜉2 | 1% | - |
| Rayleigh Damping, f1 & f2 | 24 | Hz |
3. 4. Loading and analysis
The three loading cases as considered in the experiment i.e., 0.01, 10, and 250 mm/s are applied for both the pie head with target displacement of 20% of pile diameter, i.e., 8 mm. Displacement controlled load is applied at the pile head with a time interval of 0.0005 seconds. The small-time interval is considered to get enough loading steps particularly in the case of a higher loading rate.
4. Results and Discussions
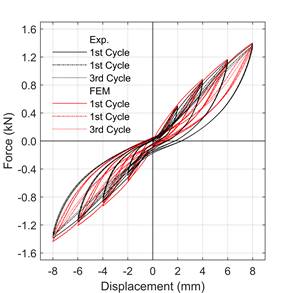
The force and pile-head deflection measured from the cyclic loading tests are shown in. Figure 4. The residual displacement in the force-displacement curve reveals the inelastic behavior of the soil. However, the load-deflection curve in the Figure does not show any yielding behavior even with the large lateral deflection amplitude (20% of the pile diameter i.e., 8 mm). Similar results were reported in the monotonic lateral loading test on a single pile by [7, 12]. Degradation in the force in the successive cycles is clear in the loading part of the curve, whereas, unloading part is unaffected by the number of cycles.
Comparing the force-displacement diagrams in Figure 4. (a), Figure 4. (b) and Figure 4. (c) for 0.01 mm/s, 10 mm/s, and 250 mm/s, respectively, the force increases with loading rate at any given displacements for both positive and negative cycles of the loading. For example, at 8 mm displacement in the positive cycle, the increase in force with respect to 0.01 mm/s loading rate are 11% and 14% for 10 mm/s and 250 mm/s loading rate, respectively.
The force-displacement relationship obtained from the FEM analysis shows a good match with the experimental results as depicted in Figure 4. In addition to nonlinearity on the force-displacement relationship and the loading rate effect, the cyclic loading effect is also simulated in the numerical analysis with the HS small model. The rate effect in the model is mainly due to the inclusion of Rayleigh damping in the HS small model and the inertial effect of load on the soil-pile system. However, in the experiment, the rate effect is due to two essential components which are the inertial force and velocity-dependent force such as viscous force and drag force [13]. The viscosity, in general, represents the time-dependent force such as creep-relaxation or the strain rate effect that are directly proportional to the first order of velocity whereas the drag force depends on the first or higher order of velocity based on Stokes’s law.
 a)
a) 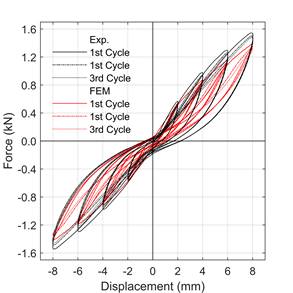 b)
b)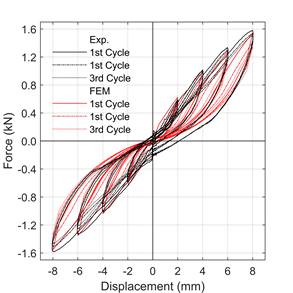 c)
c)
A linear empirical relationship between the force and loading rate is found an assumption proposed by [14] and followed by other researchers such as [15]. The equation of the fitted straight line in Figure 5 can be written as
where, F(v) and F(vr) are the lateral resistance at a specific horizontal deflection at loading rates v and vr, respectively; 𝛼 is a coefficient defined as the increase in lateral resistance normalized by the lateral resistance at the reference loading rate. The 𝛼 values for the positive cycle of loadings are summarized in Table 3.
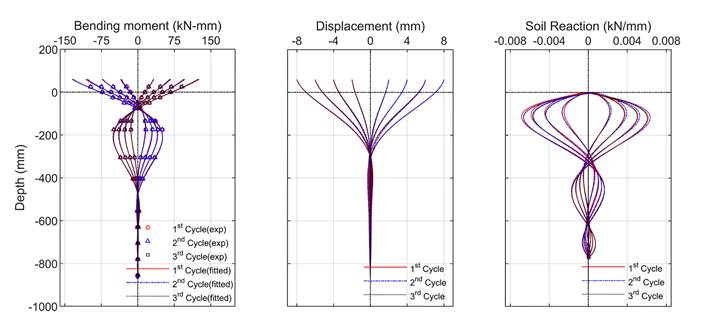
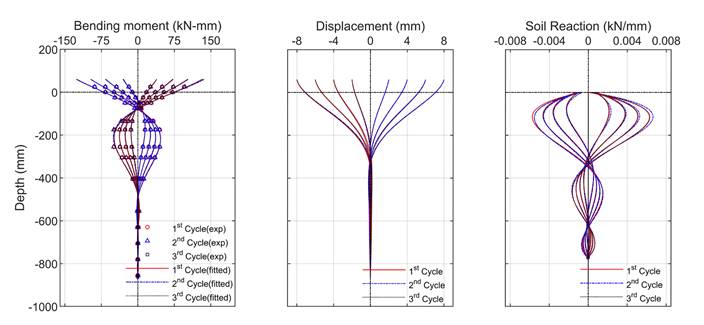
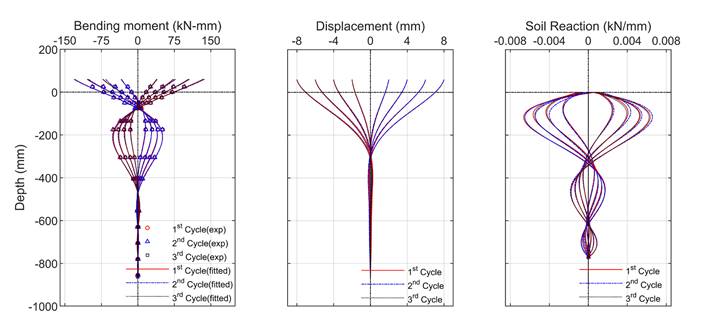
Moreover, bending moment profile along the pile length at various displacements (±2mm, ±4mm, ±6mm, and ±8mm) with a loading rate of 0.01 mm/s, 10 mm/s, and 250 mm/s are presented in Figure 6 for successive 3 cycles. Out of 19 pairs of strain gauges, 3 pairs were damaged during the experiment, and therefore the data from the remaining 16 pairs of strain gauges were utilized. Experimentally evaluated bending moments were fitted with a seven-degree polynomial equation. The fitted equation was further processed with double integration and double differentiation, as described earlier. The two boundary conditions employed during integrations are; a) known displacement at the pile-head, and b) an assumption of zero-degree rotation angle at the pile toe.
In contrast to the rate dependency on the force-displacement behavior, the bending moment, displacement and soil reaction profile are similar for different loading rates. This suggests the failure pattern of soil near the pile-soil is consistent regardless of the rate of cyclic loading. Moreover, there is no effect of a number of cycles on the bending moment, displacement, and soil reaction profile of the soil-pile system.
Table 3: Values of 𝛼 at different displacements and cycles
| Displacements | 2 mm | 4 mm | 6 mm | 8 mm |
| 1st cycle | 0.040 | 0.037 | 0.034 | 0.031 |
| 2nd cycle | 0.038 | 0.036 | 0.032 | 0.028 |
| 3rd cycle | 0.037 | 0.038 | 0.033 | 0.027 |
 a) b)
a) b) c)
c)
a)
b)
c)
5. Conclusion
The rate effect in cyclic loads to an instrumented pile model embedded in dry homogeneous sand is investigated experimentally under 1g condition and verified with a 3D finite element model. A wide range of velocities are applied with various displacement amplitude at the pile-head fixed in the rotational direction. The loading rate effect is analyzed on a force-displacement relationship and bending moment, deflection, and soil reaction profile over the length of the pile. Based on the results, it is concluded that the lateral bearing capacity of the pile subjected to cyclic loading significantly exhibits rate-dependent characteristics. The rate-dependent behavior of bearing capacity can be approximated with a linear function of logarithmic of loading rate. However, the failure pattern of the soil near the pile is considered as a consistent behavior. These findings provide a valuable understanding of the laterally loaded pile under cyclic loading, which may help engineers to evaluate the performance of the pile foundation more precisely.
Acknowledgments
This work was supported by KAKENHI Grant-in-Aid for Scientific Research (B) JP18H01517 from Japan Society for the Promotion of Science (JSPS).
References
[1] S. Banerjee, S. H. Goh, and F. H. Lee, "Response of soft clay strata and clay-pile-raft systems to seismic shaking," Journal of Earthquake and Tsunami, vol. 1, no. 03, pp. 233-255, 2007. View Article
[2] R. W. Boulanger, C. J. Curras, B. L. Kutter, D. W. Wilson, and A. Abghari, "Seismic soil-pile-structure interaction experiments and analyses," Journal of geotechnical and geoenvironmental engineering, vol. 125, no. 9, pp. 750-759, 1999. View Article
[3] B. Manna and D. Baidya, "Nonlinear dynamic response of piles under horizontal excitation," Journal of geotechnical and geoenvironmental engineering, vol. 136, no. 12, pp. 1600-1609, 2010. View Article
[4] C. Zhang, D. White, and M. Randolph, "Centrifuge modeling of the cyclic lateral response of a rigid pile in soft clay," Journal of Geotechnical and Geoenvironmental Engineering, vol. 137, no. 7, pp. 717-729, 2011. View Article
[5] T. KOKUSHO and T. IWATATE, "Scaled model tests and numerical analyses on nonlinear dynamic response of soft grounds," in Proceedings of the Japan Society of Civil Engineers, 1979, vol. 1979, no. 285: Japan Society of Civil Engineers, pp. 57-67. View Article
[6] C. S. Goit and M. Saitoh, "Model tests on horizontal impedance functions of fixed-head inclined pile groups under soil nonlinearity," Journal of Geotechnical and Geoenvironmental Engineering, vol. 140, no. 6, p. 04014023, 2014. View Article
[7] N. R. Shrestha, M. Saitoh, A. K. Saha, and C. S. Goit, "Frequency- and intensity-dependent impedance functions of laterally loaded single piles in cohesionless soil," Soils and Foundations, 2020/12/09/ 2020. View Article
[8] C. S. Goit, M. Saitoh, G. Mylonakis, H. Kawakami, and H. Oikawa, "Model tests on horizontal pile-to-pile interaction incorporating local non-linearity and resonance effects," Soil Dynamics and Earthquake Engineering, vol. 48, pp. 175-192, 2013. View Article
[9] A. E. Haiderali and G. Madabhushi, "Evaluation of curve fitting techniques in deriving p–y curves for laterally loaded piles," Geotechnical and Geological Engineering, vol. 34, no. 5, pp. 1453-1473, 2016. View Article
[10] T. Zhao and Y. Wang, "Interpretation of pile lateral response from deflection measurement data: A compressive sampling-based method," Soils and foundations, vol. 58, no. 4, pp. 957-971, 2018. View Article
[11] T. Schanz, P. Vermeer, and P. Bonnier, "The hardening soil model: formulation and verification," Beyond 2000 in computational geotechnics, pp. 281-296, 1999. View Article
[12] K. Madhusudan Reddy and R. Ayothiraman, "Experimental studies on behavior of single pile under combined uplift and lateral loading," Journal of Geotechnical and Geoenvironmental Engineering, vol. 141, no. 7, p. 04015030, 2015. View Article
[13] M. Jahanandish, G. Sadeghian, M. Daneshvar, and M. Jahanandish, "An Experimental Investigation on the Amount of Drag Force of Sand on a Cone Moving at Low Uniform Speed," International Journal of Geotechnical and Geological Engineering,
[14] H. G. Poulos, "Single pile response to cyclic lateral load," Journal of Geotechnical and Geoenvironmental Engineering, vol. 108, no. GT3, 1982.
[15] L. Kong and L. Zhang, "Rate-controlled lateral-load pile tests using a robotic manipulator in centrifuge," Geotechnical Testing Journal, vol. 30, no. 3, pp. 192-201, 2007. View Article