International Journal of Civil Infrastructure (IJCI)
ISSN: 2563-8084

Volume 4 - Year 2021- Pages 16-24
DOI: 10.11159/ijci.2021.003
Seismic Performance of Reinforced Concrete Shear Wall Buildings
S. A. Hossain1, A. Bagchi2
1Ph.D. Candidate (Structural and Earthquake Engineering),
Department of Building, Civil and Environmental Engineering
Concordia University, Montreal, Canada
Lecturer, Department of Civil & Environmental Engineering and Construction Management
College of Engineering, University of Texas, Tyler, USA
shossain@uttyler.edu
2Professor and Chair, Department of Building, Civil and Environmental Engineering
Concordia University, Montreal, Canada
Ashutosh.Bagchi@concordia.ca
Abstract - This article presents a study on the seismic performance of reinforced concrete shear wall buildings with focus on shear strength of walls that are designed using the seismic design provisions of the National Building Code of Canada. A set of buildings, four, six and eight storeys with a simple configuration and different heights have been considered here. While the static and linear dynamic analyses indicate the robustness in the design but dynamic time history analysis indicates deficiency in the shear capacity in the plastic hinge region. It is observed that a dynamic amplification factor for shear on flexural walls governs the shear demand. Here, a simple method has been proposed to estimate the amplified shear demand and to enhance shear resistance of a structural wall economically to avoid unintended shear failure.
Keywords: Reinforced concrete, Shear wall, Seismic demand, Dynamic analysis.
© Copyright 2021 Authors - This is an Open Access article published under the Creative Commons Attribution License terms. Unrestricted use, distribution, and reproduction in any medium are permitted, provided the original work is properly cited.
Date Received: 2020-11-11
Date Accepted: 2020-11-14
Date Published: 2021-03-03
1. Introduction
Failure of structural walls in shear has been identified as one of the reasons that can diminish the expected level of performance and lead to the big financial loss. For instance, the amount of America’s financial losses in the 1990s’ is estimated to be twenty times bigger than that of three earlier decades all together [1]. This is despite the fact that all the structural walls are designed according to the building code requirements, but these structural walls have still been a challenge and are failing with different reason including inadequate shear capacity. They should have adequate displacement capacity to ensure the satisfactory level of performance of the wall [2-3]. Building codes in various jurisdictions including Canada have moved towards performance-based design approaches. The National Building Code of Canada (NBCC 2005); has been provided in an objective based code format which provides under the “Alternative Solution”; category that a structure can be designed not only to have adequate strength, but also for the performance attributes, such as deformability. Although, the current seismic design approach of ductile RC shear wall provided by the NBCC 2005 and CSA A23.3-04 is more rational than the earlier editions; yet, despite all improvements made to them they do not specially address the higher mode effects on the base shear demand in the shear walls [4]. It also should be noted that even such improvements provided under “alternative solutions” that gives way for PBSD (Performance based seismic design), can still result in a major brittle shear failure. For instance, an increase in participation of higher modes of vibration can result in decrease of building drifts, and in a sense, a more desirable level of performance. But, on the other hand, such increase can also cause considerable increase in shear force demand at the base of the shear walls, particularly after formation of plastic hinge. If not taken into account, such magnification can result in a brittle shear failure, and turn the seeming desired level of performance into a major loss. Hence, it is very inevitable that still it requires a lot of study and research on this field to mitigate these problems.
2. Literature review
Higher modes of vibration play an important role for enhanced shear demand. Blakeley et al. [5], were the first pioneer the idea that higher modes of vibration not only magnifies the elastic shear demand at the base of shear walls, but also increases the demand more appreciably after the structure enters inelastic phase and plastic hinge forms.
The recent work of Boivin and Paultre [6], shows that for the regular multi-storey ductile RC cantilever or coupled walls, the capacity design shear envelope determined from (CSA A23.3-04) to prevent shear failure can largely underestimate the shear force demand under design level ground motions, even when the wall response is slightly inelastic. This kind of underestimation results from a deficiency of the present codes to account for dynamic amplification effects, in the elastic and inelastic regimes, due to higher lateral modes. Boivin and Paultre [6], identified two sources of underestimation: (i) the 2005 NBCC spectral accelerations underestimate the elastic responses of higher lateral modes of the walls because their traditional 5% damping overestimate actual damping (about 2% on average) and that makes reducing the higher mode responses; and (ii) as per CSA standard A23.3-04, the capacity design method for shear strength design do not account for the dynamic amplification of shear forces due to inelastic effects of higher modes.
Boivin and Paultre [4], also noted that the capacity design method prescribed by CSA standard A23.3-04 to prevent unintended plastic hinges above the base plastic hinging region is not free from such a problem because it is formulated based on amplified elastic forces which is tributary of the analysis method, static or dynamic, used to derive these forces.
For New Zealand code and standard of the time, they recommended the shear force relative to the moment capacity (allowing for different sources of strength such as actual yield strength of steel greater than minimum specified) be calculated and then to be magnified based on their number of stories and class of importance. Their work then became the basis for modifying structural wall’s base shear in many standards of the time.
Among many other countries, the earlier edition of Canadian Standard, CSA A23.3-94 (CSA 2001) also adapted New Zealand’s approach (NZS 1995) in which was recommended as:
[1] 1 ≤ J /1.25 * (0.9+N/10) N ≤ 6
[2] 1 ≤ J /1.25 * (1.3 +N/30) ≤ 1.8 N > 6
In that J/1.25 is to adopt the original formulas into Canadian Standard; J is a reduction coefficient in NBCC that accounts for higher modes of vibration in the Equivalent static load method, and 1/1.25 is to account for the difference between probable and nominal values used in Canadian and New Zealand standard respectively. However, the New Zealand approach is not recommended in the current standard of practice A23.3-04 anymore.
Another approach that is compared with the results of this study are proposed by Filiatrault et al. [7], suggested that the shear demand to be calculated using the ESL method formula, V = U * Ve / R (NBCC 1995), in which V is the design base shear, Ve is the equivalent lateral force at the base, U is a calibration factor equal to 0.6, and R is the force modification factor. But they suggested that the R to be replaced by a factor Rv equal to 1.0 in seismic zones Za ≥ Zv and 1.5 when Za < Zv. On the other hand, Ghosh and Markevicius [8], suggested that the base shear to be calculated using 0.25W×a + My / (0.67hn) equation in which W is the seismic weight, a is the design peak ground acceleration, and My is the yield moment of the wall, and hn is the building total height.
Currently, no method of analysis is capable of capturing the effect of higher modes of vibration but dynamic analysis. Yet, an elastic dynamic analysis is not sufficient if plastic hinge forms in the shear wall. That is because vibrating in the elastic range constitutes only a small portion of the effect of higher modes and the major portion of base shear magnification takes place after formation of plastic hinge that an elastic analysis is not capable of capturing it. However, because of its complication, inelastic dynamic analysis of RC structures is not an approach of common practice. On the other hand, the initial approach for seismic design of RC shear walls used in most building codes is the equivalent lateral load method. Beside the fact that the Canadian code and standard do not implicitly address deficiency of such effects, the existing recommendations suggested for inclusion of the effects of higher modes of vibration still either underestimate or well overestimate the base shear demand in walls, or seems not to cover a large range of building heights.
3. Objectives
The objective of this research is to do a comparative study of different analyses methods like equivalent lateral force method, response spectrum analysis and dynamic time history analysis of reinforced concrete shear walls using Canadian National building Code and to check the design adequacy of reinforced concrete shear walls as per CSA A23.3-04, with seismic demand analyses from these Static, linear dynamic and dynamic time history analyses. And to propose any suitable solution, if any discrepancy arises between seismic demand and shear wall capacity as per Canadian design standards considering linear and time history dynamic analysis, which is usually not considered in standard practice.
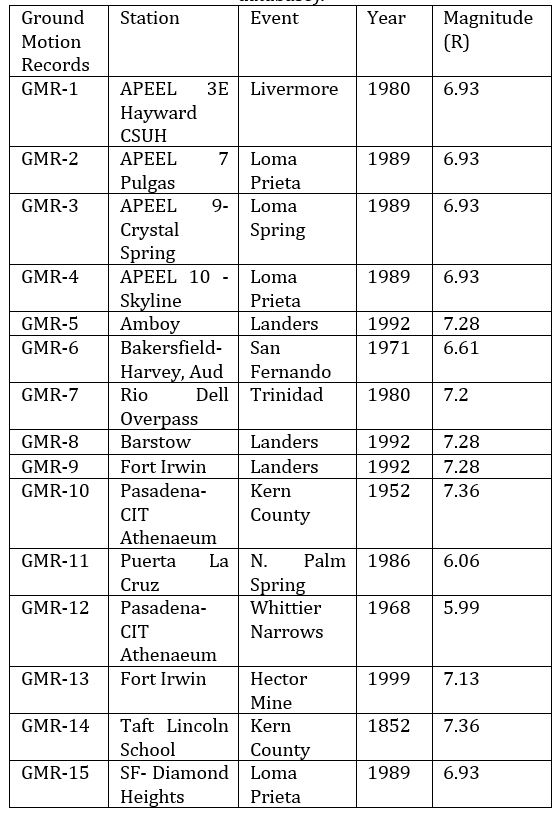
4. Methodology
A set of buildings with a simple configurations and different heights have been modeled in ETABS. The seismic design parameters are considered for Vancouver locations. It has been utilized the real seismic database from PEER (Pacific Earthquake Research Institute). Fifteen ground motion records (GMR) have been used for this study, those are shown in table 1; These 15 records have ratios of peak acceleration (A) to peak velocity (V) close to 1 which represents the seismicity of Vancouver, [9]. A comparative study has been performed between, ELF method, Response Spectrum analysis and Dynamic Time History analysis.
Three reinforced concrete RC office buildings with shear wall of 4, 8, and 16 storey heights and 3 bays by 3 bays in plan are modelled and performed analysis and design in ETABS. The buildings fall into the category of regular symmetric buildings according to NBCC 2015. The floors are designed as floor plates. The buildings are of heights equal to 15.8, 30.4, and 59.6 m, respectively covering limits of the applicability of the ESL methods as permitted by NBCC 2015. The range of heights considered here also cover both flexural and shear behaviour of walls. In low rise buildings the shear behaviour is dominant and in the high building the flexural behaviour is dominant.
The periods obtained from modal analysis are found to be more than the corresponding values of Ta by empirical formula in all the buildings. Therefore, the fundamental periods of the buildings are revised to maximum 2Ta as recommended in NBCC 2015.The design live load is equal to 2.4 kN/m2 for all floors except for the first storey which is 4.8 kN/m2. The snow load is calculated to be 2.3 kN/m2. The dead load is 0.85 kPa for exterior walls, 1.0 kPa for partitions on floors, 0.5 kPa for ceiling and mechanical services for all floors and 0.5 kPa for roofing. It has been considered ductile shear walls, with Rd=3.5 and Ro=1.6 for the lateral force resisting system as stated in the code, where Ro and Rd are overstrength and ductility factors, respectively.
Located in Vancouver, location of high seismic activity region in Canada, the buildings are assumed to be founded on class “C” soil. The initial stiffness of the members is estimated based on the CSA-A23.3-04 provisions for seismic resisting buildings and is kept unchanged over every few floors. For instance, the eight storey walls are modelled with a flexural rigidity of 0.68EIg for storey one to flour, and 0.64EIg for stories five to eight.
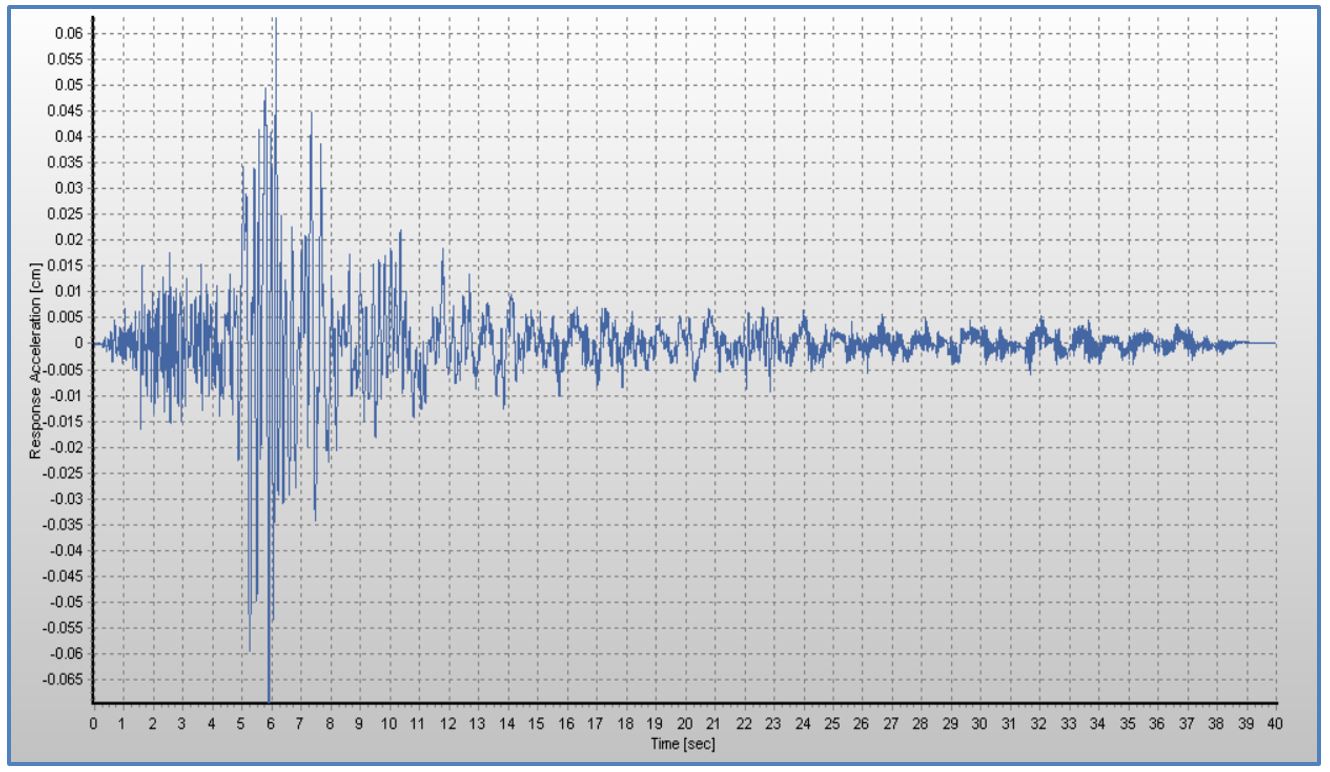
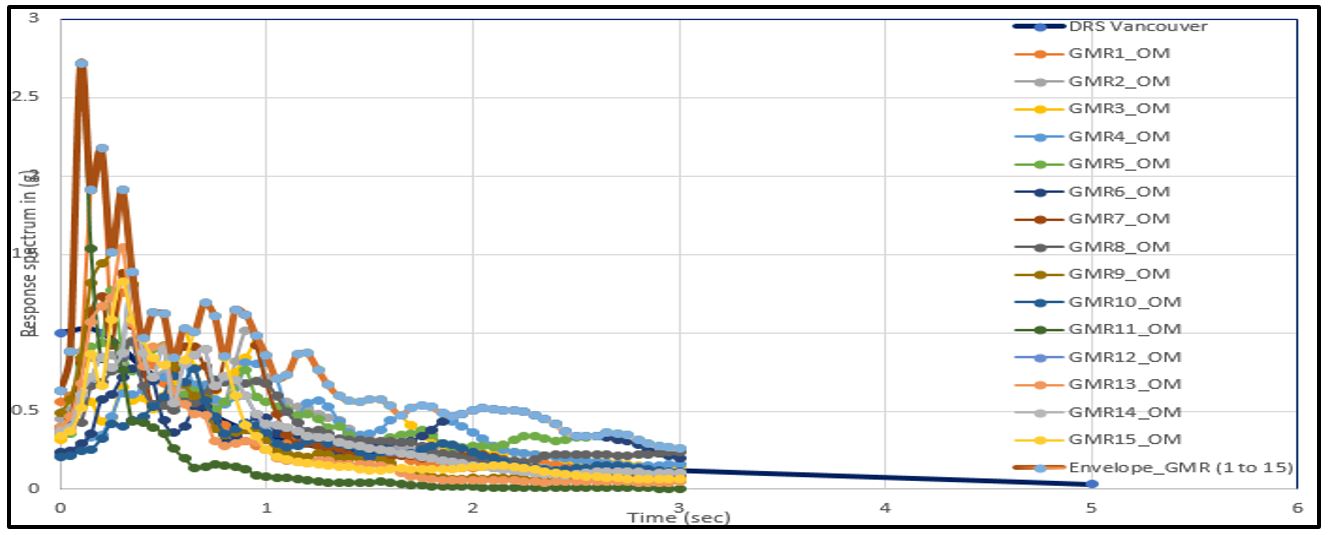
The following two methods are used for scaling the 15 historical earthquake records (PEER database) to fit them into the response spectrum provided in the code. It has been used Seismosignal software to analyse these ground motion data. The scaling methods considered here are: (i) Partial Area Method (PAM) and (ii) Ordinate Methods (OM). For the ordinate method (OM), the accelerograms were scaled by a ratio of “design spectral ordinate’’, and “spectral ordinate of the accelerograms” both at the fundamental period T1; In the Partial Area Method (PAM), the accelerograms were scaled by a ratio of the area under the design spectrum of an accelerogram, both within the same period interval “T2’ to “1.2T1”; The typical spectra from the 15 accelerograms and ETABS models are shown in below figure 1 and figure 2; It has been shown the response acceleration vs time period for GMR-1 in figure 2 and envelope scaled response spectrum vs design response spectrum (Vancouver) for 08 storey building in figure 3;
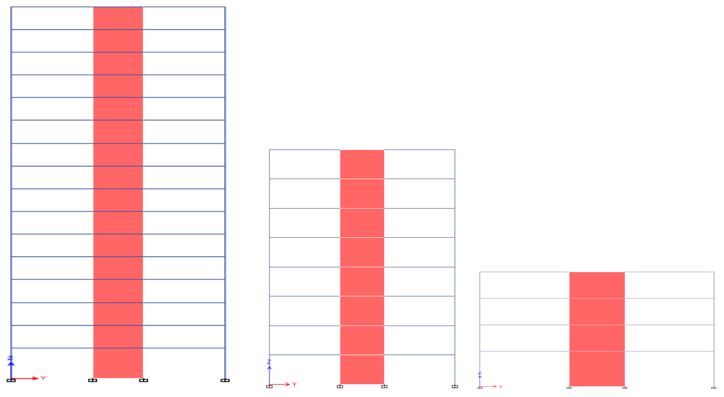
Table 1. Ground Motion Records used for Analysis (Ref. PEER database).
5. Assessments of Results
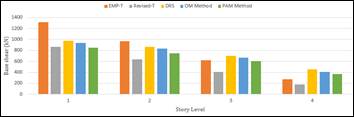
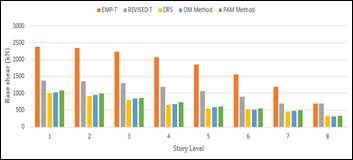
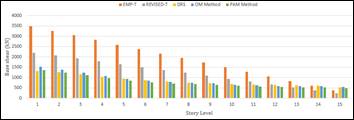
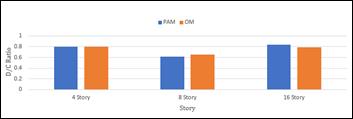
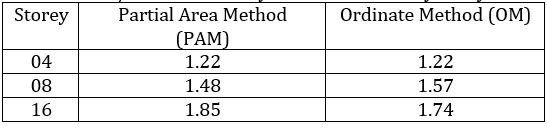
For comparison, the base shear demand and its distribution along the height of the critical wall for each building for different analysis methods are shown in below figure 4, 5, and 6; It has been observed that the base shear demand increases with the storey height with the same floor area. But this increase is not directly proportional to seismic weight of the buildings. Effect of time period and higher mode affect come into play in this scenario. In figure 7, it has been plotted the factored base shear demand to factored shear capacity in static analysis. And the D/C ratio is less than one. And in figure 8, it has been plotted the ratio of factored base shear demand to base shear capacity from detail time history analysis. And the D/C ratio is greater than one shows inadequacy in shear wall design that is usually not considered in standard practice. Moreover, it can be observed the increase of higher mode effect with building height from this diagram, figure 7 and 8; It can be seen also that the ratio of factored base shear demand to factored shear capacity increases with the increase of building height, but that increment is not proportional to the story height. This is because, with the increase of height the inelastic rotation requirement become the more dominant parameter in shear wall design. Therefore, it will be seen later in this paper that it seems more reasonable to dynamically amplify the shear capacity of the wall rather than using the common approach which is amplifying the factored or probable shear demand resulting from elastic analyses.
It has been observed from figure 8, that the shear demand capacity ratio increases with increasing the height of the buildings and those are 1.22, 1.48 and 1.85 (Partial Area Method) and 1.22, 1.57, and 1.73 (Ordinate Method) for 04, 08 and 16 storey buildings respectively. It needs to be noted that in below figures, EMP-T, Revised-T, and DRS denote the base shear due to time period based on code empirical equation, code limit and ETABS calculation considering design response spectrum respectively.
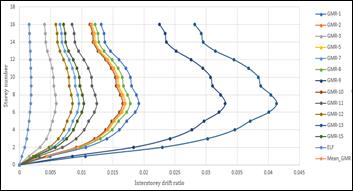
It has been plotted the variation of dynamic amplification factors (β = VE/VR and 1.4*VE/VR) in different proposed method vs storey height in figure 10. It needs to be mentioned that in figure 9, the proposed multiplication factor is VE/VR for 04 storey building and 1.4*VE/VR for 08 and 16 storey buildings. Details comparison are shown in section 7.0 of this paper. The fundamental periods are increasing with increasing of storey height. In these calculations it has been considered minimum wall thickness as per Canadian standards. It has been observed that the interstorey drift ratio of 16 storey building figure 11, as per 1.0DL+0.5LL+1.0Ex load combination is within the limit. (0.002*Rd*Ro)/IE=0.011˂0.025), but as per load combination from time history analysis the interstorey drift is not within the code limit (0.017*Rd*Ro)/IE=0.095; This is because of higher base shear demand. It has been shown detailed discussions and conclusions in section 8.0;
6. Summary of cost to increase shear strength at critical regions: [RS Mean data-2009]
It has been designed the shear walls for all buildings in this study (4, 8 and 16 storey) as per Canadian standards and calculated additional reinforcement cost to provide additional shear capacity using the proposed approach mentioned in this study and summarized in below table (Table 2). It has not been shown the detail design calculation in this paper due to page limitations.
It has been found that a very negligible effect on cost increase in this study, max (0.3%);
Table 2. Modification factors for shear strength vs additional cost.
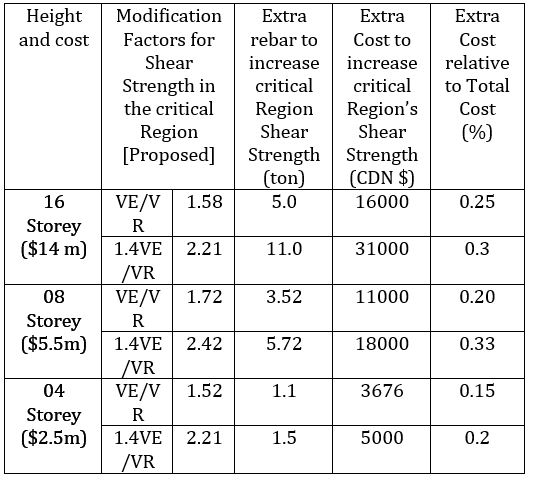
Table 3. D/C ratio due to Dynamic Time History Analysis.
7. Comparison of results
It has been compared the result of this study (proposed VE/VR or 1.4* VE/VR as a multiplication factor) with previous New Zealand code and study of Filiatrault et. Al. [7], and summarized in below table (Table 4). It has been observed that, the original New Zealand approach (NZS 1995) and that of adapted CSA A23.3-94 (the original New Zealand approach multiplied by J/1.25) results in shear values those are also comparable with the values from inelastic analysis of this study. From below table 4, it can be observed that both of the New Zealand and that of adapted to standard CSA A23.3-94 give close estimation of shear demand, they are at the lower bound that can be viewed as an underestimation of shear demand.
However, using VE/VR or 1.4*VE/VR ratio as an amplifying multiplier gives a better estimate of shear demand that are comparable to results from the New Zealand approach. Moreover, the proposed approach gives even a better result compared to those of New Zealand approach even in case of using probable shear demand Vp as the multiplicand. Here Vp, Vr and Vn denote probable base shear demand, factored shear capacity and nominal shear capacity of wall respectively.
Table 4. Variation of shear demand (Proposed) from Dynamic Time History Analysis (%).
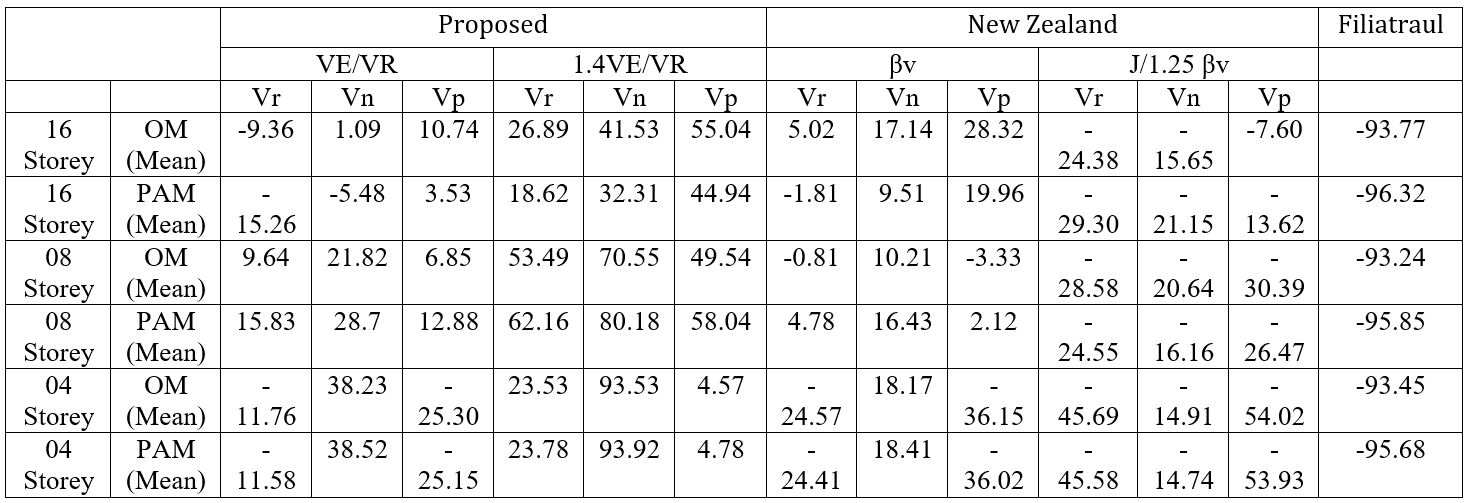
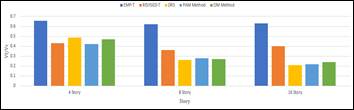
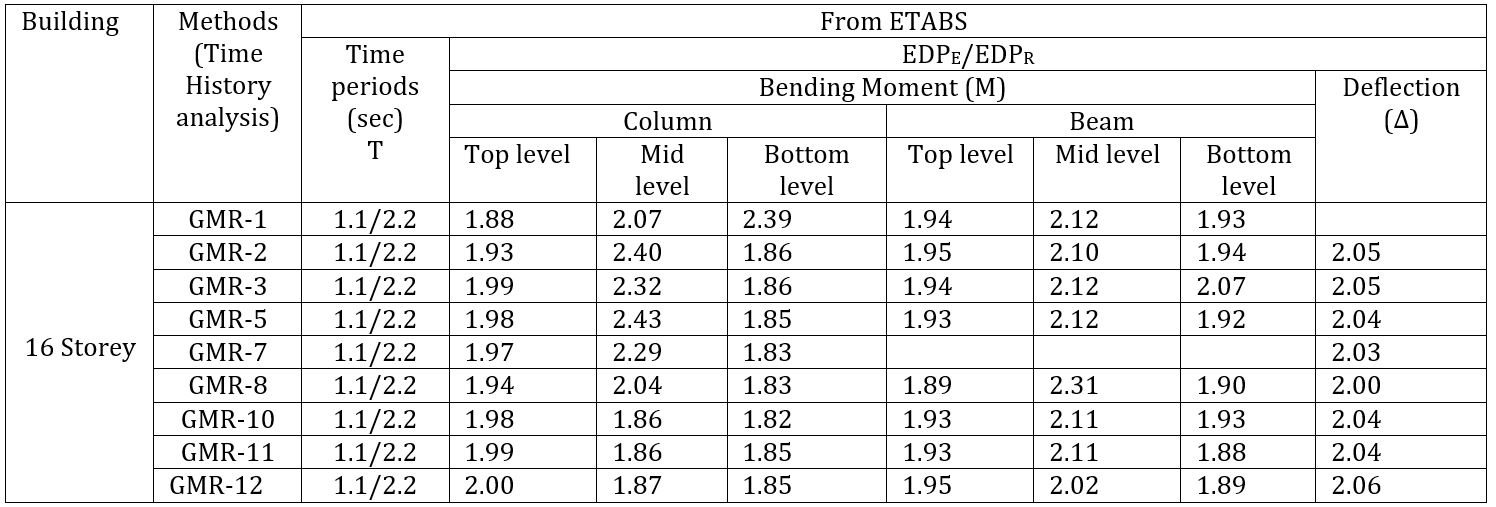
Table 5. Ratio of Engineering Demand Parameter with respect to time period due to empirical equation and code limit (Other building frame members).
8. Discussion
The present study focuses on the evaluation of buildings based on National Building Code of Canada. Equivalent static load method, response spectrum analysis and dynamic time history analysis have been carried out in the design and evaluation process. The different findings from this study are summarized as follows:
The static and response spectrum analyses indicate the robustness in the design that the shear demands on the shear walls are below the shear capacities (D/C˂1), while the dynamic time history analysis indicates deficiency in the shear capacity in the plastic hinge region. Based on the dynamic time history analysis, it has been found that the shear demand in the walls is well above the capacity (D/C˃1); It has been proposed dynamic amplification factors for modification of such deficiency. The ratio of probable base shear demand to factored shear capacity are shown in table 3; For calculation of probable base shear calculation, it has been calculated flexural overstrength as per CSA A23.4-04.
It is determined that the shear capacity of a wall in the hinge region where the shear critical section is located, needs to be increased by a factor of VE/VR or1.4VE/VR in order to keep the shear demand lower than the capacity. Here, VE represents the base shear due to time period from empirical equation and VR represents base shear due to revised time period as per Canadian code. The dynamic amplification factors for 4, 8, 16 storeys are determined 1.52, 1.72, 1.57 respectively for multiplication factor VE/VR and 2.12, 2.41, 2.21 respectively for multiplication factor 1.4*VE/VR.
The dynamic amplification factor (β) with respect to different storey are plotted in figure 10. It is not a straight-line variation. Since dynamic amplification factor depends on frequency ratio and damping ratio. And the frequency depends on the stiffness and mass of the building. Here, β represents VE/VR or 1.4VE/VR.
It has been found a good agreement ratio of the engineering design parameters, moment, shear and deflection with respect to empirical time period and revised time periods with this proposed multiplication factors, VE/VR and 1.4VE/VR. Details comparisons are shown in table 5; It has been observed also that the D/C ratio shown in table 3, (D/C>1), which is failing due to considering detail time history analysis base shear has a good agreement with this multiplication factors (VE/VR or 1.4VE/VR) as well as the dynamic amplification factors.
The proposed factor has been proposed to apply to the shear capacity of the wall rather than shear demand from elastic analysis. And after applying these factors with shear capacity, it has been plotted D/C ratio in figure 9, which is less than one.
It is shown in table 4, the variation of proposed shear demand from dynamic time history analysis in percentage and VE/VR and 1.4*VE/VR shows most of them are positive values.
From table 4, it has been observed also that using these factors (VE/VR or 1.4VE/VR as an amplifying multiplier factor gives a better estimate of shear demand that are comparable to results from the New-Zealand approach and Filiatraul et.al. [7].
It also can be observed from detail shear reinforcement calculation of these buildings as per CSA A23.4, that the proposed approach results in a better estimate of shear demand on wall in any case, whether magnifying the probable shear demand [(Mp/Mf) *Vf] obtained from elastic analysis or magnifying shear capacity of the wall from capacity design approach. It needs to mention that to increase the shear capacity, it has been used CSA A23.4, ductility approach to apply those proposed multiplication factors. The probable base shear demand has been calculated from CSA A23.4 capacity design approach, that plotted in figure 8 and can be commented that the Canadian capacity design for shear wall design is adequate for linear static and response spectrum analysis but it is inadequate for the shear demand from dynamic time history analysis. For probable shear demand calculation, it has been used γw (overstrength factor) equal to 3.49; It can be noted that the value of γw equal to 4 approximates the theoretical overstrength limit before shear strength design of ductile walls is controlled by elastic shear force, [4]. The study performed by Boivin and Paultre indicates that for maximum shear amplification happens for concrete shear wall with lower value of γw (1.3) and minimum shear amplification happens with the value of γw (4.0) with time period, 4.0 sec [4];
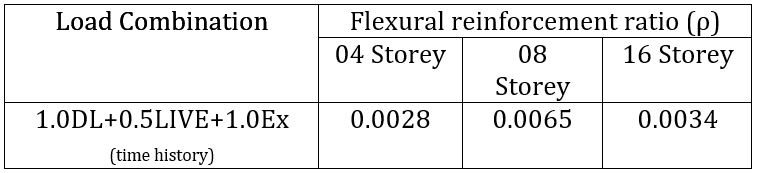
It has been re-checked the ductility of the shear wall as per Canadian code (CSA A23.4), clause 21.5.7.2, after increased the shear capacity by adding additional reinforcements. It has been found rotational capacity is more that the rotational demand in all the possible load combinations. For calculation of rotational demand it has been considered concrete strain 0.0035, and γw from 1.3 to 4.0, just to make sure the lower and upper limit. Depth of compressive stress blocks are also re-checked in different cases. The governing load combination for flexural reinforcement is found 1.0DL+0.5LIVE+1.0Ex (time history); And the reinforcement ratio is shown in below table 6;
Table 6. Flexural reinforcement ratio (ρ) with governing load combination.
It has been studied also the effect of wall thickness on base shear demand and interstorey drift ratio. It has been observed that by increasing wall thickness from 450 mm to 500mm on 08 storey building, there is not significant base shear changed. Whereas, the interstorey drift can be reduced by 22 percent (not shown in this paper). It has been done detail cost analysis also due to increase of reinforcement for increasing section shear capacity considering ductile design and found that the shear strength of the walls can be modified at a relatively small expense; as compared with the whole buildings. It is estimated at 0.2, 0.33 and 0.3 percent of the building total cost for 4, 8 and 16 storeys building respectively; the shear capacity in walls can be increased such that D/C ratio is lower than one. The results are tabulated in table 2;
9. Conclusion
Hence, it can be commented that using the proposed scheme for shear capacity modification of shear walls, a well-defined level of performance for buildings can be achieved and it can be related to the design shear forces estimated using the equivalent static load method provided in the building code. As this work is based on seismicity of Vancouver, and National Building Code of Canada, similar work can be performed considering different seismicity and other National Building codes.
In this study for analysis process 5% damping is considered for all buildings, the effect of other damping is not considered. It has been considered Newmark method for time-history analysis base shear calculation in ETABS modelling. Since the configuration of the buildings studied here is simple and symmetric, the effect of accidental torsion is found to be negligible.
References
[1] FEMA 2000 a. Action plan for performance based seismic (FEMA-349), Federal Emergency Management Agency, Washington, D.C.
[2] Paulay, T. and Priestley, M.J.N. 1992. Seismic Design of Reinforced Concrete and Masonry Buildings, John Wiley and Sons, Inc., New York. View Article
[3] Adebar P., Mautrie., and DeVall R., 2005. Ductility of concrete walls: the Canadian seismic design provisions 1984 to 2004, Canadian Journal of Civil Engineering, 32: 1124-1137; View Article
[4] Boivin, Y., and Paultre, P. 2010. Seismic performance of a 12-storey ductile concrete shear wall system designed according to the 2005 National building code of Canada and the 2004 Canadian Standard Association standard A23.3. Canadian Journal of Civil Engineering, 37(1): 1-16. View Article
[5] Blakeley, R.W.G., Cooney, R.C., and Megget, L.M. 1975. Seismic shear loading at flexural capacity in cantilever wall structures. Bulletin of the New Zealand National Society for Earthquake Engineering, 8(4): 278-290.
[6] Boivin and Paultre, 2012. Seismic force demand on ductile reinforced concrete shear walls subjected to western North American ground motions: Part 1 – parametric study. Can. J. Civ. Eng. Vol. 39, 2012. View Article
[7] Filiatrault, A., D’Aronco, D., and Tinawi, R. 1994. Seismic shear demand of ductile cantilever walls: a Canadian code perspective. Canadian Journal of Civil Engineering, 21(3): 363-376. View Article
[8] Ghosh, S.K., and Markevicius, V.P. 1990. Design of Earthquake resistant shear walls to prevent shear failure. In Proceedings of Fourth U.S. National Conference of Earthquake Engineering, Palm Springs, Calif., 20-24 May 1990.
[9] Naumoski, N., Tso, W.K. and Heidebrecht A.C., 1998. A selection of representative strong motion earthquake records having different A/V ratios, Earthquake Engineering Research group, McMaster University, Hamilton, Canada.