International Journal of Civil Infrastructure (IJCI)
ISSN: 2563-8084

Volume 4 - Year 2021- Pages 100-108
DOI: 10.11159/ijci.2021.013
Role of Cap Thickness in Pile-Cap Foundation
Soukayna El Hammouli1, Adel Hanna2, Lan Lin3, Mahmoud Khalifa4
Concordia University, Department of Building, Civil and Environmental Engineering,
1455 de Maisonneuve Blvd, W., EV006.139, Montreal, QC H3G 1M8
1soukayna.elhammouli@gmail
2hanna@civil.concordia.ca
3lan.lin@concordia.ca
4khalifa.mahm@gmail.com
Abstract - The thickness of a pile cap is a governing parameter in the design of pile-cap foundations. A thin cap performs as a flexible slab distributing the load on the piles unevenly, which does not accord with the concept of pile foundation design. On the other hand, a thick cap performs as a rigid slab, which will evenly distribute the load on the piles, as well as resisting bending moments and punching shear, however, it may impose additional load on the piles due to its own weight. In view of these differences, there is a need to optimize the thickness of the cap in order to distribute the load evenly on the piles without. In this study, a 3-D numerical model was developed using ABAQUS to simulate a 16-pile cap foundation on soft soil and on dense sand. The cap thickness was examined for a range of 0.5m to 3m. Furthermore, effects of pile spacing, pile diameter, and pile length on the performance of pile-cap foundation were examined.
Keywords: Cap thickness, Rigid, ABAQUS, Pile, Curvature.
© Copyright 2021 Authors - This is an Open Access article published under the Creative Commons Attribution License terms. Unrestricted use, distribution, and reproduction in any medium are permitted, provided the original work is properly cited.
Date Received: 2020-12-21
Date Accepted: 2020-12-23
Date Published: 2021-04-16
1. Introduction
In pile foundations, the cap is regarded as rigid enough if all the piles are equally loaded. However, if the cap is flexible, then the piles close to the loading point would be over-loaded as compared to others piles in the group. In the literature, studies have confirmed that pile cap thickness has a direct impact on the pile cap flexural rigidity, which will, in turn, affect the loads transferred to the piles. Researchers have developed formulae to determine the rigidity of the pile cap, such as [1] to [3]. Recently, Rabbany et al. [4] proposed an equation to estimate pile cap thickness for the given external loads. However, the results were based on a regression analysis on limited data generated about 30 years ago [5].
There are two methods stipulated in the Canadian Concrete Design Standards [6] for the design of pile caps; one is sectional method for shallow pile caps, and the other is Strut-and-Tie (STM) method for deep pile caps. Both methods follow the same procedure to determine the cap thickness, which satisfy the requirements for both one-way and two-way shear. However, in both cases the shear is determined by assuming the reaction of each pile due to the external load is obtained by using the total load applied on the cap divided by the number of piles. This assumption is not valid for flexible caps, which may lead to the foundation either unsafe or overdesigned. Given this, the objective of this study was to examine the effects of pile cap thickness on the performance of a pile foundation in terms of the load distribution on piles and the deformation of pile cap. More specifically, Phase I of the study focused on the investigation the performance of cap for a variety of thickness, while Phase II examined the effects of the pile foundation geometry, such as pile spacing, pile diameter, and pile length on the performance of the pile-cap foundation.
2. Numerical Modelling
2. 1. Description of the foundation
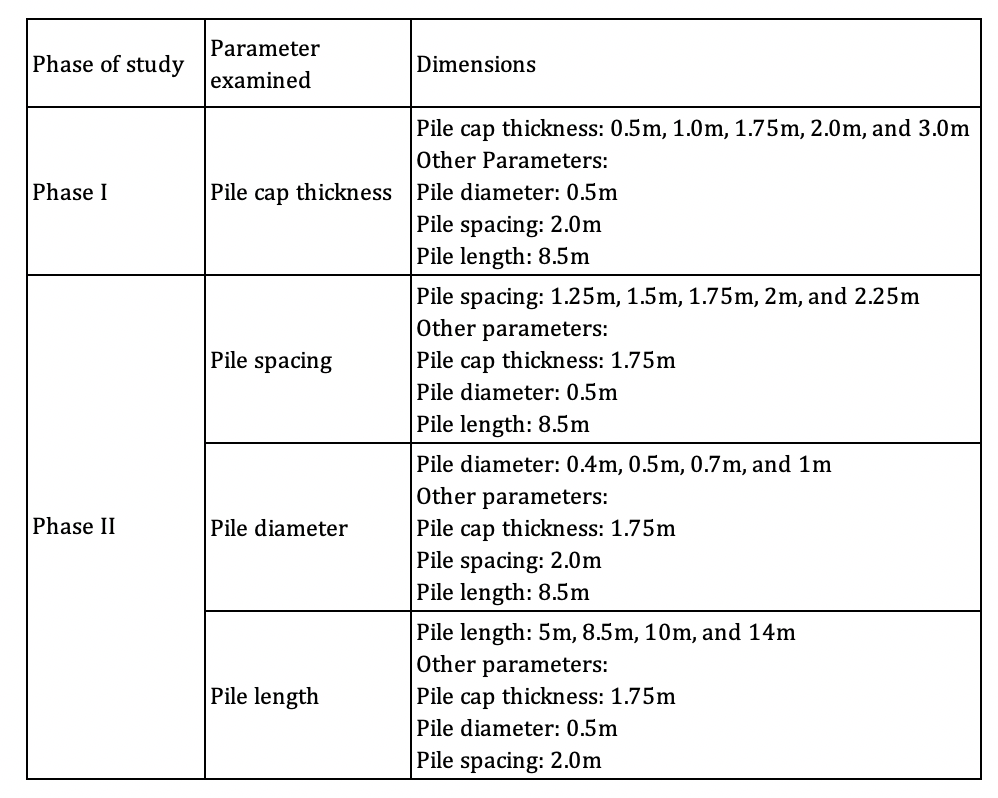
Figure 1 illustrates the configuration of the foundation under examination. An 8 x 8m square concrete cap was used in the analysis. In phase I of the study, the thickness of the pile cap “t” varied from 0.5m to 3.0m. As illustrated in Fig. 1, concrete piles are 0.5m in diameter and 8.5m in length. The center-to-center spacing of piles is 2.5m. It should be noted that, in Phase II of the study, the pile thickness remained constant, while pile diameter, pile length, and pile spacing became variable. Table 1 presents a summary of the parameters used in the analysis.
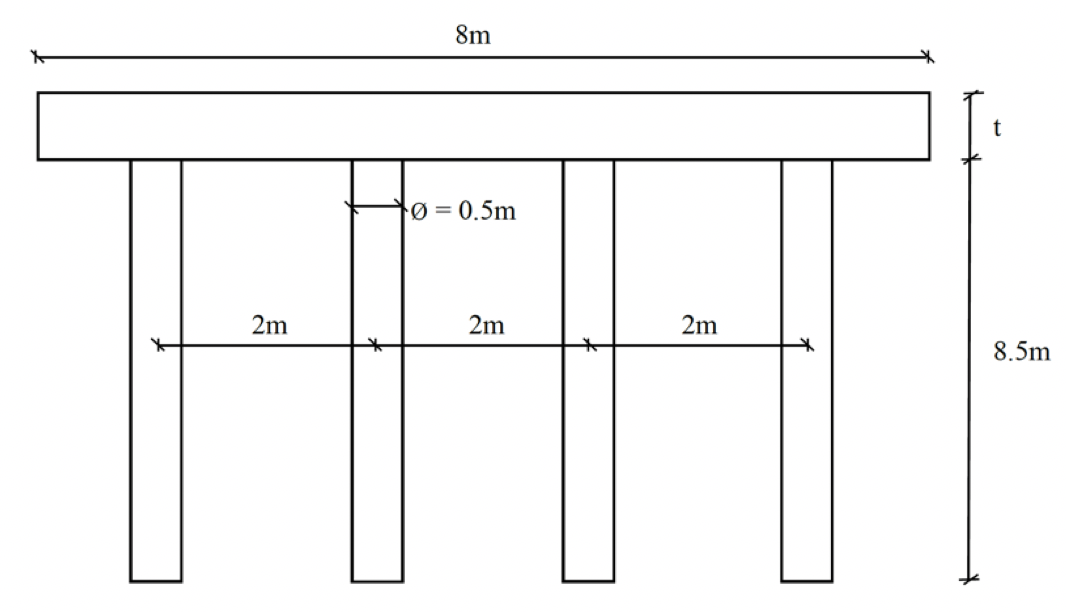
Table 1. Quantity of foundation parameters considered.
2. 2. Modelling techniques
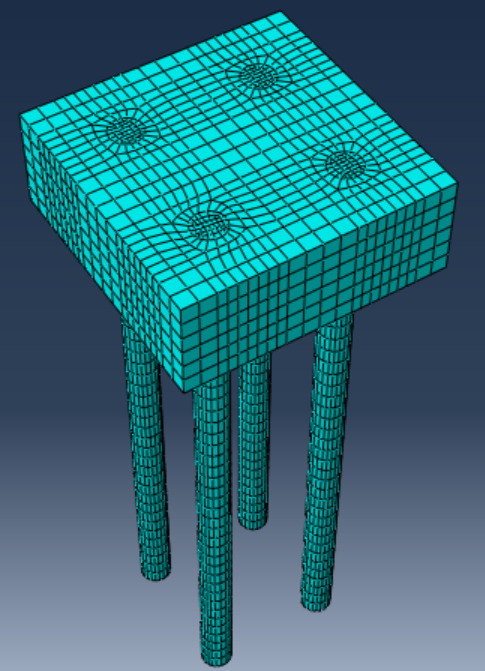
A 3-D finite element model was developed using commercial software ABAQUS to simulate the performance of the foundation. Given the symmetry of the structure, only a quarter of the foundation was modeled (Fig. 2).
2.2.1 Piles and pile cap
The two elements were model using ABAQUS 3D deformable homogeneous solid element C3D8 (i.e., Continuum, 3-D, 8-node). Full integration instead of reduced integration was assigned to these elements. This decision was made due to the results of the preliminary study in which the reduced integration did not provide accurate displacements of the pile cap.
2.2.2 Soils
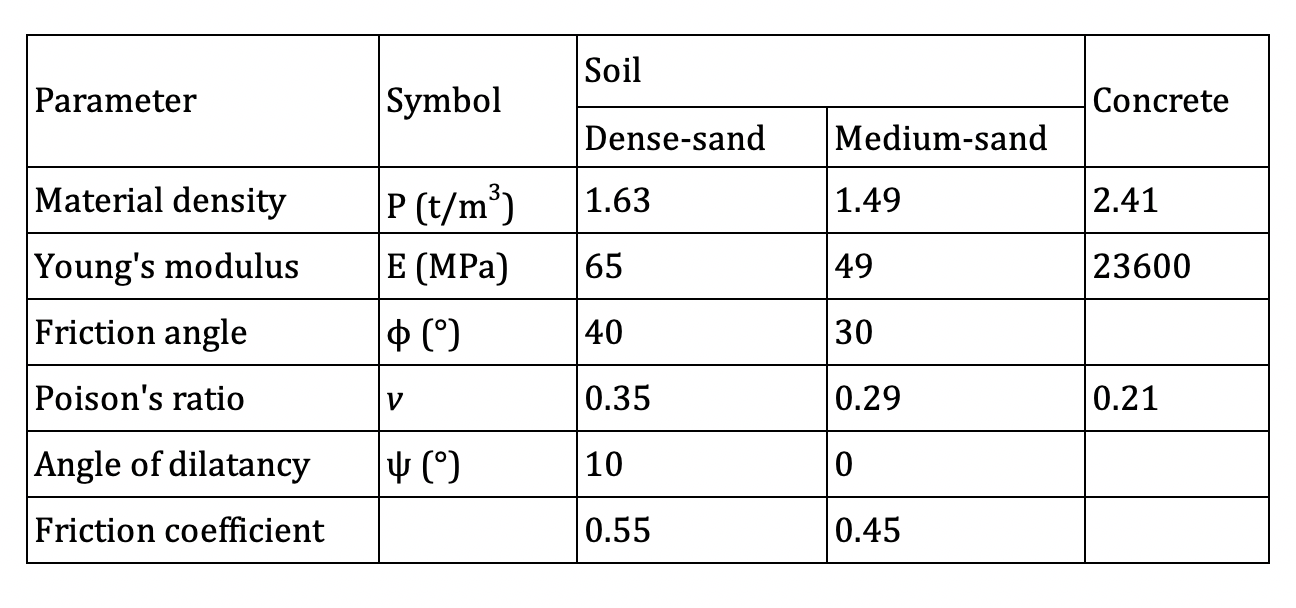
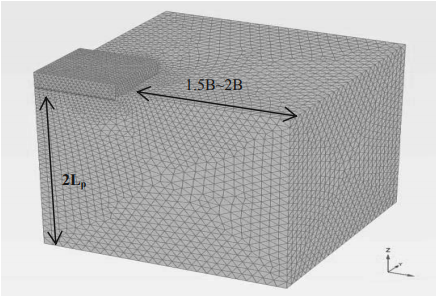
The soil layer was modelled as an elastic-plastic constitutive model following the Mohr-Coulomb yield criterion. The soil continuum was represented by a single layer of sand where the width was 10m and the length was 17m. Specifically, the entire width of the soil was taken as 2.5 times the width (8m) of the pile cap and the length was taken as 2 times the pile length of 8.5m. Table 2 provides the material properties for the soil used for modelling. It is necessary to mention that two soil mediums, i.e., dense sand and medium sand, were examined in the study.
Table 2. Material properties.
2.2.3 Interactions and contact zones
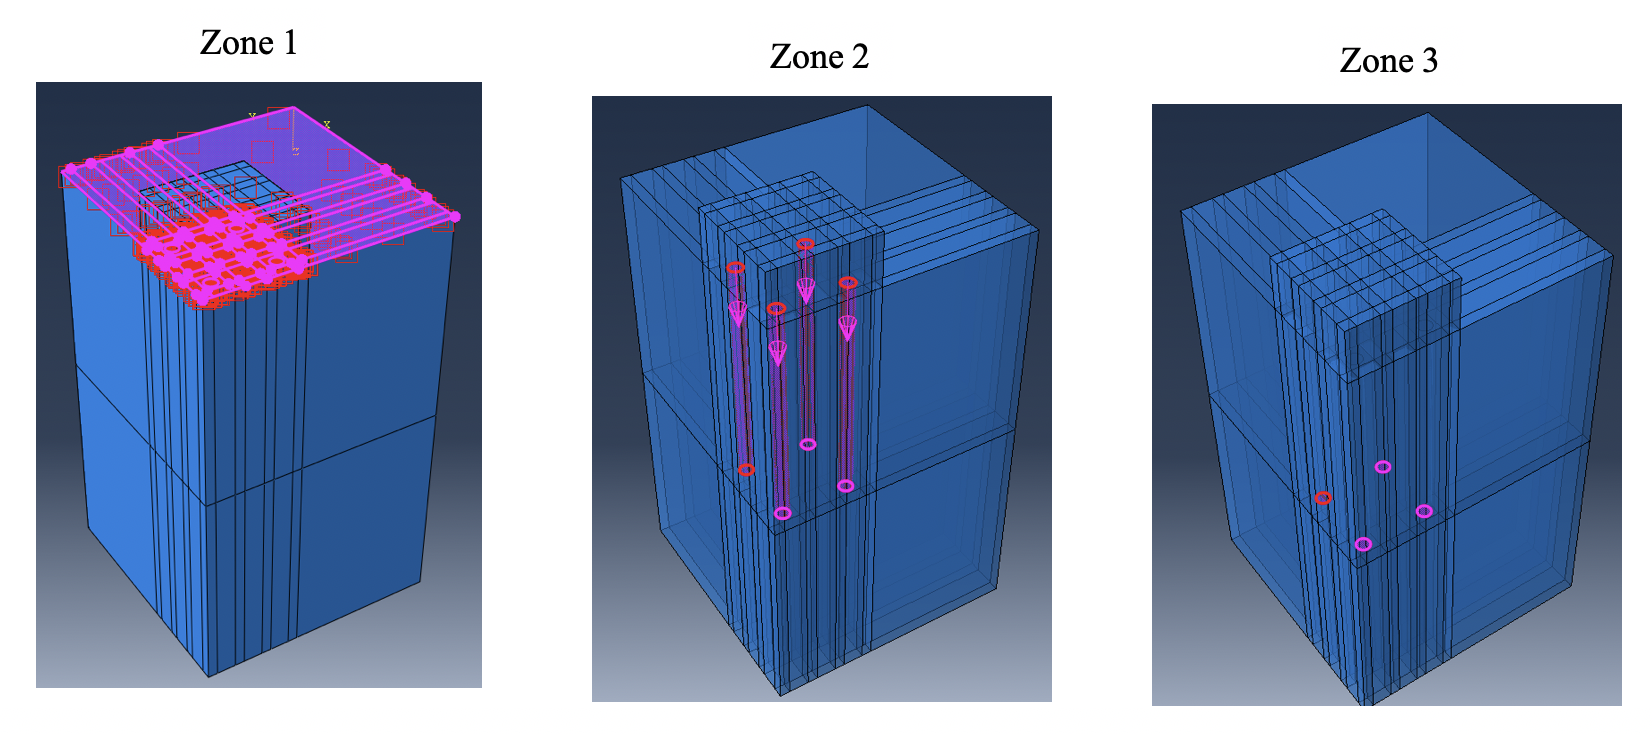
In this study, three contact zones were defined in ABAQUS to simulate the interaction between pile cap and soil (Zone 1), pile circumference and soil (Zone 2), pile tip and soil (Zone 3) as illustrated in Fig. 3. Using slave-master concept, all the three zones were simulated with surface-to-surface interaction, in which the nodes of soil elements were defined as Slave (Red color in Fig. 3) while the nodes of pile cap and piles were defined as Master (Pink color in Fig. 3).
Furthermore, the contact zone was assigned by either friction contact (Type I) or frictionless contact (Type II) depending on the expected behavior of the zone. In particular, Type I contact was assigned to Zone 1 and Zone 2 as hard normal behavior and tangential behavior with a Penalty method instead of Lagrange method because of its simplicity, good convergence, and less computation time. Type II contact was assigned to Zone 3 using tangential behavior (Frictionless) and hard normal behavior.
2.2.4 Meshing and Boundary conditions
As stipulated in ABAQUS, the model was partitioned first as an assembly before meshing. In the modelling, the partitions were placed closer to the foundation than the rest of the soil in order to create finer elements around that area. In addition, the partitions were distanced equally around the pile to have uniform meshing for all the piles.
There are two options for meshing available in ABAQUS, i.e., structured meshing and sweep meshing. Specifically, the structured meshing is applied for high quality hexahedral to improve the modelling quality of the shell elements required on solids or surfaces. The sweep meshing is used when hexahedral elements are required on solids with minimal geometry editing. Both meshing techniques were used to mesh the model given the advantages of each. The green region shown in Fig. 4 was meshed using the structured meshing and the yellow regions was meshed using the sweep meshing. Figure 5 illustrates the meshed model of a quarter of the foundation in which the total number of meshed elements is about 54400.
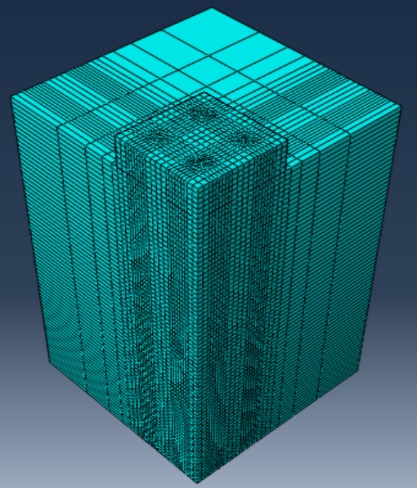
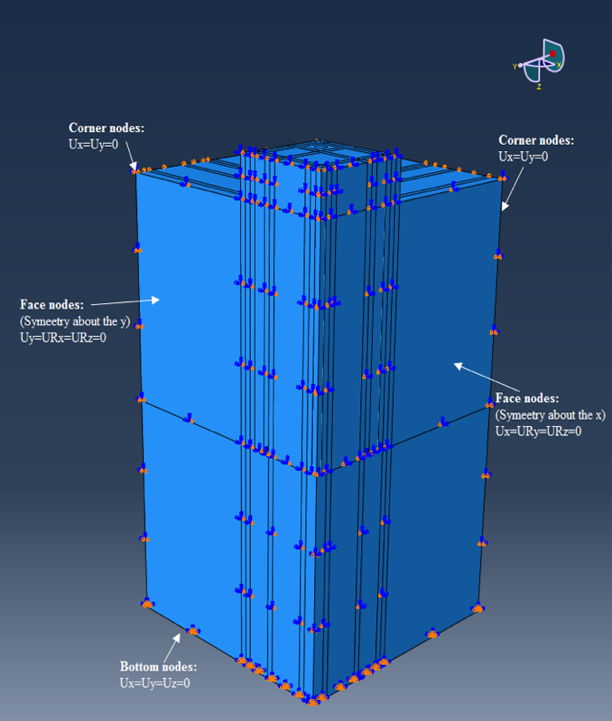
Figure 6 presents the boundary conditions defined in the model. In the coordinate system, the positive direction for the vertical axis Z is downward, the positive direction for horizontal axes X and Y follows the well-known right-hand thumb rule. The restraints for the face nodes, corner nodes, and bottom nodes are assigned to translation (U) and rotation (UR) about the given axes. A detailed description of the modelling can be found in [7].
3. Modal Validation
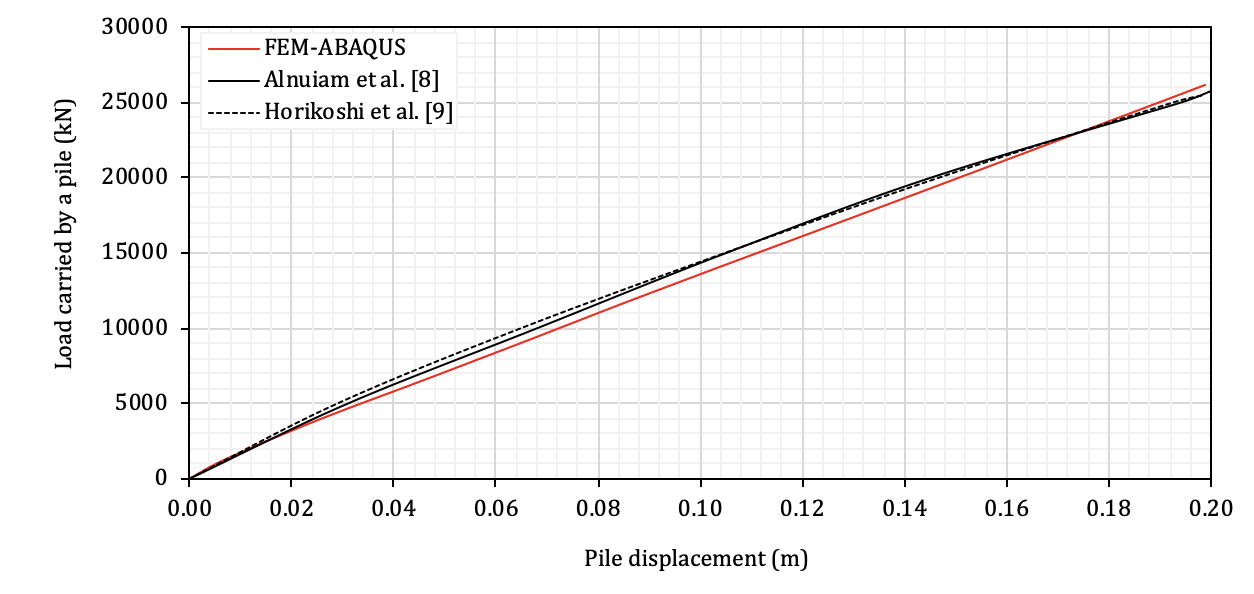
In order to validate the above-mentioned techniques of developing the numerical model in this study, the results presented in Alnuiam et al. [8] and the data collected from the geotechnical centrifuge testing available in Horikoshi et al. [9] were used for model validation. Alnuiam et al. used software Plaxis to create a 3D finite element model (Fig. 7) with a configuration very similar to the one to be examined in the current study (Fig. 4).
In the process of validation, a 3D ABAQUS model was developed for the pile foundation examined by Alnuiam et al. as shown in Fig. 7 following the modelling techniques described in the previous section. For ease of discussion, this model is referred to as FEM. Figure 8 presents the results of the displacement of the pile cap versus the axial load from FEM superimposed with the results given in [8] (referred as ALN) and [9] (Referred as HOR). It can be seen in Fig. 8 that the FEM results are in good agreement with HOR and ALN. For example, at the load of 5000kN, the displacement given by FEM is about 0.032m while the displacement provided by both HOR and ALN is about 0.029m and 0.031m, respectively; at the load of 15000kN, the displacement given by FEM is about 0.11m while the displacement provided by HOR and ALN is the same, which is about 0.105m.
Furthermore, the loads carried by piles from FEM were compared with those provided in [8] for the case with the pile cap thickness of 2m and the ratio of pile spacing to pile diameter of 4, the results are shown in Fig. 9. In the figure, the vertical axis represents the percentage of the loads carried by the group of piles, and the horizontal axis represents the displacement of the pile cap normalized to its total displacement. It can be seen in Fig. 9 that the two curves follow the same profile.
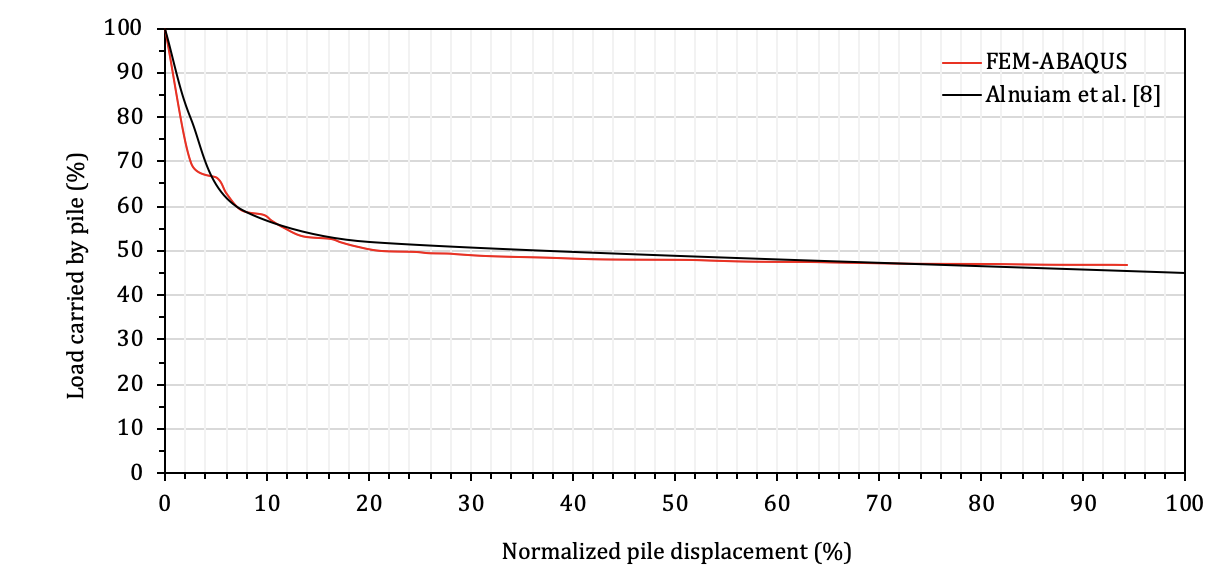
It is also noted that, at initial displacement, the load is carried by piles only due to lack of intimate contact between the pile cap and the soil. However, as the displacement increases, the load carried by piles drops rapidly. For example, at the displacement of 7%, the percentage of the load carried by piles is 60% for ALN and 62% for FEM while at the 80% of the displacement, ALN shows that 45% of the load is taken by piles, FEM shows 47% of the load is carried by piles.
The results presented in Figs. 8 and 9 confirmed the modelling techniques used to develop the numerical model in this study.
4. Phase I Analysis Results
In the analysis, a working load of 200MN was applied in the vertical direction downward at the center of the pile cap to produce higher deflections and deformations in both cap and piles as compared to uniformly distributed vertical load. The structural response parameters selected to examine the performance of the foundation are: pile load carried by each individual pile, and pile cap displacement in the vertical direction at selected points measured at the bottom face of the cap. Figure 10 presents the ultimate load of each pile for different pile cap thickness varied from 0.5m to 3m for medium sand soil and dense sand soil. It can be seen in the figure that, for the thickness of 0.5m, Pile 2 carries the largest amount of the load followed by Piles 1 and 4 while Pile 3 carries the least. This observation is not surprising from a structural point of view as the piles close to the loading point (center piles, e.g., Pile 2) would carry more load while the piles far from the load (corner piles, e.g., Pile 3) would carry less load. More specifically, for cap thickness of 0.5m, the load resisted by Pile 2 (maximum) is 3.7 times that by Pile 3 (minimum) for medium sand and 4.4 times for dense sand.
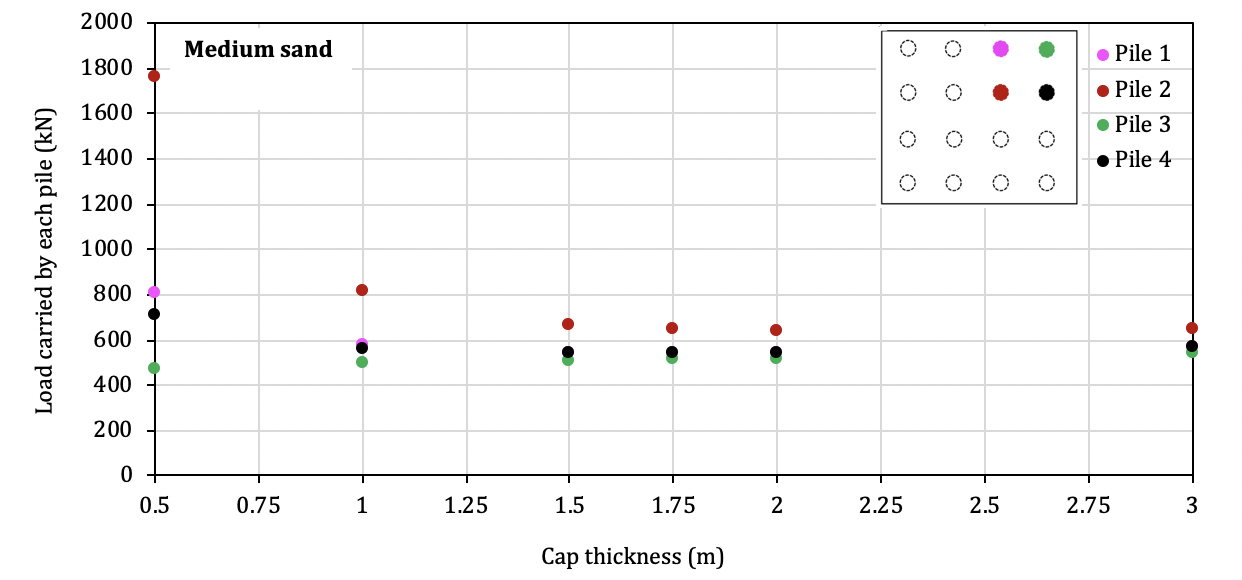
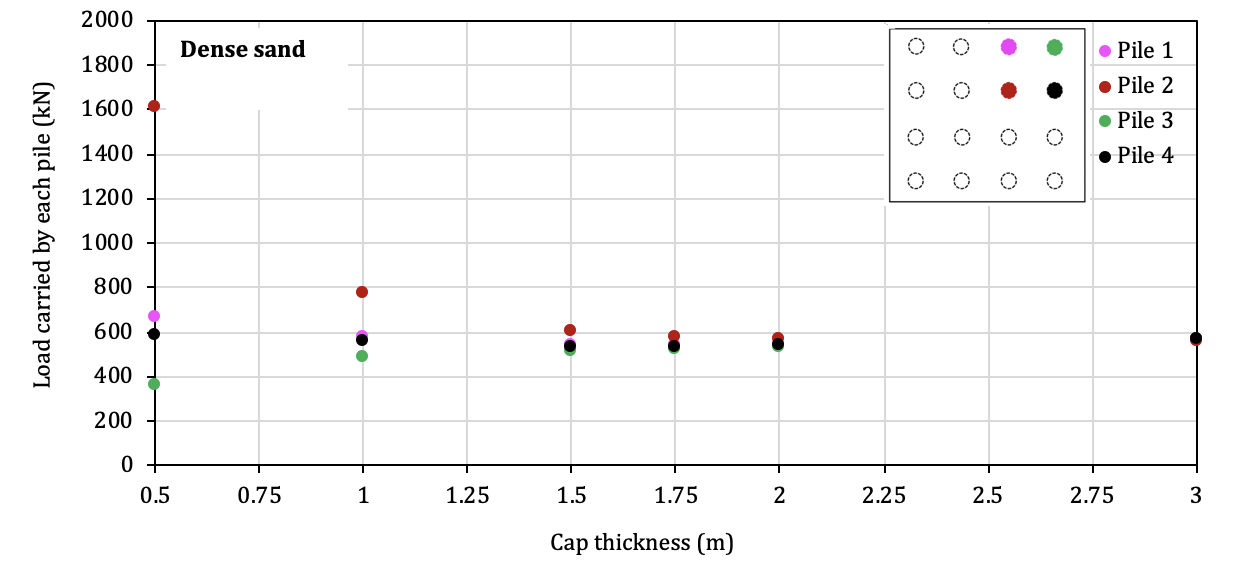
Furthermore, as illustrated in Fig. 10 when the thickness is increased to 1m, this ratio reduces dramatically reaching around 1.6 for both soil mediums considered. When the thickness is between 1.5m and 2m this ratio becomes much smaller, i.e., about 1.3 for medium sand and 1.1 for dense sand. As presented in Fig. 9, in dense sand soil, all 4 piles carry the same load at the thickness of 3m while, in the medium sand soil, Pile 2 carries about 20% more load than the other three piles. It is worth noting that once the cap thickness is 1m and greater, the load distributed to Piles 1, 3 and 4 is almost the same.
In addition to examining the load carried by each individual pile, the deformation of the pile cap for different cap thickness was evaluated in this study.
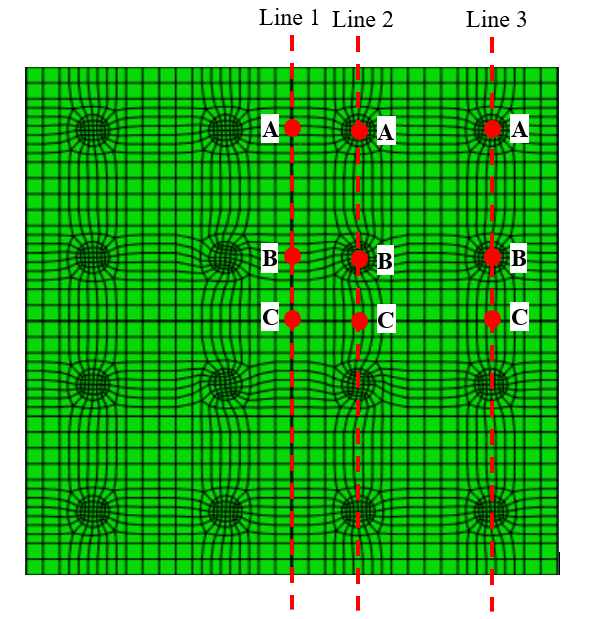
Figure 11 presents the location of the selected points which were monitored in this study and figure 2 presents the deformation of these points corresponding to the cap thickness of 0.5m and 3m for both the medium and dense sand soil. It can be seen clearly in Fig. 12 that, for the cap thickness of 3m, the points monitored undergo the same amount of deformation.
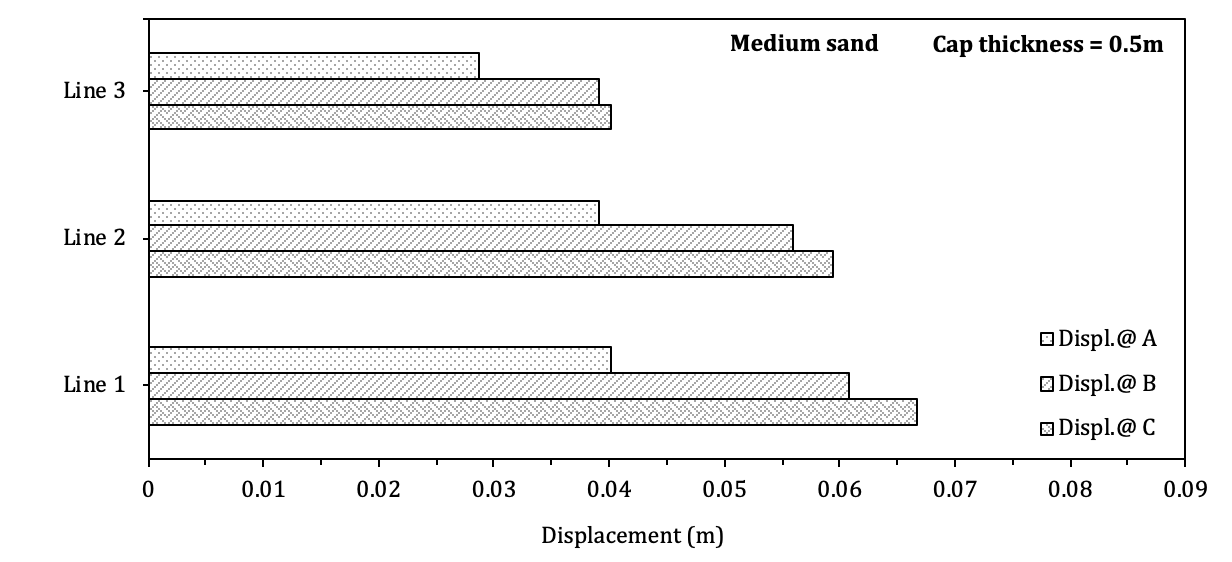
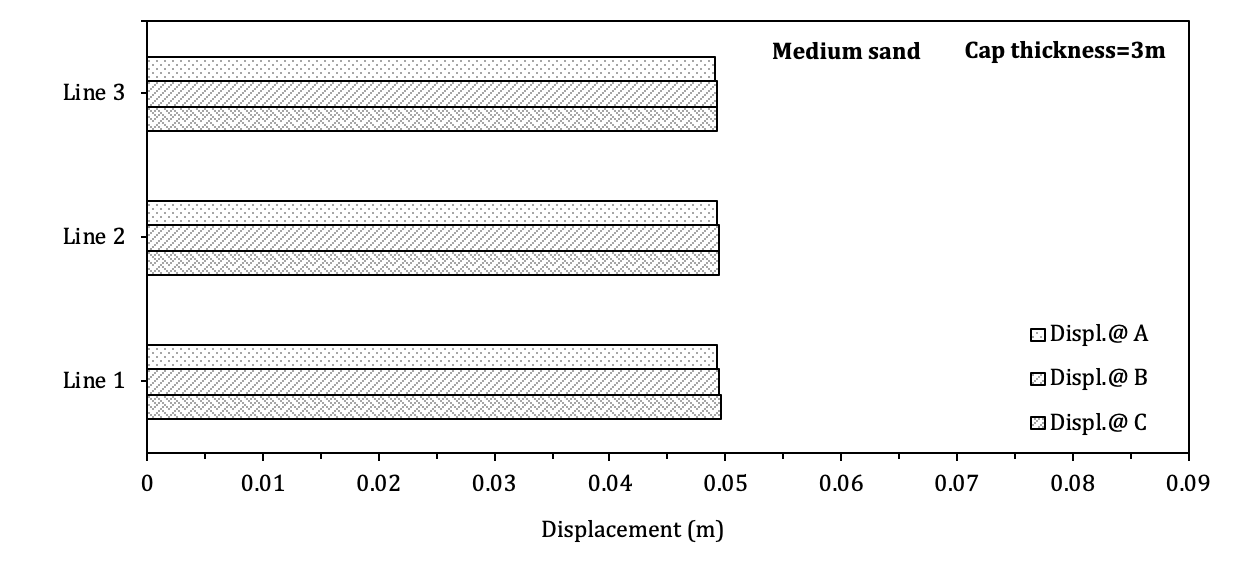
However, for the cap thickness of 0.5m, the center of the cap (Line 1) close to the loading point deforms more than the edge (Line 3). This indicates that the 3m-deep cap is more rigid than the 0.5m-deep cap, which is consistent with the findings of the results shown in Fig. 10. It is also observed in Fig. 12 that for the cap thickness of 0.5m, the deflection at point C is much greater than Point A. Such a tendency is well expected in a flexible slab.
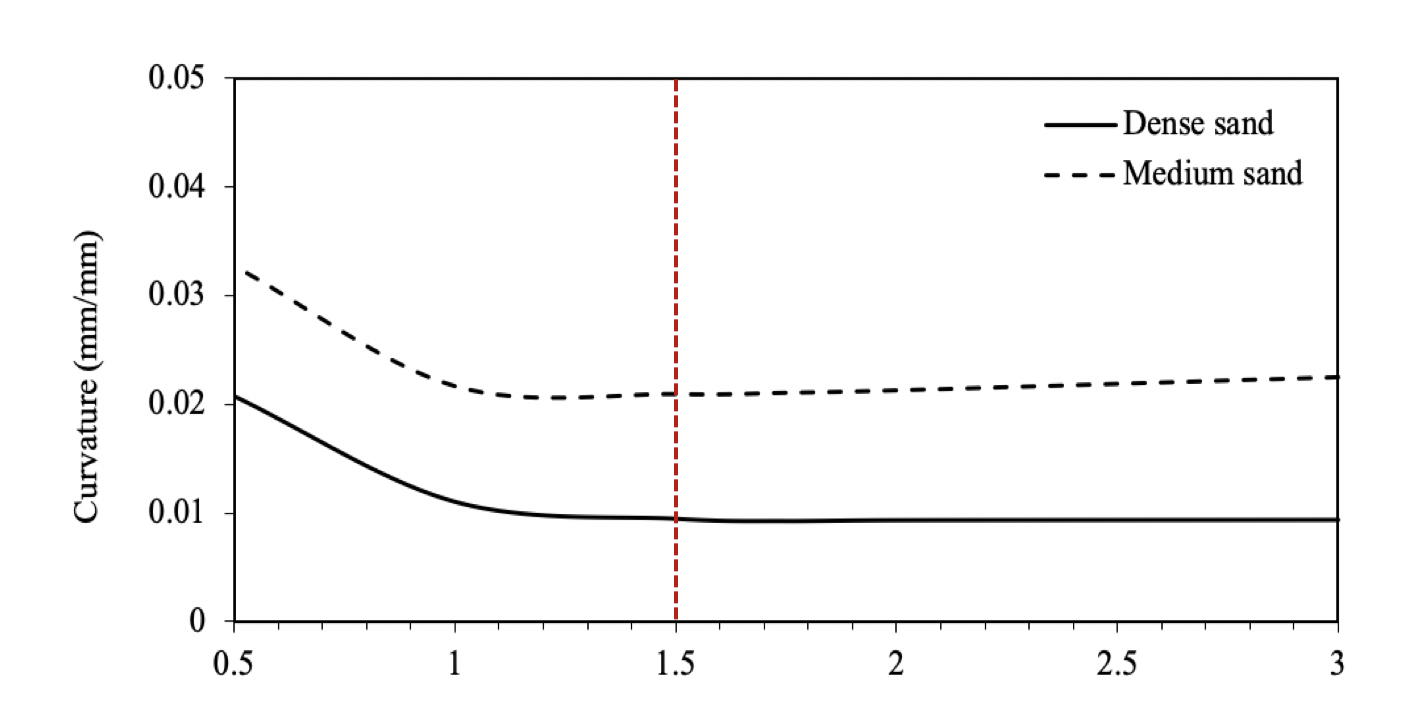
In order to identify the cap thickness, which behaves as rigid, the cap curvature versus the cap thickness (Fig. 13) was plotted following the approach given in [11]. Cheng [11] investigated the depth of reinforced concrete rigid pile caps for tall buildings using 3-D finite element analysis. He recommended to use the cap curvature to examine the rigidity of caps. A pile-cap would be considered as rigid if a further increase in its thickness will not lead to a significant reduction of the cap curvature. The so-called curvature is determined by the cap out-of-plane deflection divided by the pile spacing. Among the five values of the thickness tested, 1.5m would be considered a threshold between a flexible and a rigid cap. In addition, the results of the curvature corresponding to the thickness of 0.5m and 1.0m indicate that these two caps are flexible as compared to others, which is consistent with the findings observed in Figs. 10 and 12.
5. Phase II Analysis Results
Phase II of the study was to examine the effects of the pile spacing, pile length, and pile diameter on the rigidity of the cap. For this purpose, the cap thickness was set to 1.75m based on the finding of Phase I study.
5. 1. Effect of pile spacing
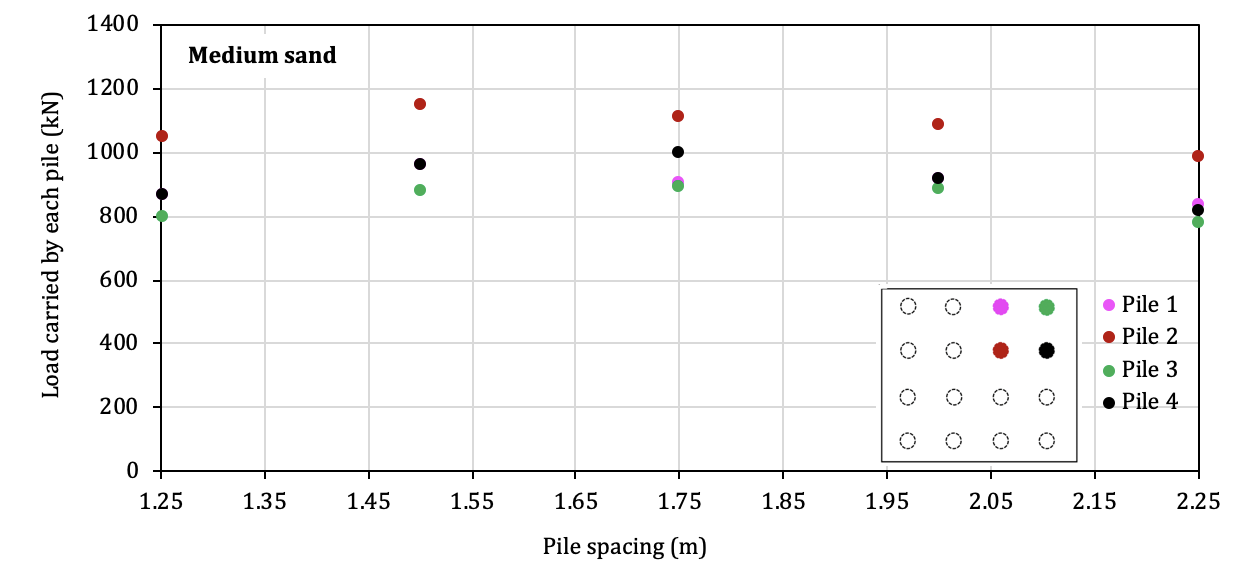
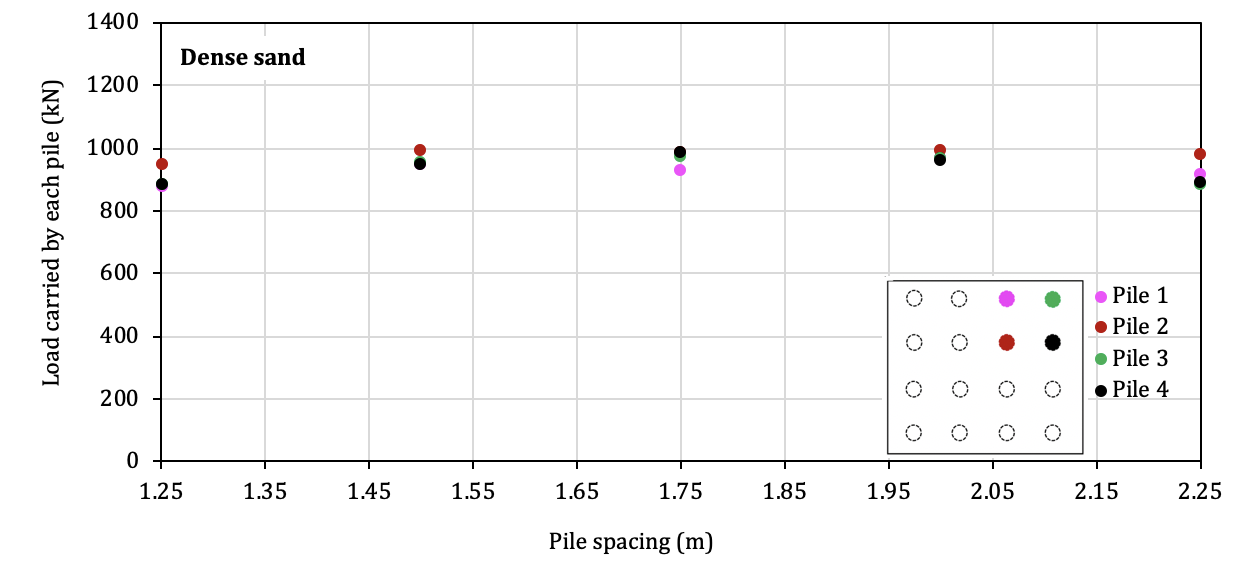
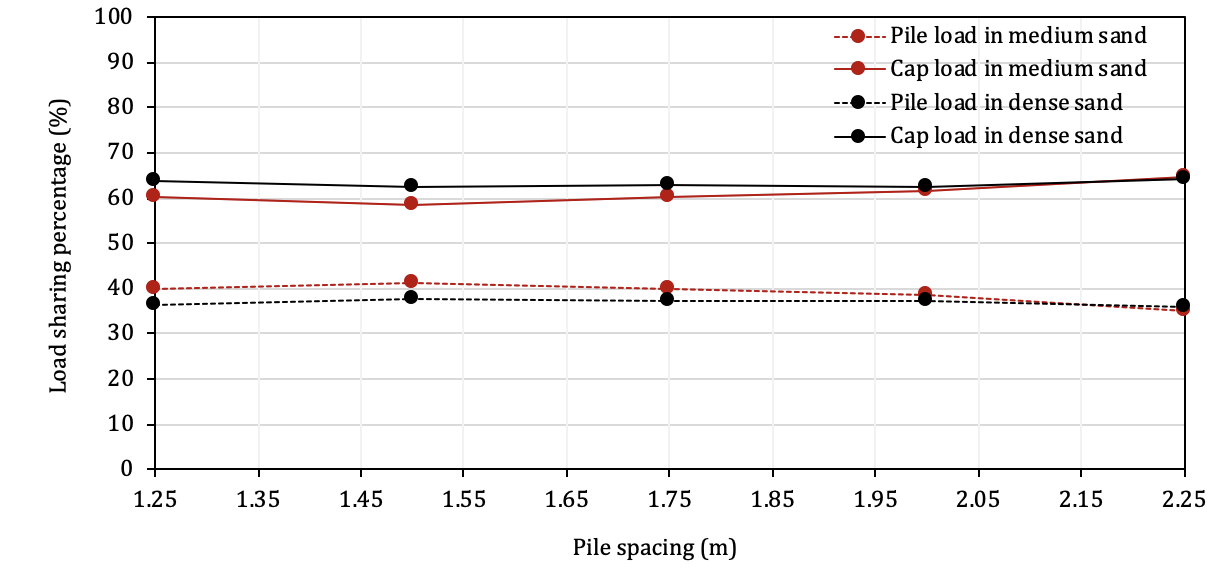
The load carried by each individual pile for a pile spacing varied from 1.25m to 2.25m, for medium sand and dense sand was determined, and the results are presented in Fig. 14. As illustrated in the figure there is a greater deal of variation on the resistance among the 5 pile spacings tested in the medium sand than in the dense sand. In particular, for the medium sand soil, the ratio of the maximum to the minimum pile resistance for the five cases considered was around 1.3 while for the dense sand this ratio was about 1.1. The results of the load sharing between piles and pile-cap are shown in Fig. 15. It is of interest to note that the load sharing percentage does not change with the pile spacing namely, the load carried by the pile cap is about 60% for both soil mediums examined.
5. 2. Effect of pile diameter
The diameters examined are 0.4m, 0.5m, 0.7m, and 1.0m. The load resistance developed in each pile associated with different pile diameters is presented in Fig. 16 for medium sand and dense sand. Among the 4 diameters considered, pile diameter of 0.5m leads to the smallest difference in the load among the four piles which is also the case for the dense sand. Compare with a wider distribution of the resistance in the piles in the medium sand, the resistance developed in each pile in the dense sand is very close. Although it is noted that for the diameter of 1m, the resistance provided by Pile 2 is relatively higher than that by the other three piles, the difference is not very significant. It is worth mentioning that the resistance developed in the piles is linearly increases with the increase of the pile diameter as illustrated in Fig. 16. This is due to the fact that the axial stiffness of the pile is linearly proportional to its diameter.
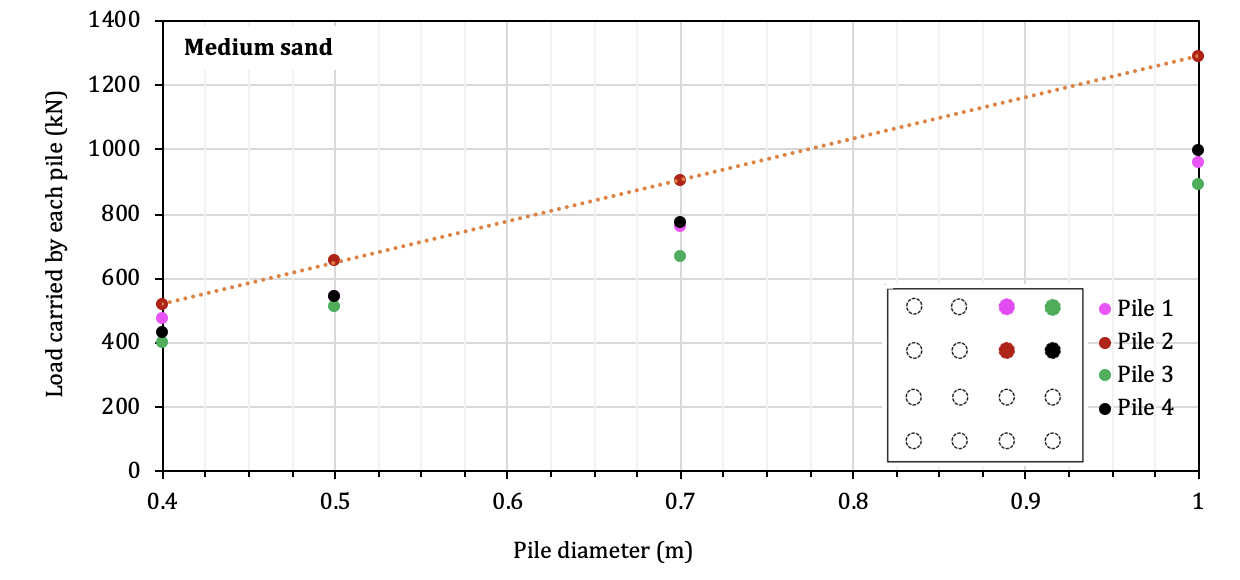
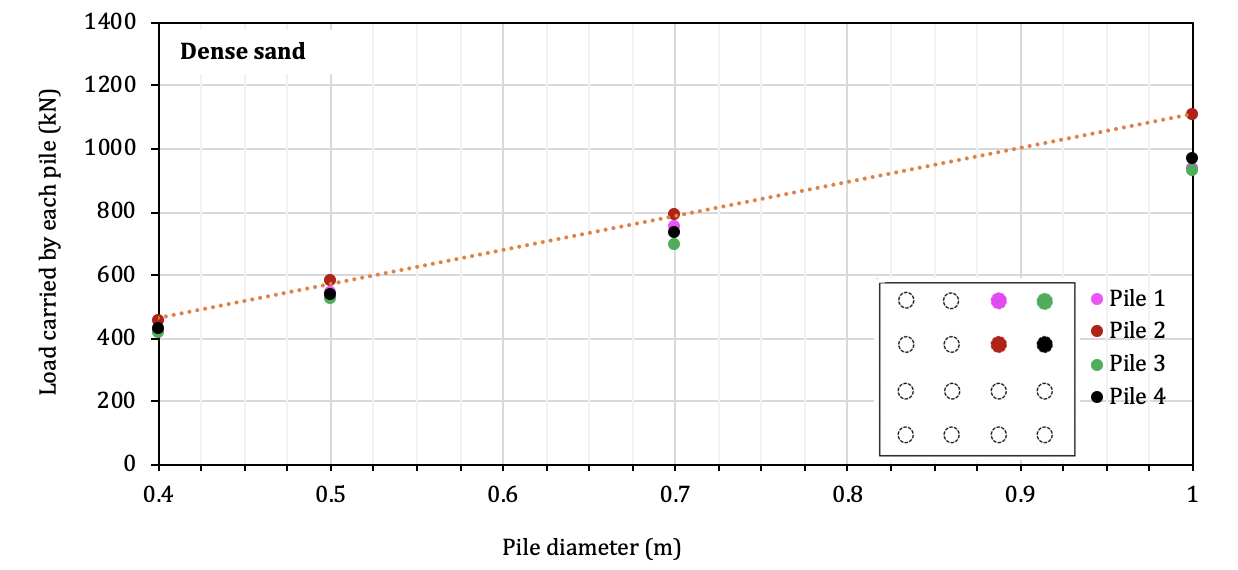
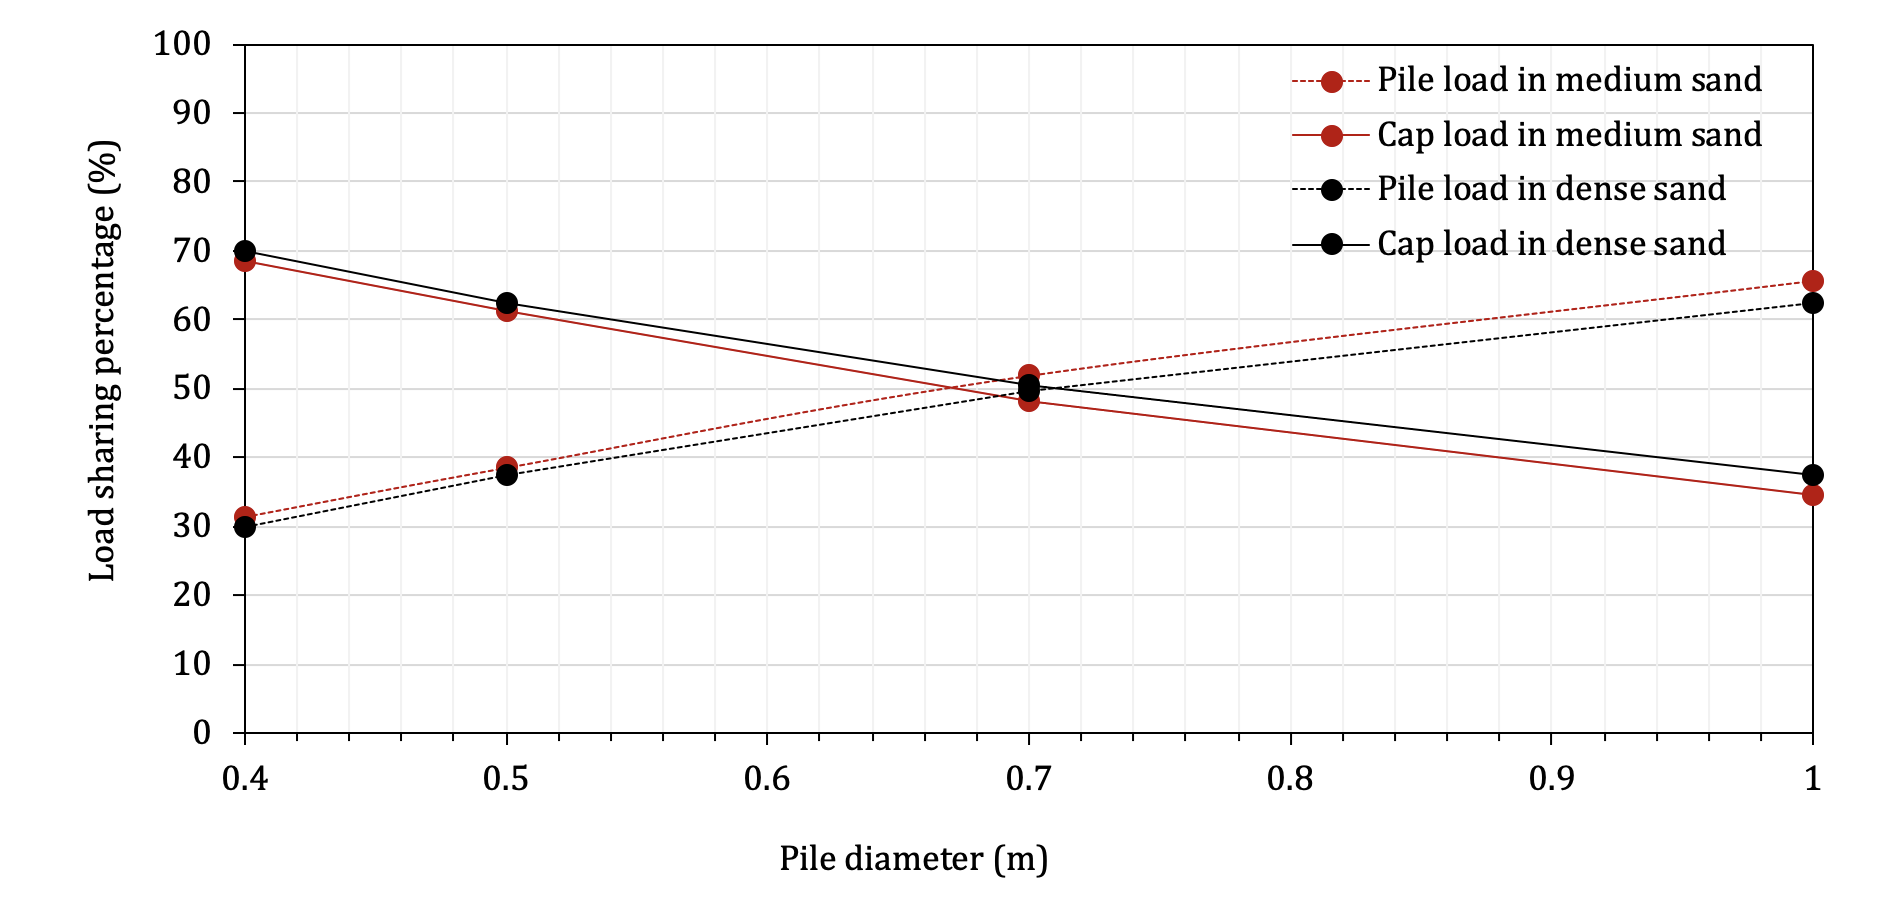
Figure 17 presents the results of the load sharing between piles and pile-cap associated with different pile diameter. It is interesting to observe in the figure that the percentage of the load sharing changes linearly with the increase of the pile diameter. More specifically, at the pile diameter smaller than 0.7m, most of the load is carried by the pile cap; at the diameter of 0.7m, piles and pie cap share the same amount of the load. However, when the diameter becomes larger than 0.7m, the group of piles carries most of the load. For example, at the diameter of 1m, 80% of the load is taken by the piles and only 20% of the load is taken by the pile cap. Such a significant difference in the load sharing between the two components might not be appreciated for the design purpose, i.e., the cap would be designed for a little load while piles would be designed for a heavy load.
5. 3. Effect of pile length
The pile length considered in the investigation of its effect on the performance of the foundation is 5m, 8.5m, 10m, and 14m. Figure 18 presents the resistance of individual piles versus the pile length. It can be seen in Fig. 18 that, for the medium sand, the resistance of Pile 2 is larger as compared to that of Piles 1, 3, and 4. More specifically, the ratio of the resistance in Pile 2 (maximum resistance) to that in Pile 3 (minimum resistance) ranges from about 1.15 for the pile length of 5m to 1.40 for the pile length of 14m. However, for the dense sand soil, the resistance generated in Pile 2 is not much different from that in Piles 1, 3 and 4 like observed in the results for the medium sand soil. Instead, the resistance developed in Pile 2 is about 10% higher than in the other three piles. Considering such a small difference in the results, the load distribution among the piles can be regarded as uniformly distributed from an engineering point of view.
Furthermore, it can be noted that the resistance in Pile 2 (i.e., center pile) increases linearly with the increasing of the pile length. However, this increase grows much faster in the dense sand than in the medium sand. In addition, it was found in the study that the difference in the load resistance decreased with the increasing of the pile length. It indicates that a larger pile length helps to achieve even load distribution among the larger piles.
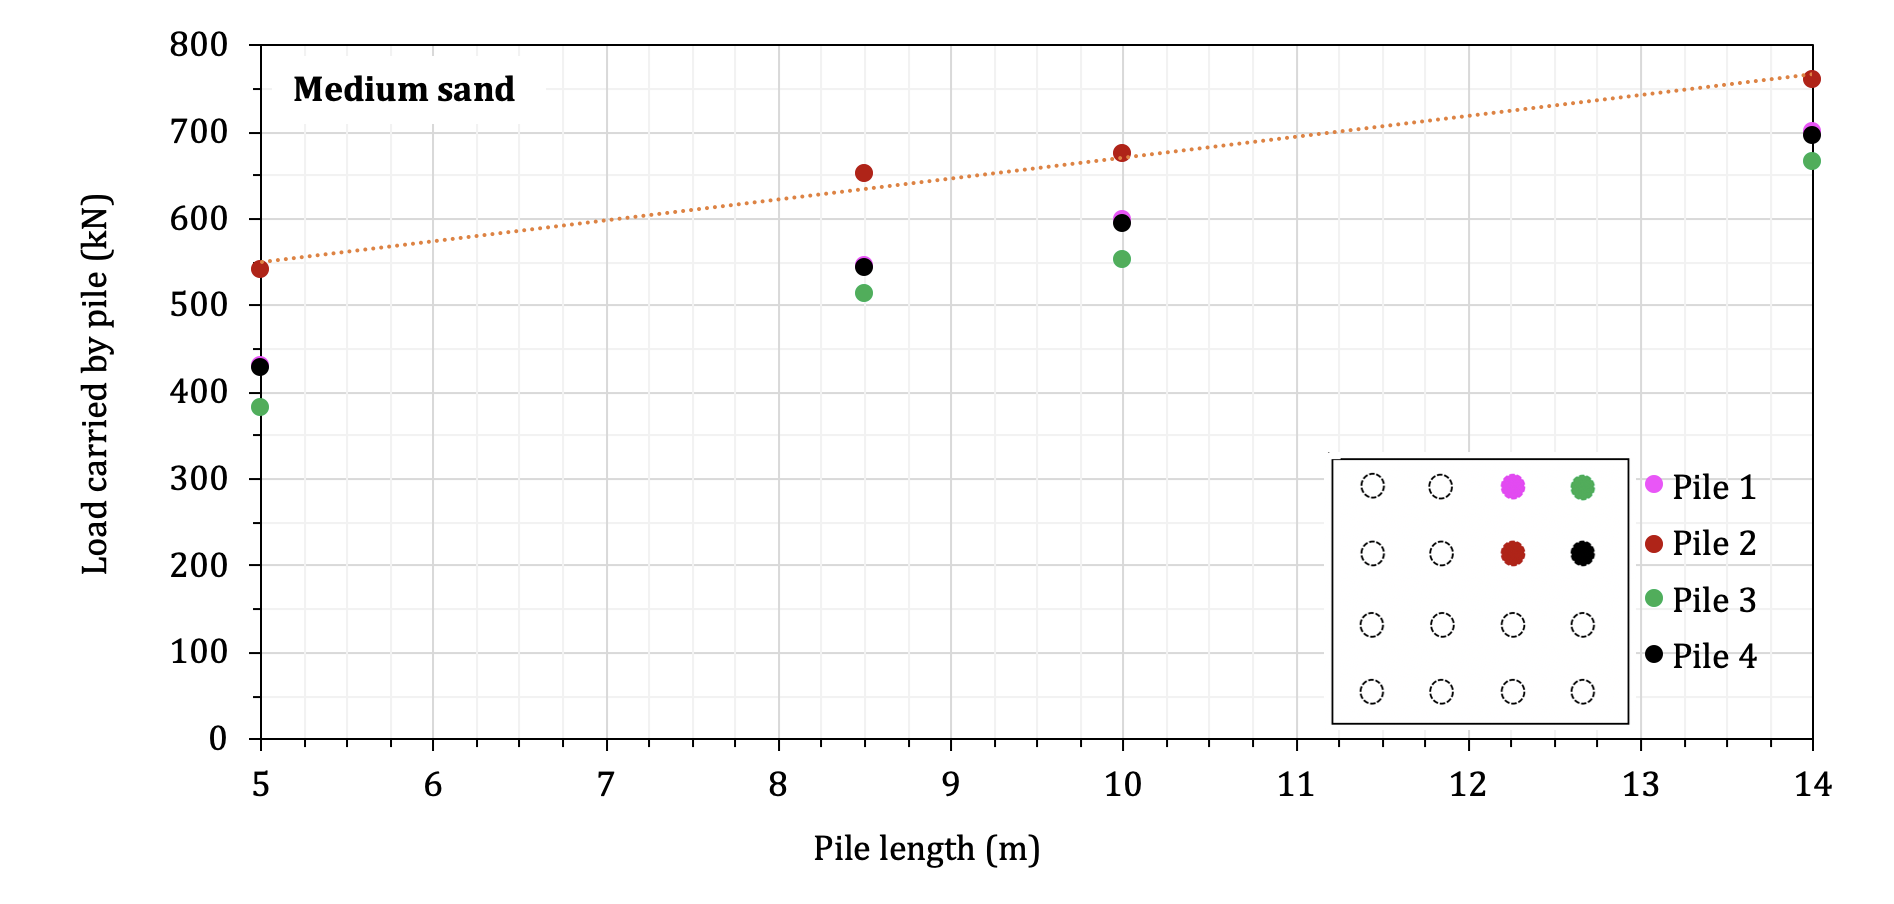
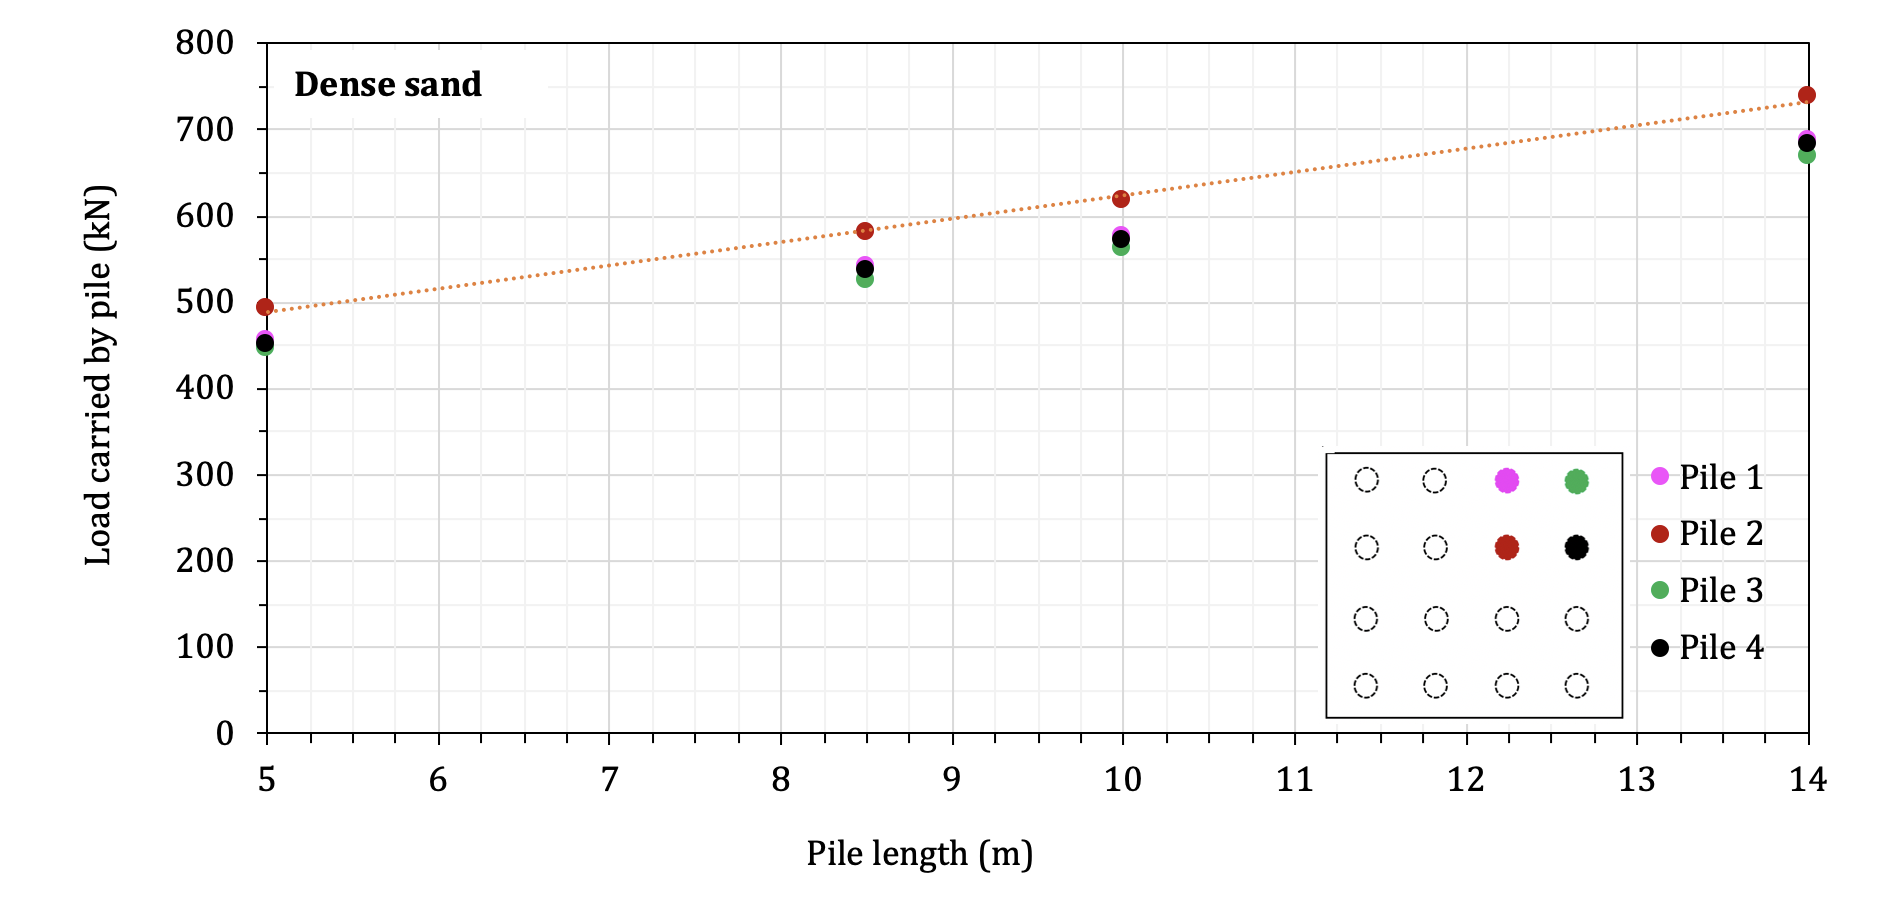
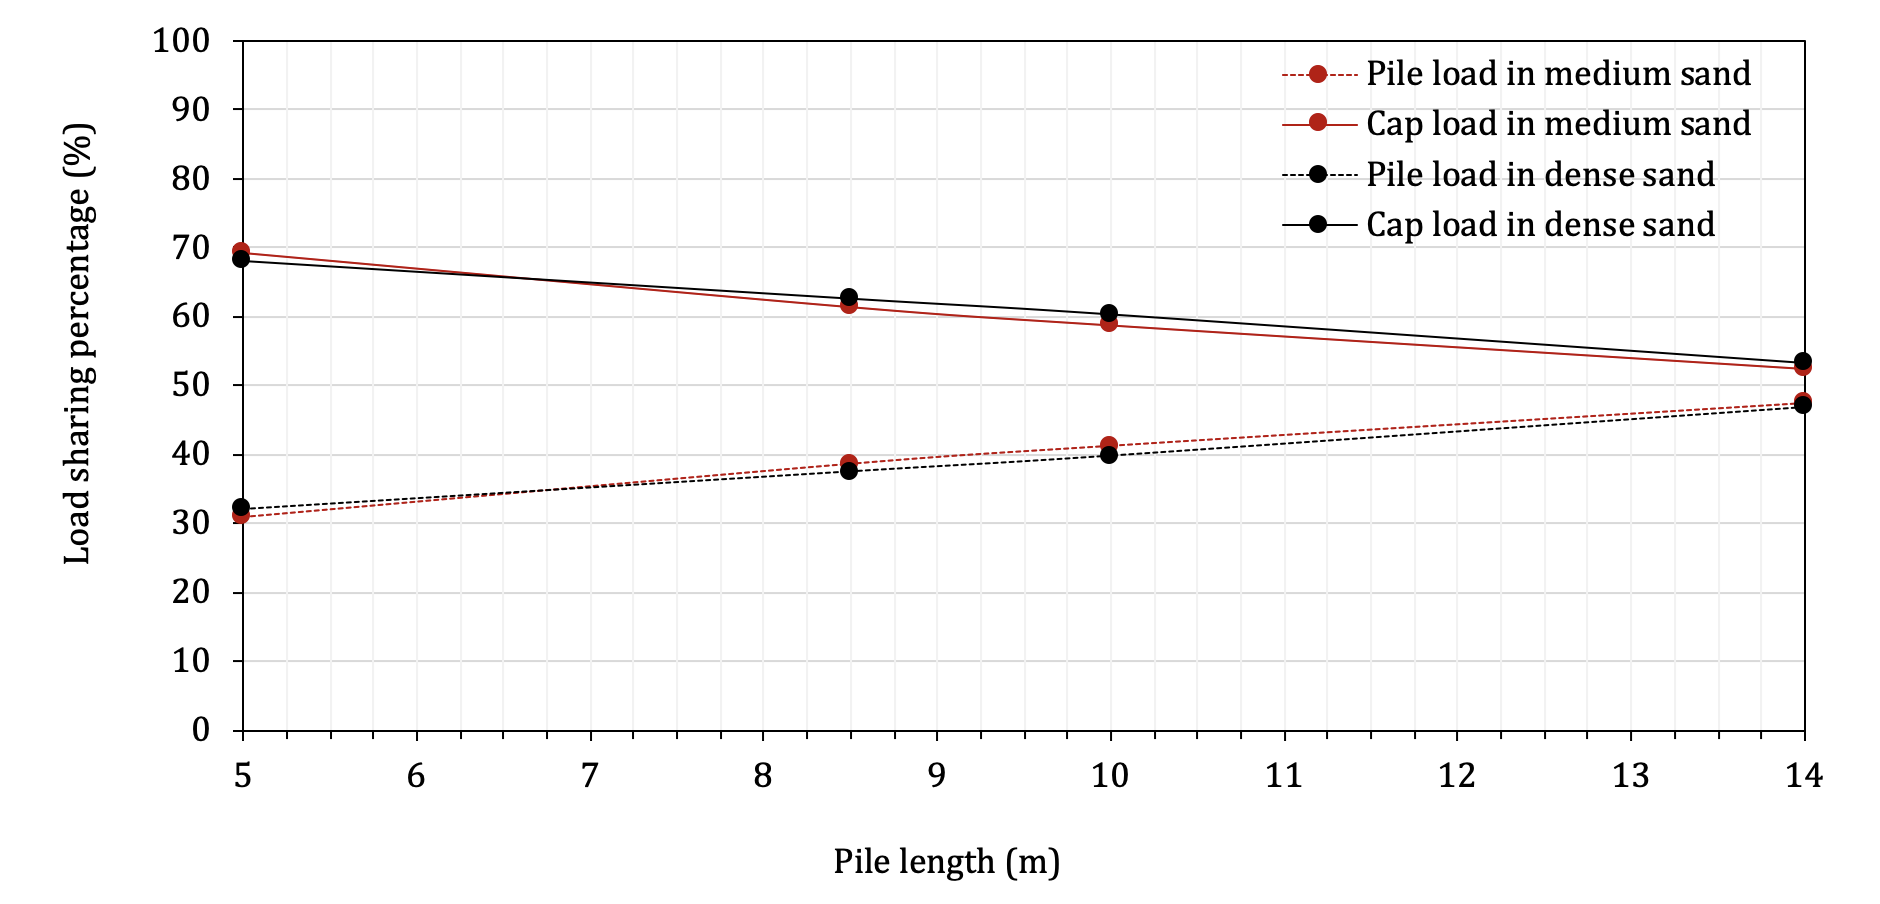
Figure 19 presents the results of the load sharing between piles and pile-cap. It can be seen in Fig. 19 that the sharing changes linearly with the increase of the pile length and the soil medium does not affect the load sharing. Given the observations from the results of the pile load resistance, it is expected that the percentage of the load carried by the piles is higher for a larger pile length. For the largest pile length tested, piles and pile cap share the same amount of the load (i.e., 50%). Once the pile length is reduced, the percentage of the load shared by the piles is also reduced. For example, for the pile length of 5m, piles take about 30% of the load while the pile cap takes about 70% of the load.
6. Conclusions
The effect of the cap thickness on the performance of a pile-cap foundation was investigated. A three-dimensional finite element model was developed using the software ABAQUS to simulate a 16-pile foundation in two soil mediums, i.e., medium dense and dense sand. The model was validated by the data available in the literature. A working load of 200MN was applied at the centre of the cap downward. The thickness of the cap examined was between 0.5m and 3.0m with an increment of 0.5m. The response of the structure was evaluated by the load carried by each individual pile and the deformation of the cap. The following was concluded:
- The pile cap acts as flexible up to a certain thickness, beyond which the cap acts as a rigid slab, where the loads are almost distributed evenly on the piles.
- The rigidity of the cap increases because of the decrease of pile spacing, especially for large caps.
- The cap may behave as rigid on strong soil, while the same cap will behave as flexible in case of weak soil.
- The rigidity of the cap increases with an increasing of pile diameter. This is due to the fact that by increasing the pile diameter, the contact area of piles and the cap increases, which will further reduce the settlement.
- The rigidity of pile cap increases with the increase of the pile length as the increase of the frictional resistance of piles.
- Within the range of the parameters tested in this study, the pile spacing does not affect the load sharing between the cap and the group of piles while the load sharing increased linearly with increasing of the pile diameter and pile length.
References
[1] S. Hain and I. Lee, "The analysis of flexible raft-pile systems," Géotechnique, 28(1): 65-83, 1978. View Article
[2] M. Randolph, "Design methods for pile groups and piled rafts," Proceedings of the 13th International Conference on Soil Mechanics and Foundation engineering , 5(13): 61-82, 1994.
[3] C. Viggiani, A. Mandolini and G. Russo, " Piles and pile foundations,". New York: CRC Press, 2012.
[4] A.B.M. Golam Rabbany, S. Islam and Md. Hasan-Uz-Zaman, "Pile cap performances in different consequences," Architecture Research, 8(2): 51-61, 2018.
[5] C. Reynolds and J. Steedman,"Reinforced concrete designer's handbook". London: CRC Press; 10 th edition, 1988.
[6] CSA A23.3-14, "Concrete Design Handbook," Cement Association of Canada, Ottawa, Ontario, Canada, 2014.
[7] S. EI Hammouli, "Performance of pile cap foundation with respect to cap rigidity", M.A.Sc thesis, Department of Building, Civil and Environmental Engineering, Concordia University, 2019. View Article
[8] A. Alnuiam, H. El Naggar and M. El Naggar, "Performance of Piled-Raft System under Axial Load," Proceedings of the 18th International Conference on Soil Mechanics and Geotechnical Engineerin g, pp. 2663–2666, 2013.
[9] K. Horikoshi, T. Matsumoto, Y. Hashizume and T. Watanabe, "Performance of piled raft foundations subjected to static horizontal loads," International Journal of Physical Modelling in Geomechanics, 3(2): 37-50, 2003. View Article
[10] C. Cheng, "Designing the depth of reinforced concrete rigid-pile caps for tall buildings," M.A.Sc thesis, Hong Kong University of Science and Technology, 2005.