International Journal of Civil Infrastructure (IJCI)
ISSN: 2563-8084

Volume 4 - Year 2021- Pages 116-127
DOI: 10.11159/ijci.2021.015
Modelling the Effects of Soil Properties, Rainfall and Road Geometry to Erosion in Unpaved Roads
Esdras Ngezahayo*, Gurmel Ghataora, Michael Burrow
EXN396@alumni.bham.ac.uk, g.s.ghataora@bham.ac.uk, m.p.n.burrow@bham.ac.uk
Department of Civil Engineering, School of Engineering, University of Birmingham, UK.
Abstract - Erosion of soils seriously challenges the sustainability and safety in unpaved roads. It leads to faster deterioration of these roads by formation of rills and gullies in the running surface. Many factors related to the soil properties, rainfall parameters, and road geometry affect erodibility of soils at the surface of unpaved roads. However, little is known about the relationships between those factors of erodibility for a single rainfall event. This paper models the contributions of soil properties, intensity and duration of the rainfall, and road’s length and gradient to the quantity of eroded soils from unpaved roads. For a 30-minute duration and two consecutive days; rainfall intensities of 30 mm/hr, 51 mm/hr and 68 mm/hr were used to test the erodibility of soils. The tested bed surfaces were set at slopes of 0% and 6%, in a small (large)-scale testing box of 0.6 m (1.2 m) x 0.3 m x 0.17 m (length x width x height). RapidMiner Studio software was used to predict quantities of eroded soils based on the measured eroded soils under the same influencing factors of erodibility. Six predictive models were developed based on the first- and second-day rainfall events. The predictive models can perform well with the Nash and Sutcliffe’s coefficients of efficiency (ME) ranging from 0.62 to 0.74. Also, clay content and mean particle size of the surface soils, rainfall intensity and slope gradient were the most contributing factors to the quantity of eroded soils from unpaved roads.
Keywords: Erosion, unpaved roads, eroded soils, predictive models, testing scales.
© Copyright 2021 Authors - This is an Open Access article published under the Creative Commons Attribution License terms. Unrestricted use, distribution, and reproduction in any medium are permitted, provided the original work is properly cited.
Date Received: 2021-03-17
Date Accepted: 2021-05-03
Date Published: 2021-05-26
1. Introduction
Rainwater erosion is by far the main challenge to the sustainability and safety of unpaved roads. Soil erosion can lead to the road’s running way deterioration by formation of erosion features such as rills, gullies, and overall loss of soils. This depletes the condition at the surface of the road and affects its serviceability. Mostly, unpaved roads are fully exploited in dry season and their practicability in terms of the quality of ride and road safety becomes questionable during rainy seasons. The socio-economic drawbacks associated with underperforming unpaved roads due to poor surface condition are huge in the rural areas of developing countries where these roads might be the only available transport routes. In unpaved roads, more erosion is mainly the detachment of surface soils by raindrops and the transport of detached soils by subsequent runoff. However, mechanical erosion can also be noticed in dry seasons when surface soil particles are disturbed by traffic wheels and blown into the air by wind generated by traffic speeds. Unpaved roads accelerate delivery of sediment, and at only 0.5% land use of the catchment; these roads outperform all the other sources of sediment [1]. When about 5% of the catchment’s land use is occupied by unpaved roads, they can contribute up to about 90% of the total sediment delivery from that catchment and potentially generating about 24 times more sediment than agriculture land [2]-[8].
Generally, the failure of unpaved roads by erosion is a result of the soil detachment due to raindrops (splash erosion), detachment due to surface flow shear stresses (sheet or interrill erosion) and detachment due to concentrated shear stresses (rill erosion) which once prolonged can lead to gully erosion [9]-[13]. Erosion threats go beyond unpaved roads, causing annual soil loss of about 24 billion tons globally [14]. Consequences are huge, and the annual cost of soil loss could reach $30 billion in the US and £90 million in the UK [11]. This cost of erosion seems to be an unbearable burden to the developing countries, leading to accumulated damages caused by excessive erosion. For example, it is about $400 million in Java (Indonesia) and more than $1500 million in Zimbabwe, which certainly is beyond the affordability of these countries. Also, it is worth noting that unpaved roads are about 80% of the road network in the developing world [12]-[13], [15]-[16]. Therefore, they cannot be fully paved with asphalt or concrete any time soon, and their importance to the development will remain vital by providing access to education, health, market, and job services to mention a few. Ultimately, combatting erosion in unpaved roads is necessary and should start by using the least erodible soils for construction and completed by appropriate routine maintenance activities. This will reduce enormous maintenance costs [17]-[18] and help to avoid traffic interruptions that might lead to isolation of rural areas [19].
Also, appropriate soils for unpaved road construction must achieve higher compaction levels, and thus greater bearing capacity to withstand traffic loads. Practically, road engineers seem to be unconcerned and rarely erodibility is detailed for the soils used for the construction of unpaved roads. This paper gives equations to predict the extent of erodibility of soils for use in unpaved road based on the soil geotechnical properties, rainfall intensity and duration, and slope length and gradient. The equations were developed using 1552 data from 192 laboratory erosion tests under simulated rainfall. These predictive equations can help to compare erodibility of available soils for earth road construction and maintenance. The least erodible soil should be selected if it meets other requirements of soil strength necessary for road construction.
2. Methods and Materials
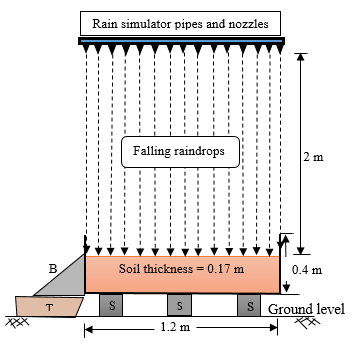
Appropriate soils for the construction of unpaved road were used. These were synthesized in the Civil Engineering Laboratory at the University of Birmingham, by adding percentages of the English China Clay (ECC) ranging from 0% to 20% to the gravelly SAND (GS) and to the very gravelly SAND (VGS) soils. The engineering properties of the obtained soil mixes are shown in Table 1. Samples were compacted to their maximum dry densities into a (0.6 m) 1.2 m x 0.3 m x 0.17 m (length x width x height) soil testing box for (small-) large-scale to simulate the required strength of unpaved roads before being tested for erodibility by rainfall and subsequent flow. Moreover, adding English china clay to gravelly SAND and very gravelly SAND soils improved both cohesion and plasticity indexes (Ip) which then ranged from 0% to 12%, as required for the surface soils of earth and gravel roads [20]-[22]. The raindrops fell through 2 meters above the surface of the sample and the flour method was used to determine the size of the raindrops [23]-[27]. It was found that the mean drop sizes were 3, 3.2, and 3.5 mm respectively for the 30, 51, and 68 mm/hr rainfall intensities. Considering the raindrops as small spheres, the volume of the raindrops was calculated:
Where V (mm3) is the volume of the raindrop and Dr (mm) is the mean drop size. The mass of the raindrops was calculated using the density relationship as follows:

Where m (mg) is the mass of the raindrop and ρ (mg/mm3) is the density of water. Using the relationship between the raindrop’s size, falling height, and falling velocity [28], terminal velocity of drops was estimated to be 5.20, 5.21, and 5.22 m/s respectively for 30, 51, and 68 mm/hr rainfall intensities. Applying the kinetic energy equation:
Where KE (J) is the kinetic energy of the raindrops, m is the mass of the raindrops and v (m/s) is the falling velocity of the raindrop. Then the KE of the raindrops was about 193.5 µJ, 244 µJ, and 301.1 µJ respectively for the 30, 51, and 68 mm/hr rainfall intensities. The sizes of the raindrops were in the range of the natural raindrops (1 mm to 6 mm) [23], [29]-[37], and the KE for different rainfall intensities were also satisfactory to initiate rainfall erosion of the tested soils [10]. Figure 1 illustrates the testing set up.
After calibrating the rainfall, the data of eroded soils was collected every five-minute intervals of time for a thirty-minute rainfall. After the first-day rainfall event, the tested sample was left uncovered for twenty-four hours before a second-day rainfall event of the same intensity was applied. This was done to obtain the effect of successive rainfall events on erosion of in earth roads. The collected runoff with its sediment content was weighed and oven-dried at 104.5 ֯c to retain the dry eroded soil particles. These were also weighed and sieved for later particle size distribution analysis. The cumulative weighed dry sediment was related to both the tested soil properties shown in Table 1, the slope length and gradient of the sample’s surface during erosion test, and the rainfall duration at which the sediment was collected (i.e. at 5 min, 10 min, 15 min, 20 min, 25 min or 30 min). It is this data of the weight of the eroded soils, the soil properties, the rainfall intensity, and duration as well as the slope length and gradient that was treated using the RapidMiner studio software to generate predictive equation to estimate the mass eroded soil mass during a given rainfall event. The correlation between measured eroded mass from the laboratory experiments and the predicted eroded sediment were shown. A typical data preparation sheet is also shown in Table 2, with the distinction between the data to be considered as “regular” on which the prediction of the “target or label” should be based. The data sheet was fed into the RapidMiner studio designed process of seven operators, as shown in Figure 2.
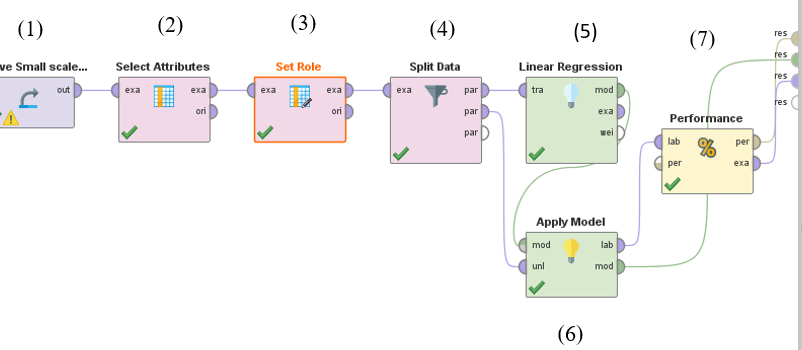
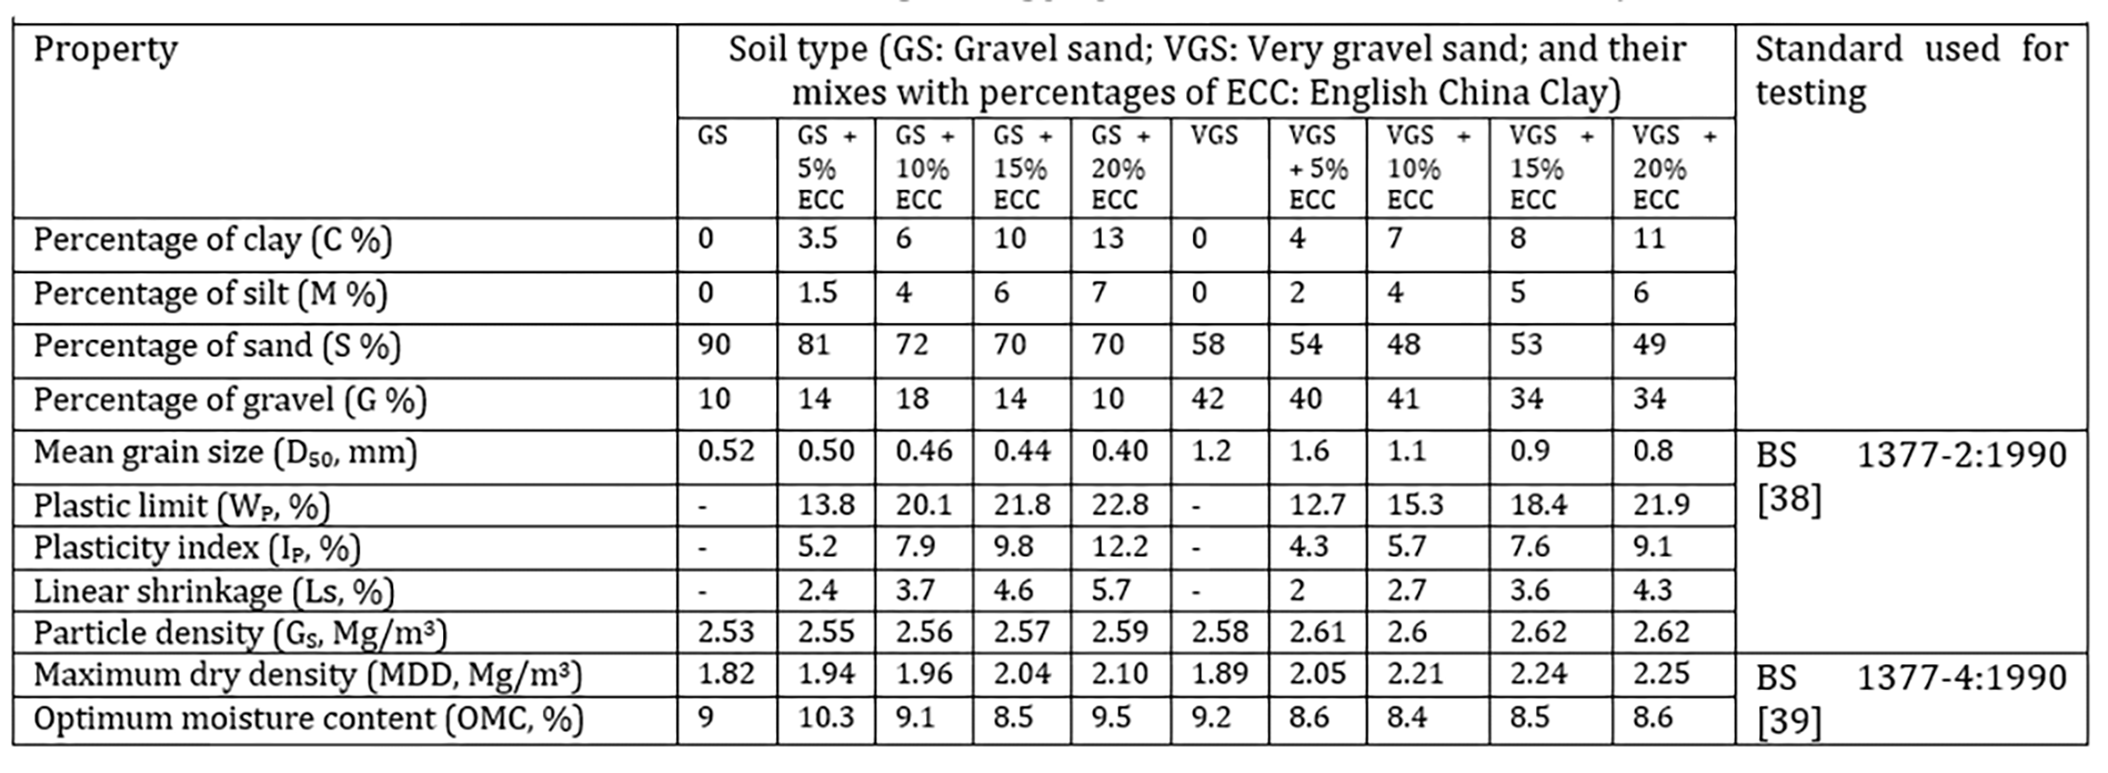
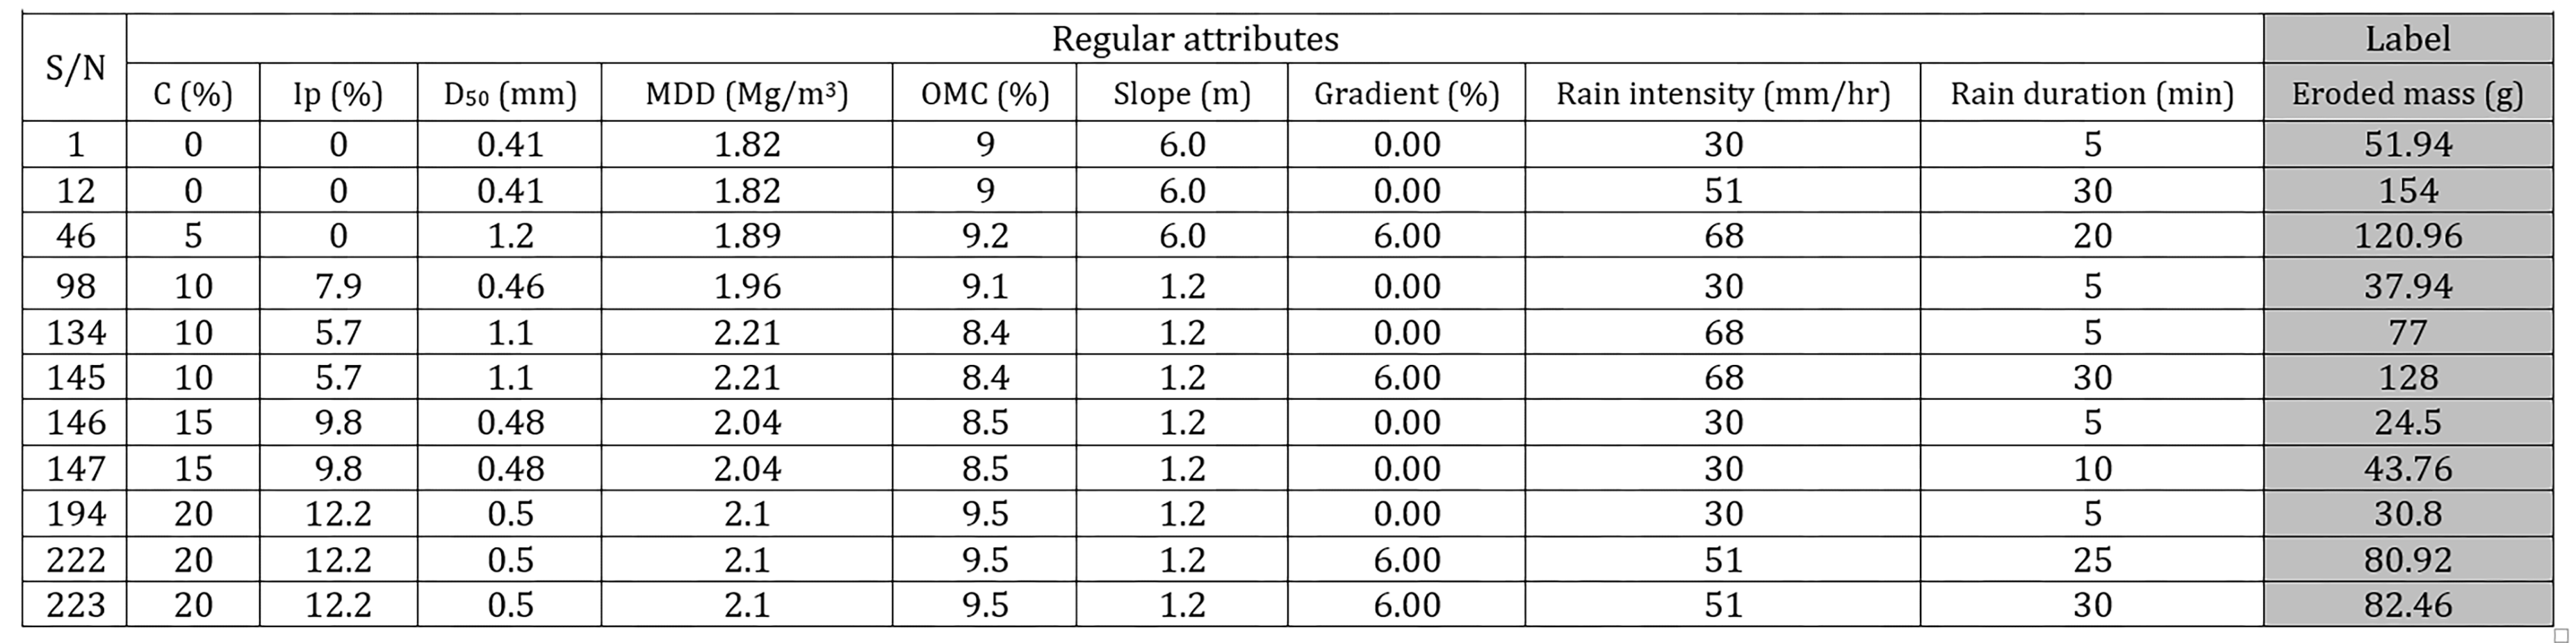
Figure 2 shows seven operators of the modelling process: (1) the “data input” operator to read the excel spreadsheet, (2) the “select attributes” operator to confirm the attribute types to the software, (3) the “set role” operator to distinguish attributes between regular and label, (4) the “split data” operator, which splits data into the model’s training and testing data, where usually 70% are training data to improve the model quality while 30% are testing data to check the correctness of the model. The other operators were (5) the “linear regression” operator to inform the software the type of desirable regression, (6) the “apply model” operator which executes the information, and (7) the “performance” operator which connects to the results’ pot and gives the model’s performance in terms of parameters such as squared correlation (R2) and root mean square (RMS).
3. Results
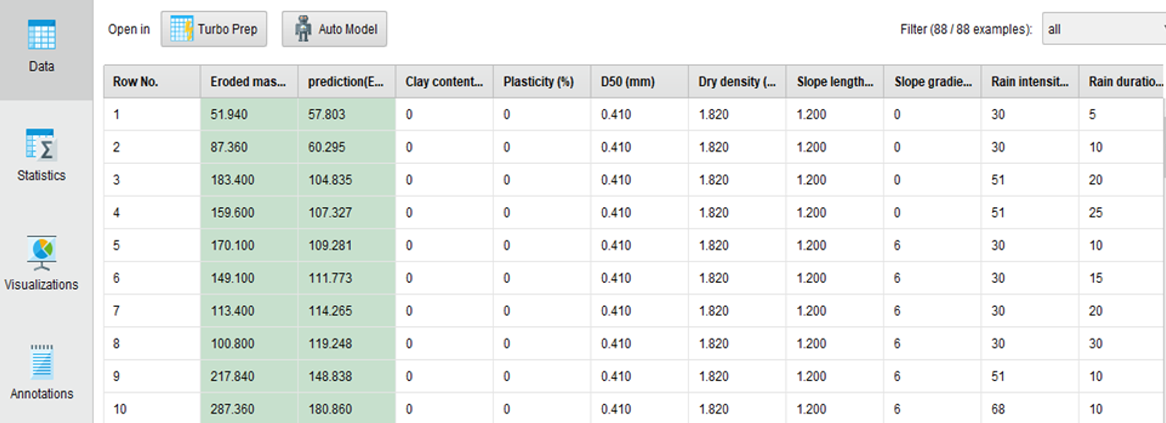
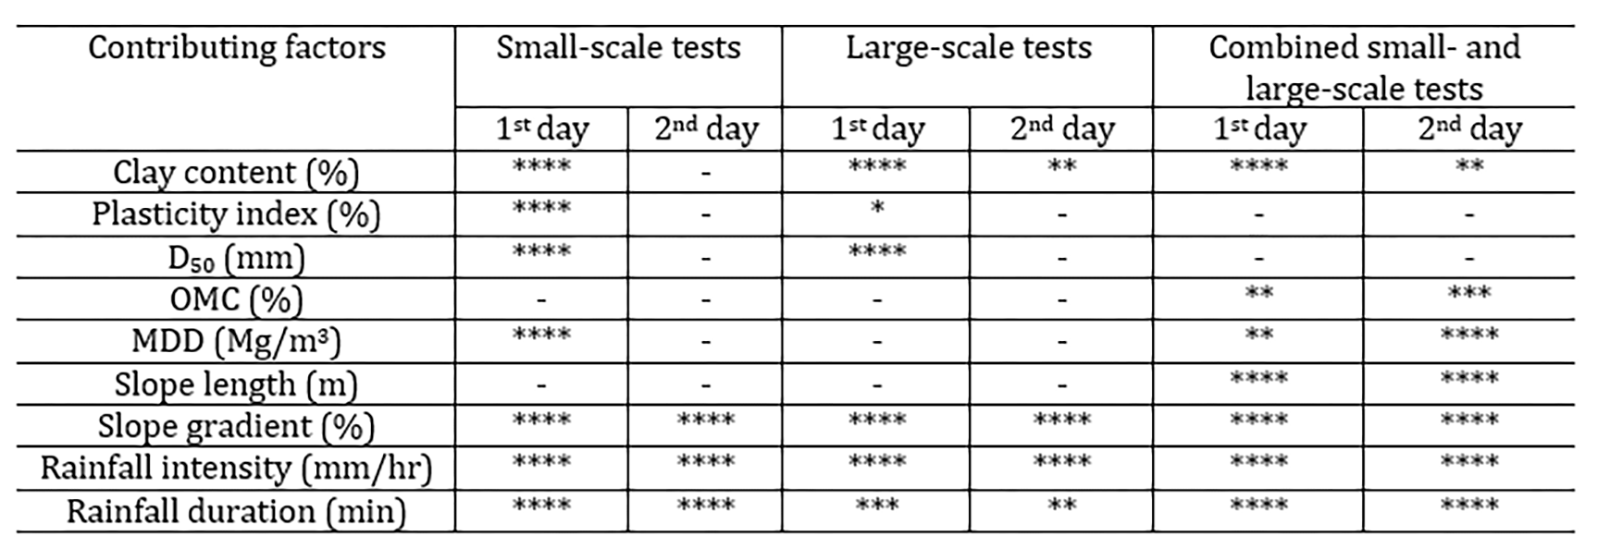
The results from data processing by the software were the predictive equations and the predicted eroded soil mass. Figure 3 shows an extract of results of the measured and predicted soil loss. Also, Table 3 shows the rating of the contribution by factors to the amount of eroded soil, with the highest contribution shown by four stars whilst the least contribution was shown by one star. The (-) indicates very insignificant contribution to the erosion. The six predictive equations can be seen in Equations 4 to 9, whilst the correlation between measured and predicted eroded soil mass are given in Figures 4, 5 and 6. These equations correlated contributions of different factors controlled during erosion tests to the quantity of predicted eroded soil mass (EMP, g). The factors include clay content (C, %), plasticity index (Ip, %), mean particle size (D50, mm), maximum dry density (MDD, Mg/m3), optimum moisture content (OMC, %), slope length (SL, m), slope gradient (SG, %), rainfall intensity (RI, mm/hr) and rainfall duration (RD, min).
3.1. Small-scale, first-day tests

3.2. Small-scale, second-day tests

3.3. Large-scale, first-day tests

3.4. Large-scale, second-day tests

3.5. Combined small- and large-scale, first-day tests

3.6. Combined small- and large-scale, second-day tests

4. Efficiency of the predictive models
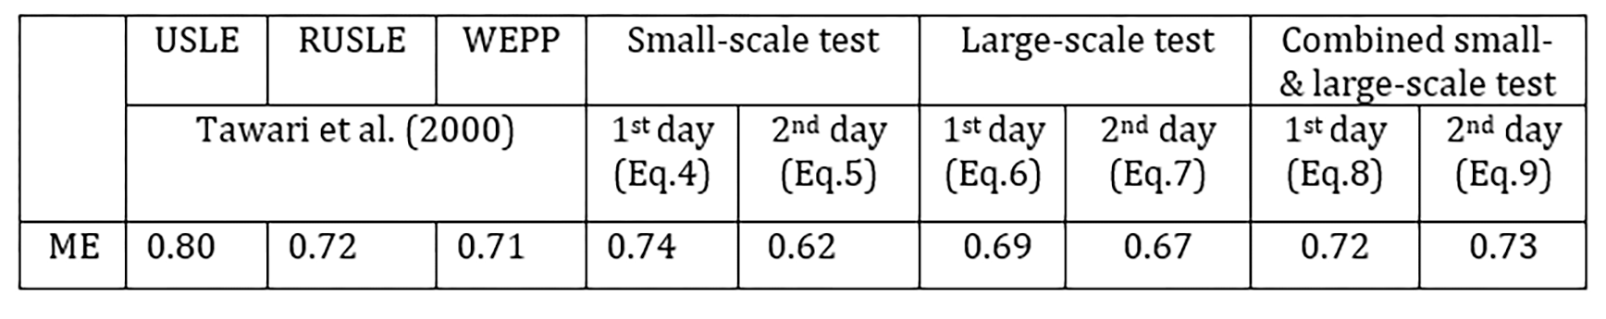
The efficiency of the erosion predictive equations (models) was checked using the Nash and Sutcliffe (1970)’ s method [7], [40]. This method described in Eq. 10 showed that the predictive models obtained in this study have a coefficient of efficiency (ME) ranging from 0.62 to 0.74. Although these coefficients were obtained using data from laboratory experiments, their comparison to those reported for Universal Soil Loss Equation - USLE (ME = 0.80), Revised Universal Soil Loss Equation - RUSLE (ME = 0.72) and Water Erosion Prediction Project - WEPP (ME = 0.71) [40] show that developed predictive equations can be as effective as (R)USLE and WEPP models when estimating the amount of sediment from unpaved roads due to a rainfall event.

where ME is the efficiency of the model, Qmi is the measured value of event “i”, Qci is the predicted value of event “i”, and Qm is the mean of the measured values. ME ranges from 0 to 1; the greater the value, the better the model. The details for ME values for generated predictive models, (R)USLE and WEPP can be seen in Table 4.
5. Discussions
Equations 4 and 5, and the resulting correlation between measured and predicted soil losses as shown in Figure 4, show that there may be an over-prediction for the soil losses up to 3000 g/m2, followed by an under-prediction, for both the first- and second-day rainfall events on the small-scale erosion tests. This was because the cumulative eroded soil was used for modelling whilst the measured erosion was higher in the first 15 minutes and reduced considerably during the last 10 minutes of the 30 minutes duration of the rainfall. However, the meaningful correlation between measured and predicted erosion sediment for both the first- and second-day tests (R2 = 0.795 and 0.757 respectively), and the performance of the model as shown by the coefficient of efficiency (ME = 0.74 and 0.62 respectively) prove that the models can be good tools to predict erosion in unpaved roads. Correlations are shown in Figure 4.
Similarly, for the large-scale erosion tests, a generalised over-prediction of the data up to about 500 g/m2 was noted, as shown in Figure 5. However, the correlation indicators between the factors of erodibility were better than for the small-scale tests, with R2 = 0.832 and 0.878 respectively, as shown in equations 6 and 7 for the first- and second-day tests, which was due to the increased scale of the bed slope leading to more consistency in the collection of the sediment detached by raindrops and carried out by runoff. This suggests that while modelling sediment delivery in unpaved roads, the design of the testing boxes must ensure possibility for maximum dislodgement of particles by both raindrops’ energy and flow stresses, as well as sufficient flow velocities to carry out the detached particles. Moreover, the coefficients of efficiency (ME = 0.69 and 0.67 respectively) were satisfactory to guarantee good performance of the predictive equations.
The combination of the data from both small- and large-scale experiments showed an over-prediction up to about 1100 g/m2, as shown in Figure 6. Expectedly, combining the data for the small-scale tests which mostly depended on the raindrops splash detachment and the large-scale experiments which maximized detachment by both raindrops and subsequent flow would not be without some discrepancies. However, this level of discrepancy is not to affect the performance of the predicted equations, no wonder both small- and large-scale tests showed the same trend of initial overprediction. However, this overprediction / overprediction feature seem to be common for most erosion predictive models and should not alone impair the quality of the model if the right data was used [41]-[42]. The meaningfulness of the correlation indicators between the factors of erodibility reduced slightly when compared to both separate small- and large-scale tests, with R2 = 0.586 and 0.549 respectively for the first- and second-day tests. This is the scale-factor effect on erodibility and shows that preferably the data obtained from the same sized testing plots should be used during erodibility trends modelling. The opposite may lead to false results, particularly if different materials have been tested. Nonetheless, the coefficients of efficiency (ME = 0.72 and 0.73) for the combined models also show that the have good performance as far as the prediction of soil detachment is concerned, as can be seen in Equations 8 and 9.
Overall, it was found that erodibility of longer slopes was hugely affected by runoff and slope gradient, while that of the shorter slopes was essentially affected by detachment due to raindrops. The results from the study (both measured and predicted) were compared to the findings by Laflen et al. [41] who used both the (Revised) Universal Soil Loss Equation and the Water Erosion Prediction Project models to predict soil loss; and with the findings by Ramos-Scharrόn and McDonald’s [42] who evaluated on field soil loss in both graded and ungraded roads. It was found that the results from this study plotted below the results of Laflen et al. [41]. The reason was that both RUSLE and WEPP models are suitable for bed slopes longer than 4 m, whilst the data for this study was collected from shorter slopes: 0.6-m length (small-scale) and 1.2-m length (large-scale) slopes. However, the data from this study plotted above the data obtained by Ramos-Scharrόn and McDonald [42], which is because of the greater resistance to detachment due to both lesser field moisture and higher densities of existing roads which were used by Ramos-Scharrόn and McDonald [42] compared to the optimum moisture content and maximum dry density used during this study’s laboratory experiments. Details are as shown in Figure 7.
6. Conclusion
Six linear regression models detailing the correlations between nine erodibility factors, namely, clay content, plasticity index, mean particle size, maximum dry density, optimum moisture content, slope length, slope gradient, rainfall intensity and rainfall duration, were developed. The models are not only the first attempt to correlate a significant number of various erodibility factors which greatly affect erodibility of soils in unpaved roads, but also are simple and flexible to accommodate more data from both field and laboratory experiments. Generally, this study showed that:
- The contribution of individual erodibility factors to the quantity of eroded soil shows that the first-day test results are highly affected by the soil’s clay content, plasticity index, particle size distribution, maximum dry density, slope gradient, rainfall intensity, and rainfall duration.
- Contrary, the second-day test results are mainly affected by the slope gradient, rainfall intensity and rainfall duration, which can practically be due to changes imparted on the physically simulated road surface by the first-day rainfall.
- Modelling erosion factors in the laboratory needs the use of testing boxes with sufficient length to ensure enough soil detachment by both splash and flow, as well as good transport of detached particles since shorter testing boxes tend to discourage detachment by runoff.
- Overall, the six predictive equations show that the slope length and gradient, rainfall intensity and rainfall duration are the four factors which highly affect erosion in unpaved roads, regardless of the type of the soil and compaction efforts. This may lead to the conclusion that apart from the selection of good soils for construction and maintenance, successful ways to combat erosion in unpaved roads must include best construction and management practices. Carefully informed decisions on the length and gradient of slopes, adequate drainage systems, as well as proper and timely maintenance to eliminate erosion features at the early stages of development must be given priority.
Acknowledgements
The authors would like to thank the Commonwealth Scholarship Commission in the UK for awarding a PhD scholarship to the first author. The School of Engineering, University of Birmingham are thanked for facilitating the research.
References
[1] E. Ngezahayo, M. Burrow and G. Ghataora, “Evaluation of the influence of geotechnical, environmental and road aspects on erodibility of rural roads,” Int. J. Latest Eng. & Manag. Res. (ISSN: 2455-4847), vol. 04, no. 11, pp. 29-54, 2019.
[2] K.V. Dubé, W.F. Megahan and M. McCalmon, “Washington Road Surface Erosion Model,” State of Washington, DNR, 2004
[3] E.S. Brooks, J. Boll, W.J. Elliot and T. Dechert, “Global Positioning System/GIS-Based Approach for Modeling Erosion from Large Road Networks,” J. Hyd. Eng., vol. 11, no. 5, pp. 418-426, 2006. View Article
[4] A. Rijsdijk, L.A.S Bruijnzeel and C.K. Sutoto, “Runoff and sediment yield from rural roads, trails and settlements in the upper Konto catchment, East Java, Indonesia,” Geomorphology, vol. 87, pp. 28-37, 2007. View Article
[5] L. Cao, K. Zhang and W. Zhang, “Detachment of road surface soil by flowing water,” Catena, vol. 76, pp.155-162, 2009. View Article
[6] R.B Foltz, N.S. Copeland and W.J. Elliot, “Reopening abandoned forest roads in northern Idaho, USA: Quantification of runoff, sediment concentration, infiltration, and interrill erosion parameters,” J. Envir. Management, vol. 90, pp. 2542-2550, 2009. View Article
[7] L. Cao, K. Zhang, H. Dai and Y. Liang, “Modelling Interill Erosion on Unpaved Roads in the Loess Plateau of China,” Land Degradation and Development, 2003, DOI: 10.1002/ldr.2253. View Article
[8] H.A. Katz, J.M. Daniels and S.E. Ryan, “Slope-area thresholds of road-induced gully erosion and consequent hillslope–channel interactions,” Earth Surf. Proc. Landforms, 2003.
[9] W.P. Carey and A. Simon, “Physical basis and potential estimation techniques for soil erosion parameters in the Precipitation-Runoff Modelling System,” Water Res. Invest. Report 84-4218, 1984, View Article
[10] C. Salles, J. Poesen and G. Govers, “Statistical and physical analysis of soil detachment by raindrop impact: Rain erosivity indices and threshold energy,” Water Resources Res., vol. 36, no. 9, pp. 2721-2729, 2000. View Article
[11] R.C.P. Morgan, “Soil Erosion and Conservation,” 3rd Ed., Blackwell P.., 2005.
[12] E. Ngezahayo, G.S. Ghataora and M.P.N. Burrow, “Factors Affecting Erosion in Unpaved Roads,” Proc. 4th World Congress on Civil, Struct. & Envir. Eng. (CSEE’19), Rome, Italy, April 7-9, Paper No. ICGRE 108, 2019. Available at View Article
[13] E. Ngezahayo, M.P.N. Burrow and G.S. Ghataora, “The Advances in Understanding Erodibility of Soils in Unpaved Roads,” Int. Journal of Civil Infrastructure, vol.2, pp. 18-29, 2019. Available at View Article
[14] Institute for Advanced Sustainability Studies, “Fertile Soils: Fundamental in the struggle against hunger and climate change,” Global Soil Forum, 2013.
[15] M.P.N. Burrow, R.C. Petts, M.C. Snaith, H. Evdordes and G.S. Ghataora, “Technology selection and its sustainability for low volume, rural roads in low-income countries: protocol for a systematic review (Protocol),” London: EPPI Centre, University of London, 2014.
[16] M.P.N. Burrow, H. Evdorides, G.S. Ghataora, R. Petts and M.S. Snaith, “The evidence for rural road technology in low-income countries,” Proc. ICE, 169, Issue TR6, pp. 366 – 377, 2016. View Article
[17] J. Hine, “Promoting the Adoption of Good Policies and Practices on Rural Transport in Africa,” The Planning and Prioritisation of Rural Transport Infrastructure and Services, Sub-Saharan Africa Transport Policy, Working Paper, 2014.
[18] R. Petts, “How much should developing countries spend on road maintenance?”, Briefing Note, Intech Asset Manag., UK & AFCAP Steering Group, pp. 1-10, 2013.
[19] E. Ngezahayo, M. Burrow and G. Ghataora, “Rural Roads –roles, challenges and solutions for Sub-Saharan Africa’s sustainable development,” Int. Journal of Latest Eng. and Manag. Research (ISSN: 2455-4847), vol. 04, no. 10, pp. 70-79.
[20] G. Keller and J. Sherar, “Low-Volume Roads Engineering: Best Management Practices Field Guide,” USAID, 2003. View Article
[21] Association of Southern African National Road Agencies, “Guidelines for Use of Sand in Road Construction in the SADC Region,” 2013.
[22] D. Shearer, T. Ziegler and E. Nevel, “What is new with driving surface aggregates? Potential upcoming additions to specification information for pavement management field trip,” Centre for Dirt and Gravel Road Studies, Pennsylvania State, USA, 2013.
[23] J.O. Laws and D.A. Parson, “The relation of raindrop-size to intensity,” Transactions of the American Geographical Union, Papers Hydrology, pp. 453-460, 1943.
[24] J.D. Eigel and I.D. Moore, “A Simplified Technique for Measuring Raindrop Size and Distribution,” Tr. Am. Soc. Agr. & Biol. Eng., vol. 26, no. 4, pp. 1079-1084, 1983. View Article
[25] M.A. Horne, “Design and Construction of a Rainfall Simulator for Large-scale Testing of Erosion Control Practices and Products,” Master’s Thesis, Auburn University, 2017.
[26] E. Ngezahayo, M.P.N. Burrow and G.S. Ghataora, “Rainfall Induced Erosion of Soils Used in Earth Roads,” Proc. of the 7th Int. Symposium on Deformation Characteristics of Geomaterials, IS- Glasgow, UK, June 26-28 June, E3S Web of Conferences, vol. 92, no. 17006, 2019, View Article
[27] M.D. Ricks, M.A. Horne, B. Faulkner, C. Zech, X. Fang, W.N. Donald and M.A. Perez, “Design of a Pressurized Rainfall Simulator for Evaluating Performance of Erosion Control Practices,” Water, vol. 11, pp. 2386, 2019. View Article
[28] American Standards for Testing Materials, “Standard Test Method for Determination of Rolled Erosion Control Product Performance in Protecting Hillslopes from Rainfall-Induced Erosion,” ASTM: West Con., PA, USA, 2015.
[29] V.N. Kelkar, “Size distribution of raindrops - Part II,” Indian J. Meteorology & Geophysics, vol. 4, pp. 323-330, 1959.
[30] C. Zanchi and D. Torri, “Evaluation of rainfall energy in central Italy,” In Assessment of Erosion, De Boodt M, Gabriels D (Eds), Wiley: Chichester; pp. 133-142, 1980.
[31] C.J. Brandt, “The Transformation of Rainfall Energy by a Tropical Rain Forest Canopy in Relation to Soil Erosion,” J. Biogeogr., vol. 15, no. 1, pp. 41-48, 1988. View Article
[32] R. Lal, “Soil Erosion Research Methodology,” Soil Conservation Society of America, Ankeny, IA, 340pp, 1994.
[33] A.W. Jayawardena and R.B. Rezaur, “Drop size distribution and kinetic energy load of rainstorms in Hong Kong,” Hydro. Proc., vol. 14, pp. 1069-1082, 2000. View Article
[34] S. Assouline, “Drop size distributions and kinetic energy rates in variable intensity rainfall,” Water Resources Research, vol. 45, W11501, 2009. View Article
[35] J.A. Smith, E. Hui, M. Steiner, M.L. Baeck, W.F. Krajewski and A.A. Ntelekos, “Variability of rainfall rate and raindrop size distributions in heavy rain,” Water Resources Res., vol. 45, W04430, 2009. View Article
[36] M.A.M. Abd Elbasit, H. Yasuda, A. Salmi and H. Anyoji, “Characterization of rainfall generated by dripper-type rainfall simulator using piezoelectric transducers and its impact on splash soil erosion,” Earth Surf. Proc. & Landforms, vol. 35, pp. 466–475, 2010. View Article
[37] A.I.J.M. Van Dijk, A.G.C.A. Meesters and L.A. Bruijnzeel, “Exponential distribution theory and the interpretation of splash detachment and transport experiment,” Soil Sc. Soc. Am. J., vol. 66, no. 5, pp. 1466-1474, 2002. View Article
[38] BS 1377-2: 1990, “Methods of test for Soils for civil engineering purposes. Classification tests”.
[39] BS 1377-4: 1990, “Methods of test for Soils for civil engineering purposes. Compaction-related tests”.
[40] A.L. Tiwari, L.M. Risse and M.A. Nearing, “Evaluation of WEPP and its comparison with USLE and RUSLE,” Trans. Am. Soc. Agr. Eng., vol.4, no. 5, pp. 129-1135, 2000. View Article
[41] J.M. Laflen, C.F. Dennis and A.E. Bernard, “Soil Erosion and Sediment Yield Prediction Accuracy Using WEPP,” J. Am. Water Res. Ass., vol. 40, no. 2, pp. 289-297, 2004. View Article
[42] C.E. Ramos–Scharrón and L.H. MacDonald, “Measurement and Prediction of Sediment Production from Unpaved Roads,” Earth Surf. Proc. & Landforms, vol. 30, pp. 1283 – 1304, 2005. View Article