International Journal of Civil Infrastructure (IJCI)
ISSN: 2563-8084

Volume 5 - Year 2022- Pages 37-42
DOI: 10.11159/ijci.2022.006
Effect of Sand to Aggregate Ratio on the Properties of Self-Compacting High-Performance Concrete
Abdullah Alshahrani, Tianyi Cui, Sivakumar Kulasegaram
Cardiff University
Newport Road
CF24 3AA
Cardiff, UK
AlshahraniA1@cf.ac.uk; Cuit2@cf.ac.uk; ulasegarams@cf.ac.uk
Abstract - Self-compacting high-performance concrete (SCHPC) combines the properties and advantages of self-compacting concrete and high-performance concrete in both fresh and hardened states. For the SCHPC mix design, sand to aggregate ratio is a crucial parameter and plays an important role in governing the properties of SCHPC mix. This paper presents the results of an experimental investigation on the flowability, passing ability and mechanical properties of SCHPC mixes for various sand to total aggregate (S/A) ratio and water to cementitious material (w/cm) ratio. Tests were conducted on specimens using four (w/cm) ratios: 0.26, 0.30, 0.35 and 0.40 and two (S/A) ratios: 48% and 53%. All the mixtures were tested using slump flow test, J-Ring test, and L-box test in the fresh state as well as compressive strength, splitting tensile strength, and unit weight in the hardened state. The test results revealed that a lower S/A ratio (0.48) enhanced the flowability whereas the higher S/A ratio (0.53) enhanced the passing ability. The lower S/A ratio (0.48), containing greater proportion of coarse aggregate, generally improved the mechanical properties of SCHPC compared to the mixes with the higher S/A ratio (0.53).
Keywords: Self-compacting concrete, high-performance concrete, sand to aggregate ratio, water to cementitious ratio, coarse aggregate volume.
© Copyright 2022 Authors - This is an Open Access article published under the Creative Commons Attribution License terms. Unrestricted use, distribution, and reproduction in any medium are permitted, provided the original work is properly cited.
Date Received: 2022-05-09
Date Accepted: 2022-05-16
Date Published: 2022-06-01
1. Introduction
Self-compacting concrete is one of the greatest innovations in concrete technology and the production of self-compacting concrete is increased rapidly due to its several merits in terms of improved properties and applications compared to conventional concrete. SCC can simply be placed into the framework, and it will go through areas of congested reinforcements under its own weight without any external vibration [1]. High-performance concrete (HPC) is a special type of concrete with high strength and durability [2]. Self-compacting high-performance concrete (SCHPC) is produced by combining the characteristics of SCC and HPC which results in superior performance in terms of flow characteristics, strength, and durability. However, SCHPC is more sensitive to mix design and material qualities compared to conventional concrete. Due to variations in the water content, type and shape of aggregates, fineness modulus, grading and the admixture type, the quality of the produced concrete can significantly vary [3], [4].
Aggregates, which account for more than 60% of the total volume of SCC, have a major impact on both fresh and hardened properties of the mixtures of SCC [5]. The volume fraction of coarse aggregate and particle size should be controlled within a specific range to ensure the required flowability characteristics of SCC is achieved [3]. Many studies in the past have focused on characteristics of coarse aggregates as well as their influence on the fresh and mechanical properties of SCC as the investigation of aggregate properties is highly crucial in the mix proportioning of SCC [6], [7].
The rheological and mechanical properties of concrete are significantly influenced by the fine aggregate to the total aggregate ratio by weight. The low sand to aggregate ratio (S/A ratio) negatively affects the flowability of concrete. This is attributed to the absence of sufficient mortar which fills voids among coarse aggregates. On the other hand, a high S/A ratio also reduces the flowability of concrete due to the high specific surface area of sand that minimises the cement layer thickness which lubricates solid particles and allows aggregate particles to flow more easily [8]. The European Guidelines for Self-Compacting Concrete [9] recommended that the typical range of fine aggregate is between 48% and 55% of the total aggregate by weight. The S/A ratios also affect the mechanical properties of the concrete. The compressive strength, unit weight, tensile strength, modulus of elasticity and the fracture energy of SCC are determined by the content of coarse aggregate which decreases inversely to the increase of S/A ratio [3], [7], [10]. The design of SCHPC and the performance of concrete structures mainly rely on these mechanical characteristics.
The objective of this study is to investigate the effects of the S/A ratio (0.48 and 0.53) on the performance of SCHPC with different water to cementitious materials (w/cm) ratio and paste to solid (p/s) ratio including the fresh properties (slump flow test, J-ring test, L-box test) and mechanical properties (compressive strength, unit weight and splitting tensile strength)
2. Experimental programme
2.1. Materials
Portland cement (type I 52.5) complying with EN 197-1 [11], ground granulated blast furnace slag (GGBS) and fly ash with a specific gravity of 3.15, 2.4, and 2.4 respectively were used. The fineness of the Portland cement is 384 m2/kg. A superplasticiser of Poly-Aryl-Ether based type (MasterGlenium ACE 499) with a specific gravity of 1.07 was used. Crushed limestone coarse aggregate with a specific gravity of 2.65 and a maximum size of 20 mm is used in this research. The fine aggregate is natural river sand with a specific gravity of 2.55 and a maximum size of 2 mm. The fine aggregate was replaced by an equivalent volume (30%) of the coarser fraction of limestone (limestone dust) with a specific gravity of 2.6 and the size ranging between 0.125 mm and 2 mm.
2.2. Mix design
Four series of SCHPC mixes were designed based on the mix design method proposed by Karihaloo and Ghanbari [12], and Abo Dhaheer et al. [13] with compressive strengths of 70, 80, 90 and 100 MPa and, w/cm ratios of 0.26, 0.30, 0.35 and 0.40 respectively. All mixtures were prepared with 40% (by weight) replacement of Portland cement with fly ash and GGBS. The SCHPC mixes contained two different S/A ratios, and the mixtures are designated as A and B for 0.48 and 0.53 S/A ratios, respectively. Table 1 presents the compositions of all mixes tested.
Table 1. Mix proportions of SCC mixes, kg/m3
|
Mix code |
water |
cm |
SP |
FA |
CA |
|
70A |
188.4 |
471 |
2.83 |
775 |
840 |
|
70B |
188.4 |
471 |
2.83 |
848 |
764 |
|
80A |
174.2 |
499 |
3.48 |
780 |
845 |
|
80B |
174.2 |
499 |
3.48 |
863 |
751 |
|
90A |
164.4 |
549 |
4.38 |
769 |
833 |
|
90B |
164.4 |
549 |
4.38 |
843 |
756 |
|
100A |
151.7 |
584 |
5.83 |
767 |
831 |
|
100B |
151.7 |
584 |
5.83 |
844 |
751 |
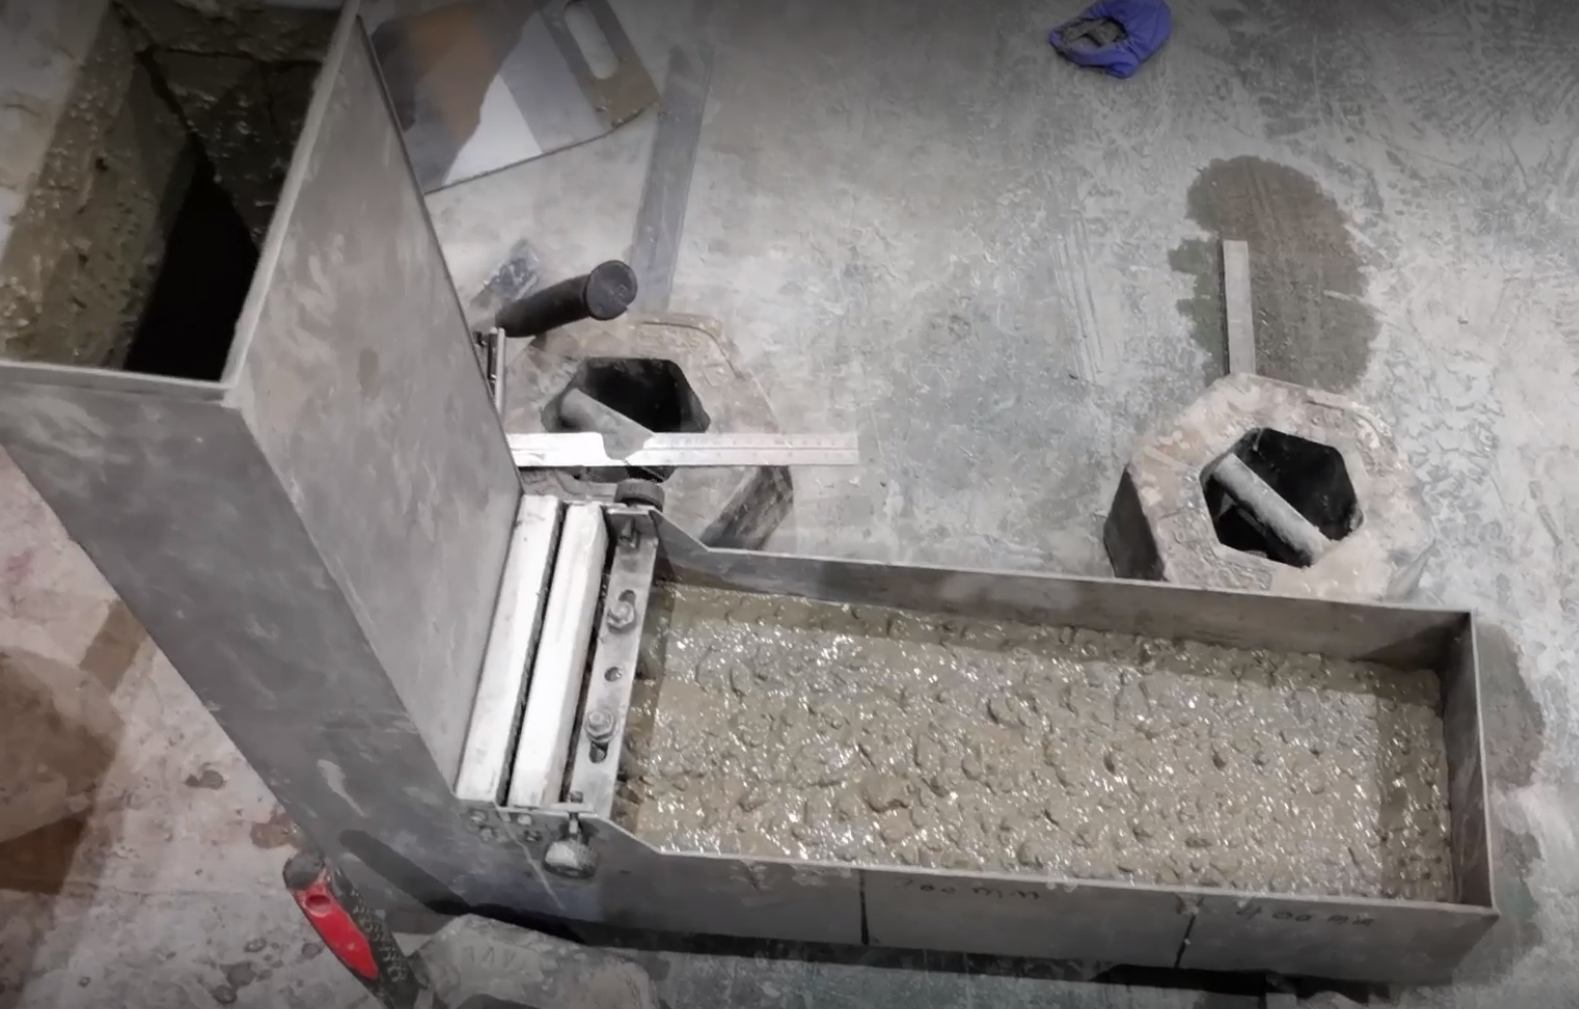
2.3 Test methods
Self-compactibility characteristics of the mixes were evaluated with slump flow, J-ring, and L-box tests according to the EFNARC guidelines [9]. From each of the eight mixes (Table 1) five cubes (100*100*100 mm), and three cylinders (100*200 mm) were cast. After 1 day, the specimens were de-moulded and cured in water at a temperature of 22 (± 1) °C for 7 days and 28 days. Prior to the compression test, the unit weight was measured after 28 days of curing. The weight of cylindrical specimens was determined preceding compression testing and then the unit weight was computed by measuring the volume of the cylindrical specimen.
3. Results and discussion
3.1. Fresh properties
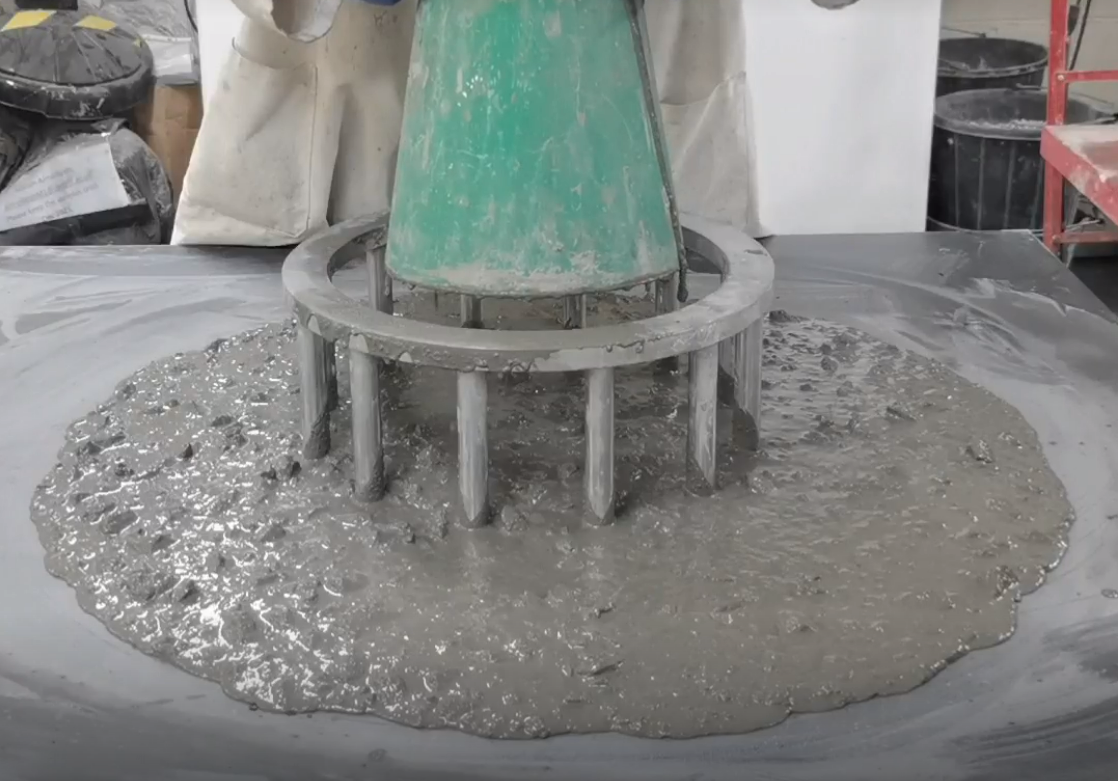
All the above mixes were subjected to slump flow test (flowability), J-ring test and L-box test (passing ability) to ensure that all mixtures satisfied the self-compacting criteria without any sign of segregation or bleeding. All SCC mixes passed the fresh state flow tests (Figures 1-3). The experimental results from testing fresh properties of all mixtures are summarised in Table 2 and Table 3.
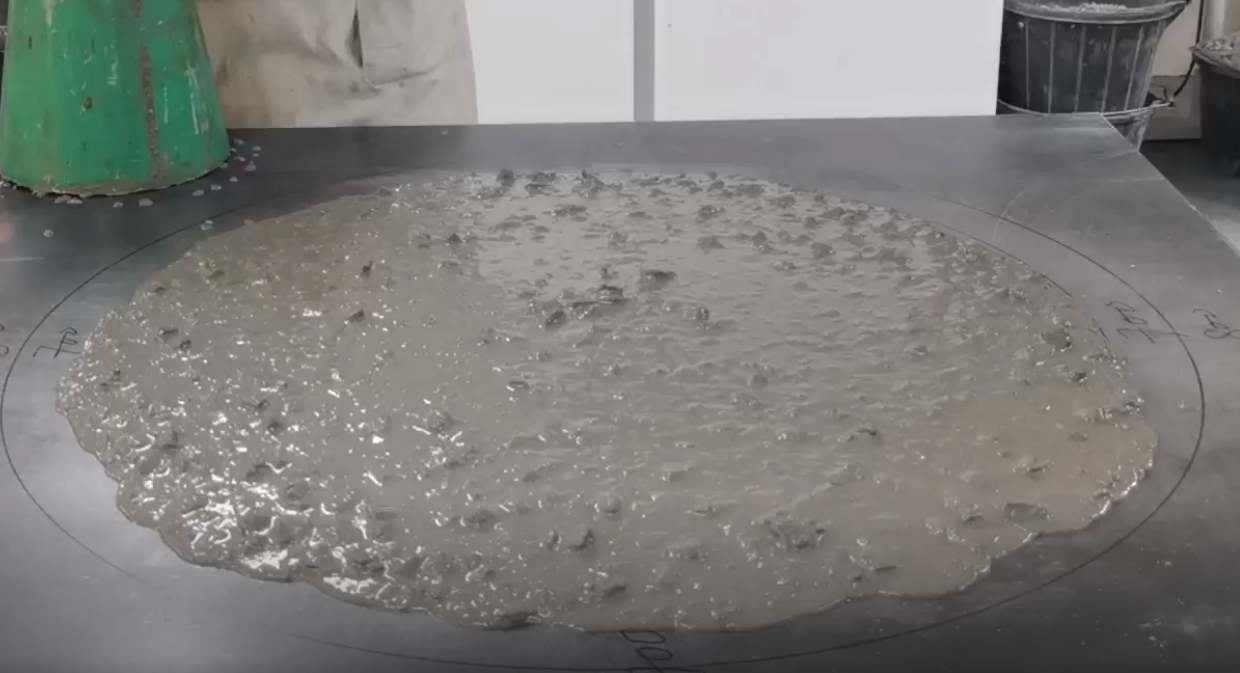
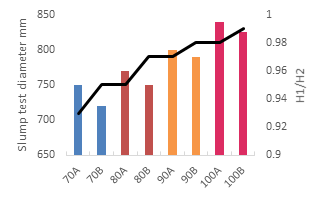
The results from the slump flow test are given in Figure 4 which illustrates that as the S/A ratio is increased from 0.48 to 0.53 (while keeping the volume fraction of total aggregate constant and maintaining the paste volume constant for each series), the slump flow diameter decreased. This result is in agreement with the experimental study presented in [14]. This could be attributed to the fact that the higher surface area to volume ratio of sand raises the effective aggregate volume. However, Yardimci et al. [10] reported contrasting observation to the present study, the flowability increased when S/A ratio is increased from 0.48 to 0.72. However, the reason behind that observation was due to the increase in the amount of superplasticiser used with the increase of S/A ratios.
Table 2. Slump flow tests of SCC mixes
|
Mix code |
Spread(mm) |
t500(s) |
|
70A |
750 |
1.27 |
|
70B |
720 |
1.8 |
|
80A |
770 |
1.9 |
|
80B |
750 |
2 |
|
90A |
800 |
3 |
|
90B |
790 |
3.6 |
|
100A |
840 |
4.2 |
|
100B |
825 |
4 |
Table 3. J-ring and L-box tests of SCC mixes
|
Mix code |
J-ring* flow test |
L-box** test |
|||||
|
Spread(mm) |
t500j |
t200 |
t400 |
H1/H2 | |||
|
70A |
710 |
2.1 |
0.65 |
1.73 |
0.93 |
||
|
70B |
690 |
2.75 |
0.8 |
1.8 |
0.95 |
||
|
80A |
730 |
3.5 |
0.93 |
2.23 |
0.95 |
||
|
80B |
710 |
3.2 |
1.84 |
4.85 |
0.97 |
||
|
90A |
770 |
4.3 |
1.24 |
3.4 |
0.97 |
||
|
90B |
760 |
5 |
1.46 |
3.95 |
0.98 |
||
|
100A |
790 |
5.3 |
3.1 |
5.8 |
0.98 |
||
|
100B |
775 |
6.4 |
3 |
5.6 |
0.99 |
||
* J-ring apparatus with 12 steel rods
** L-box has two smooth steel bars of (12 ± 0,2) mm diameter
J-Ring test can be used in conjunction with a slump flow test to evaluate the passing ability of the SCC mix according to the ASTM C 1621/C1621M [15]. If the difference in the final spread diameter between the slump flow and J-ring flow is less than 25mm, then there is no visible blocking. There is little to noticeable blockage if the difference is between 25mm to 50mm. The difference between the spread diameter in slump and J-ring tests observed are shown in Table 4 and the difference in spread diameter for all the mixes ranges between 25mm to 50mm.
Table 4. Difference between slump and J-ring spread
|
Mix designation |
Dslump | DJ-ring | Dslump-DJ-ring | ||
|
70A |
750 |
710 |
40 |
||
|
70B |
720 |
690 |
30 |
||
|
80A |
770 |
730 |
40 |
||
|
80B |
750 |
710 |
40 |
||
|
90A |
800 |
770 |
30 |
||
|
90B |
790 |
760 |
30 |
||
|
100A |
840 |
790 |
50 |
||
|
100B |
825 |
775 |
50 |
||
The effect of S/A ratio using different w/cm on the passing ability was assessed by the H2/H1from L-box test (Table 3). This test is recommended for evaluating the passing ability of SCC mixtures. According to EFNARC, H1/H2 ratio closer to 1 indicates better passing ability [9]. The results of L-box test showed that increasing S/A ratio from 0.48 to 0.53 slightly enhances the passing ability of all mixes. It can be concluded that increasing S/A ratio from 0.48 to 0.53 improved the passing ability while the slump flow diameter (flowability) slightly decreased.
3.2 Mechanical properties
3.2.1 Compressive strength
The compressive strengths of four series of SCHPC specimens with S/A ratios 0.48 and 0.53, after 7, 28 and 90 days are shown in Table 5. The mixes with S/A ratio equal to 0.48, achieved higher compressive strength compared to mixes with S/A ratio equal to 0.53. However, the effect of S/A ratios on the compressive strength is insignificant within the ratio of S/A recommended by EFNARC guidelines. It is agreed that the compressive strength is mainly determined by the ratio of water to cementitious materials and the composition of the powder [16]. Nevertheless, compressive strength is also affected by the coarse aggregate, the fraction of which decreases as the S/A ratio increases. Hence, substituting coarse aggregate with an equivalent volume of sand resulted in a reduction in compressive strength [3]. Yardimci et al. [10] reported that the increase of the S/A ratio from 0.48 to 0.71 resulted in a reduction of 13.7% of the compressive strength of SCC.
Table 5. Compressive strength of SCHPC mixes
|
Mix code |
Compressive strength (MPa) |
|||
|
7 days |
28 days |
90 days |
||
|
70A |
48.25 |
74.22 |
79.5 |
|
|
70B |
45.30 |
70.14 |
75.6 |
|
|
80A |
63.48 |
80.10 |
88.3 |
|
|
80B |
62.82 |
78.00 |
86.7 |
|
|
90A |
70.50 |
93.20 |
101.9 |
|
|
90B |
68.70 |
90.00 |
96.35 |
|
|
100A |
80.40 |
100.10 |
108.8 |
|
|
100B |
74.50 |
98.10 |
106.7 |
|
3.2.2 Unit weight
Several conventional equations indicate that coarse aggregate content affects the value of modulus of elasticity of concrete by affecting the value of its unit weight [17]. Tomosawa [7] examined the unit weight of concrete specimens before the compression test. As it can be seen from Table 6, all mixes designated by A with lower S/A ratio (0.48), higher coarse aggregate content, have higher unit weight compared to mixes designated by B. It can be seen that the higher compressive strength and lower S/A ratio have the higher unit weight. In other words, for a given concrete strength, the higher S/A ratio resulted in a decrease in the unit weight of concrete which would result in a reduction in the value of modulus of elasticity.
Table 6. Unit weight and tensile strength of SCHPC
|
Mix code |
Unit weight (kg/m3) |
Tensile strength (MPa) |
Ratio of tensile strength / compressive strength |
|
70A |
2382.1 |
5.28 |
0.0711 |
|
70B |
2376.3 |
5.65 |
0.0806 |
|
80A |
2435.4 |
7.38 |
0.0921 |
|
80B |
2413.0 |
7.52 |
0.0964 |
|
90A |
2445.8 |
8.00 |
0.0858 |
|
90B |
2430.9 |
7.81 |
0.0868 |
|
100A |
2471.2 |
7.17 |
0.0716 |
|
100B |
2462.1 |
6.57 |
0.0670 |
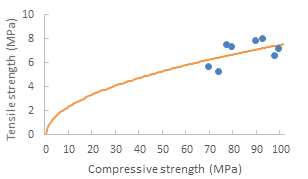
3.2.3 Splitting tensile strength
By adjusting the S/A ratio, the distribution of fine and coarse aggregate, as well as the force among particles, could be changed. Table 6 shows the tensile strength and the ratio of compressive strength to tensile strength of SCC mixes after 28 days. These results show that the ratios are in the range of 6% - 10%. According to the guideline from AIC 318[18], the relationship between splitting tensile strength and compressive strength of concrete can be described by Eq. 1 as:

where, ftsp is the tensile strength and fc is the compressive strength.
The relationship between splitting tensile strength and compressive strength of SCHPC mixes (Figure 5) can be expressed by Eq. 2 as:

It can be concluded that the ratio of tensile strength to compressive strength of SCHPC mixes were higher than that of normal concrete.
4. Conclusions
SCHPC is a vastly used material in the industry and hence it always presents an opportunity for the researchers to innovate and improve this material. This study investigates the effects on SCHPC fresh and mechanical properties by varying its constituents. The variables include sand to aggregate ratio, water to cementitious ratio and paste to solid ratio. The tests included slump flow test, J-ring test, L-box test and the evaluation of mechanical properties (compressive strength, unit weight and splitting tensile strength). All the mixes subjected to slump flow test, J-ring test and L-box test satisfied the self-compacting and flow state tests criteria without any signs of segregation. The slump flow test illustrated that sand to aggregate ratio is inversely proportional to the slump flow diameter. The results revealed that the mixes with 0.48 sand to aggregate ratio yielded a higher compressive strength in comparison to a higher S/A ratio of 0.53. However, the effect can be considered insignificant, and it was found that the compressive strength is mainly determined by the ratio of water to cementitious materials and the powder composition. It was also noted that the mixes with the lower sand to aggregate ratio resulted in a higher unit weight and the ratio of tensile strength to compressive strength of the SCHPC mix was higher than that of the normal concrete.
References
[1] H. Okamura and M. Ouchi, “Sel-Compacting Concrete, Journal of Advanced Concrete Technology, Vol.1, No.1, April 2003,” vol. 1, no. 1, pp. 5–15, 2003. View Article
[2] M. Jalal, A. Pouladkhan, O. F. Harandi, and D. Jafari, “Comparative study on effects of Class F fly ash, nano silica and silica fume on properties of high performance self-compacting concrete,” Construction and Building Materials, vol. 94, pp. 90–104, 2015, doi: 10.1016/j.conbuildmat.2015.07.001. View Article
[3] W. T. Lin, “Effects of sand/aggregate ratio on strength, durability, and microstructure of self-compacting concrete,” Construction and Building Materials, vol. 242, p. 118046, 2020, doi: 10.1016/j.conbuildmat.2020.118046. View Article
[4] M. Moravvej and M. Rashidi, Structural performance of self-compacting concrete. Elsevier Inc., 2019. doi: 10.1016/B978-0-12-817369-5.00013-1. View Article
[5] B. M. Aïssoun, S. D. Hwang, and K. H. Khayat, “Influence of aggregate characteristics on workability of superworkable concrete,” Materials and Structures/Materiaux et Constructions, vol. 49, no. 1–2, pp. 597–609, 2016, doi: 10.1617/s11527-015-0522-9. View Article
[6] O. R. Khaleel, S. A. Al-Mishhadani, and H. Abdul Razak, “The effect of coarse aggregate on fresh and hardened properties of Self-Compacting Concrete (SCC),” Procedia Engineering, vol. 14, pp. 805–813, 2011, doi: 10.1016/j.proeng.2011.07.102. View Article
[7] J. Guru Jawahar, C. Sashidhar, I. v. Ramana Reddy, and J. Annie Peter, “Effect of coarse aggregate blending on short-term mechanical properties of self-compacting concrete,” Materials and Design, vol. 43, pp. 185–194, 2013, doi: 10.1016/j.matdes.2012.06.063. View Article
[8] D. Jiao, C. Shi, Q. Yuan, X. An, Y. Liu, and H. Li, “Effect of constituents on rheological properties of fresh concrete-A review,” Cement and Concrete Composites, vol. 83, pp. 146–159, 2017, doi: 10.1016/j.cemconcomp.2017.07.016. View Article
[9] EFNARC, “The European Guidelines for Self-Compacting Concrete,” The European Guidelines for Self-Compacting Concrete, no. May, p. 63, 2005, [Online]. Available: View Article
[10] M. Y. Yardimci, B. Baradan, and M. A. Taşdemir, “Effect of fine to coarse aggregate ratio on the rheology and fracture energy of steel fibre reinforced self-compacting concretes,” 234Sadhana - Academy Proceedings in Engineering Sciences, vol. 39, no. 6, pp. 1447–1469, 2014, doi: 10.1007/s12046-014-0257-2. View Article
[11] BS EN 197-1:2011, “BSI Standards Publication BS EN 61400-27-1:2015,” no. October 2015, 2019, [Online]. Available: https://bit.ly/2HDR7v5
[12] B. L. Karihaloo and A. Ghanbari, “Mix proportioning of selfcompacting high-and ultrahigh-performance concretes with and without steel fibres,” Magazine of Concrete Research, vol. 64, no. 12, pp. 1089–1100, 2012, doi: 10.1680/macr.11.00190. View Article
[13] M. S. Abo Dhaheer, M. M. Al-Rubaye, W. S. Alyhya, B. L. Karihaloo, and S. Kulasegaram, “Proportioning of self–compacting concrete mixes based on target plastic viscosity and compressive strength: Part I - mix design procedure,” Journal of Sustainable Cement-Based Materials, vol. 5, no. 4, pp. 199–216, 2016, doi: 10.1080/21650373.2015.1039625. View Article
[14] H. B. Jovein and L. Shen, “Effects of aggregate properties on rheology of self-consolidating concrete,” Advances in Civil Engineering Materials, vol. 5, no. 1, pp. 235–255, 2016, doi: 10.1520/ACEM20160008. View Article
[15] ASTM C1621, “C 1621M-09b ‘Standard Test Method for Passing Ability of Self-Consolidating Concrete by J-Ring,’” Annual Book of ASTM Standard, vol. i, p. 5, 2014, doi: 10.1520/C1621.
[16]P. L. Domone, “Self-compacting concrete: An analysis of 11 years of case studies,” Cement and Concrete Composites, vol. 28, no. 2, pp. 197–208, 2006, doi: 10.1016/j.cemconcomp.2005.10.003. View Article
[17] T. Noguchi, F. Tomosawa, K. M. Nemati, B. M. Chiaia, and A. R. Fantilli, “A practical equation for elastic modulus of concrete,” ACI Structural Journal, vol. 106, no. 5, pp. 690–696, 2009, doi: 10.14359/51663109. View Article
[18] N. Arioglu, Z. Canan Girgin, and E. Arioglu, “Evaluation of ratio between splitting tensile strength and compressive strength for concretes up to 120 MPa and its application in strength criterion,” ACI Materials Journal, vol. 103, no. 1, pp. 18–24, 2006, doi: 10.14359/15123. View Article