International Journal of Civil Infrastructure (IJCI)
ISSN: 2563-8084

Volume 5 - Year 2022- Pages 43-50
DOI: 10.11159/ijci.2022.007
Laboratory Pullout Testing Of Biaxial Geogrid in Sand-Crumb Rubber Mixtures
Tirtha Sathi Bandyopadhyay1, Pradipta Chakrabortty2, A. Hegde3
1Research Scholar, Department of Civil and Environmental Engineering, Indian Institute of Technology Patna, India.
2,3Assistant Professor, Department of Civil and Environmental Engineering, Indian Institute of Technology Patna, India.
E-mail: tirtha_1821ce05@iitp.ac.in1, pradipt@iitp.ac.in2, ahegde@iitp.ac.in3
Abstract - In the present study, a series of pullout tests were conducted to understand the sand-crumb rubber interaction behaviour with biaxial geogrid. Six different crumb rubber–sand mixtures with mixing ratios of 0:100, 10:90, 20:80, 30:70, 40:60 and 50:50 by volume were studied. Pullout tests were conducted at five different normal stresses (i.e., 20 kPa, 40 kPa, 60 kPa, 80 kPa and 100 kPa), where pullout forces were applied to the geogrid specimen at a constant strain rate of 1 mm/min. The normal stress-dependent pullout capacity was obtained from each test. The peak pullout load was observed at the verge of the failure of the geogrid. Two different types of failure of the geogrid were observed (i.e., slippage and rupture failure). The pullout test results were interpreted in terms of pullout resistance factor (F*), which represents the interaction between backfill material and geogrid specimen. The resistance factor was found to increase with the increase in rubber percentage in the mix from 10% to 30%. The maximum value was found to be 1.07 at 30% rubber percentage in the mixture at 20 kPa normal stress. However, at 40% rubber percentage in the mixture, F* was found to reduce. A similar trend was also observed for other normal stresses. Furthermore, strain variation in the geogrid due to pullout loading was also studied. The strain was found to decrease with the addition of rubber content. Strain reduced by 48% at 30% rubber content. Hence, the 30:70 mixing ratio of rubber-sand showed the highest interaction, thus giving the optimum pullout capacity of the geogrid.
Keywords: Pullout strength; Crumb rubber; Biaxial geogrid; Strain; Slippage.
© Copyright 2022 Authors - This is an Open Access article published under the Creative Commons Attribution License terms. Unrestricted use, distribution, and reproduction in any medium are permitted, provided the original work is properly cited.
Date Received: 2022-04-29
Date Accepted: 2022-05-16
Date Published: 2022-06-03
1. Introduction
In recent years, the global rate of production of tires has increased tremendously. It leads to a generation of a large number of waste tires. Three main possibilities exist for the disposal of scrap tires namely landfilling, incineration and recycling. The biggest problem with discarding old tires is that they contain chemicals and heavy metals that leach into the environment as the tires break down. Hence, it becomes indispensable to use waste tires in different civil engineering aspects. Waste tires have been used as fill and embankment materials in different highway applications in the recent past. The use of scrap tires in various forms as lightweight fill could significantly minimize their disposal problem [1]. Furthermore, waste tires as a fill material also provide proper drainage and thermal insulation [2]-[4]. Many researchers have reported that the inclusion of tire chips in sand enhances the shear strength of the fill [2, 5, 6]. Foose et al. [5] investigated the behaviour of sand-tire chips mix using the direct shear test. The researchers reported that the addition of tire chips into the sand increases the friction angle. Reddy and Krishna [7] investigated the performances of sand-tire chips mixture. The researchers observed that tire chips mixed with sand decreased the earth pressure by 50%. Crumb rubber used in the current study is one of the recycled forms of waste tires, which are relatively smaller in size compared to tire chips and shreds. Few studies have been conducted on the effective use of crumb rubber mixed with soil [8]-[9]. It is evident that the influencing factors affecting the optimal design of retaining structures with crumb rubber as a fill material needs further investigation.
Various researchers have studied the effective use of geosynthetics as a reinforcing material in retaining structures [10]-[14]. When geosynthetics are used as reinforcing material, it becomes essential to know their adherence capacity [15]. With the increasing application of geosynthetics in soil reinforcement, the assessment of the mechanical characteristics of geosynthetics and its interaction with the soil is highly desirable. By improving the interaction behaviour of the fill material and the reinforcement, the pullout strength can be increased. Several researchers have performed studies to observe the interaction behaviour of the fill and the reinforcement in recent years [1], [16]-[22]. Various literatures have reported the influence of different types of soil-tire mixtures and geosynthetics on the interface parameters using pullout tests. Tatlisoz et al. [16] conducted the pullout test with tire chips of size ranging from 30-110 mm with sand and sandy silt materials. Higher pullout capacity was observed for the fill with tire chips mixed with sand as compared to other mixes. Ghaaowd and McCartney [21] performed large-scale pullout testing with larger size tire-derived aggregates with sizes up to 300 mm as fill. The researchers used two different geogrids i.e. uniaxial and biaxial as reinforcement. The biaxial geogrid showed higher pullout strength compared to the uniaxial geogrid. Few studies have been conducted on the effect of normal stress on the pullout resistance of geosynthetics. Bernal et al. [1] conducted pullout tests for different types of geosynthetics and tires shreds-sand mixtures as fill. The researchers varied the normal stress between 2-68 kPa. The researchers observed that the pullout strength depends on the type of geosynthetics and normal stress applied. Alfaro et al. [23] conducted the pullout test of geogrid using six different specimen widths. The researchers performed the tests at four normal stresses below 50 kPa. The researchers observed that the maximum effective pullout force increased with the increase in the normal stress. Hence, the above studies reported that the pullout capacity of the geosynthetics depends on the type of the fill material as well as the applied normal stress during pullout tests. However, it can also be noticed from the above studies that the normal stress applied in the pullout tests was relatively low in magnitude. In the current scenario, with increasing traffic loads on the bridges and structures reinforced with geogrids, higher vertical stresses are expected.
Therefore, the current study focuses on the effect of applied normal stress varying from lower to higher magnitudes on the pullout behaviour of the geogrid. Pullout tests were performed with the recycled tire in the form of crumb rubber as fill material. Crumb rubber-sand mixture with mixing ratio of 10:90, 20:80, 30:70, 40:60 and 50:50 were prepared and tested. The results were compared with the sand sample without crumb rubber. The objective of the study described herein was to investigate the feasibility of using crumb rubber as a means to improve the pullout strength and hence enhanced the interface behaviour. This will provide the design engineers the option to select and design the geosynthetics reinforced earthen structures with sand-rubber mixtures as fill. Apart from this, the present study also reports the strain responses of the geosynthetics using pullout tests.
2. Materials
2.1. Fill material
In this study, locally available fine sand mixed with crumb rubber with different proportion was used as the backfill material. Figures 1a-b shows the photographs of the sand and rubber used in the study. Grain size distribution analysis was performed as per the guidelines of ASTM D422 [24]. The sand was found to be poorly graded sand (SP) as per the Unified Soil Classification System (USCS). The grain size distribution curve is shown in Fig. 2. The specific gravity of the sand was found to be 2.67. Apart from sand, crumb rubber was used as a filler mixed with sand in fixed proportions. Grain size distribution for rubber is also shown in Fig. 2. The size of the sand and rubber were kept close to obtain higher particle interaction and a higher degree of homogeneity. The specific gravity of the rubber was 1.04. Optimum moisture content and maximum dry density of all the rubber-sand mixtures were obtained according to ASTM D698 [25]. Shear strength parameters for all the rubber-sand mixtures were obtained by direct shear tests. Table 1 shows the nomenclature, physical properties and shear strength parameter for all the sand-rubber mixtures used in the study. Furthermore, unit weight for all the rubber-sand mixtures was also obtained and shown in Fig. 3. With the increase in the rubber content unit weight of the mixtures was reduced.
2.2. Geogrid
The geogrid used in the study is a biaxial geogrid made of polypropylene having a square aperture of 39 mm × 39 mm. The thickness of the reinforcement is 1.6 mm with a mass per unit area of 230 g/m2
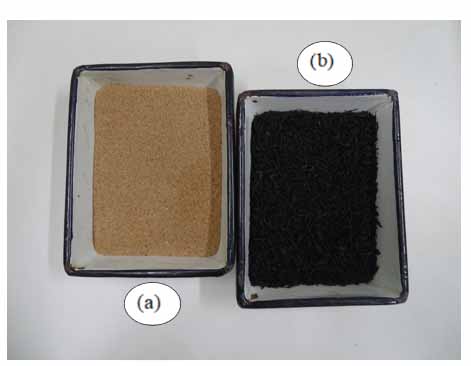
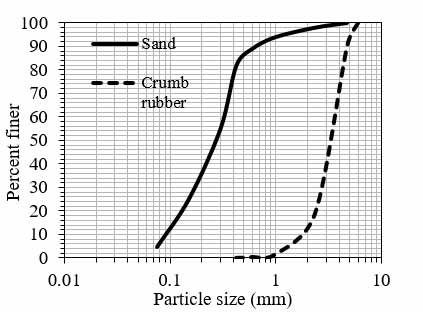
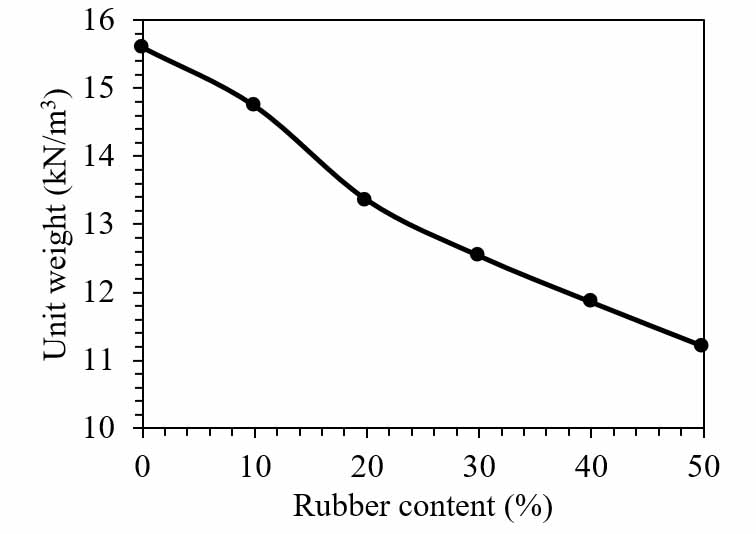
Table 1. Physical properties of sand-rubber mixtures
|
Sample name
|
Crumb rubber content (%) |
Cohesion (kPa) |
Friction angle (degree) |
Maximum dry unit weight (kN/m3) |
Optimum moisture content (%) |
|
CR0 |
0 |
0 |
34 |
16.56 |
7.43 |
|
CR10 |
10 |
2.6 |
38.3 |
15.02 |
6.26 |
|
CR20 |
20 |
4.6 |
41.8 |
13.89 |
5.11 |
|
CR30 |
30 |
6.2 |
44.6 |
12.93 |
4.52 |
|
CR40 |
40 |
6.6 |
43.9 |
11.73 |
3.92 |
|
CR50 |
50 |
5.7 |
41.9 |
10.63 |
3.47 |
The tensile strength of the geogrid was obtained by using the multi-rib tensile test method as per ASTM D6637 [26]. The tensile stiffness (J) of the geogrid was found to be 293 kN/m.
3. Pullout test
Apparatus and sampling
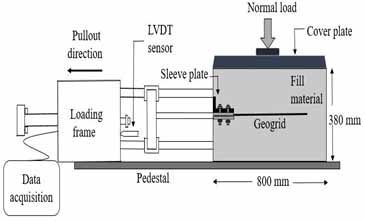
The pullout test was performed as per ASTM D6706 [27]. The pullout box has a plan dimension of 800 mm in length by 550 mm in width and a height of 380 mm. Sleeve plates of thickness 10 mm were attached to the front wall above and below the slot where the geogrid with length 760 mm was attached and pulled. This reduces the lateral load transfer to the rigid front wall of the pullout box. The bottom plate is a horizontal plate fixed to the wall and the top plate is an ‘L’ shaped steel angle having a length and height of 150 mm and a width equal to that of the pullout box. The geogrid specimen was fixed between the two plates, and embedded inside the fill material to ensure confinement. After filling the material, the pullout box was covered by a 25 mm thick steel plate on top of the fill. A rectangular-section beam is mounted on the top of the steel cover plate to provide the normal loading. The pullout loading was applied using a 75 kN capacity computer controlled electro-hydraulic controlled actuator through a steel reaction frame. Tests were conducted at a strain rate of 1 mm/min. The normal stress was also applied with a similar technique and maintained constant throughout the test. Figure 4 shows the schematic view of the pullout testing apparatus used in the study.
Six crumb rubber-sand mixtures were prepared and studied as reported in Table 1. The prepared samples were poured in layers of equal depths into the pullout box without any segregation. All the layers were compacted using a tamping hammer such that a density of almost 90% of the maximum dry density was achieved. After the geogrid and fill were placed, the steel cover plate and the top beam were placed and loading was applied. Tests were conducted at five different normal stresses, i.e., 20 kPa, 40 kPa, 60 kPa, 80 kPa and 100 kPa. The normal stress range was planned to cover the possible modes of failure (i.e., slippage and rupture) of the geogrid. A maximum horizontal displacement of 80 mm was used as a practical limit for deformations in the field. A load cell and linear variable differential transformer (LVDT) were mounted on the pullout loading system to measure the pullout load and the displacement, respectively. These instruments were connected to a data acquisition system. Strain response of the geogrid was also measured during the pullout loading. Strain gauges with a resistance of 350 Ω were attached at a distance of 300 mm from the end of the sleeve plate.
4. Analysis of test results
4.1. Effect of normal stress on pullout resistance
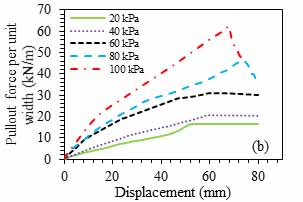
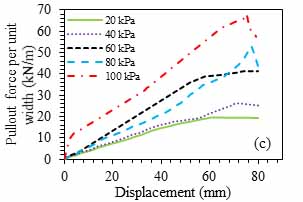
Pullout resistance variation with horizontal displacement was studied for five different normal stresses. Pullout force per unit width versus displacement curves shown in Fig. 5 indicates a progressive increase in the pullout resistance with the confinement stress. Figure 5a shows the variation of the pullout forces with horizontal displacement for only sand conditions. The different trends in the pullout curves are due to the effect of confining stress. It was observed that the pullout force increased with an increase in normal stress till the peak value. Beyond the peak, the pullout force was found to decrease. The peak pullout was observed at lower horizontal displacement at lower normal stress (20, 40 and 60 kPa). With an increase in the normal stress, the peak pullout was observed at higher displacement. At 100 kPa normal stress, the peak pullout strength of the geogrid sample was reached at the highest displacement. The increase in the normal stress on the sample increases the frictional and passive resistance of the transversal ribs which increases the overall pullout resistance. Figure 5b-d shows the pullout force vs horizontal displacement variation for 20:80, 30:70 and 40:60 rubber-sand mixtures, respectively. The 10:90 rubber-sand mixture graph shows a similar trend as 20:80 and the graph for the 50:50 mixture shows a similar trend as 40:60, hence these two figures are not shown here.
The maximum pullout capacity was found to increase by 61% for 30:70 rubber-sand content compared to 0 % at 100 kPa normal stress. Pullout increased by 51% for a rubber-sand mixture of 40:60 at the same normal stress. It was observed that for rubber-sand content from 0:100 to 30:70, slippage failure occurred at lower normal stresses (20, 40 and 60 kPa) and rupture failure occurred at the higher
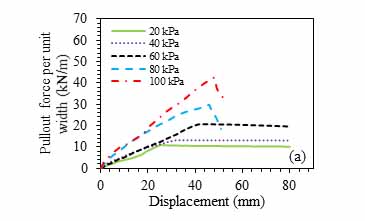
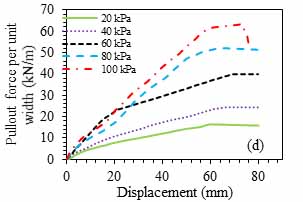
stress values (80 and 100 kPa). However, at higher rubber-sand content of 40:60 and 50:50, rupture failure has occurred only at 100 kPa. The mode of failure of the geogrid specimen in the rubber-sand mixtures was found to depend on the normal stress applied to the sample. After the maximum pullout was reached, slippage of the geogrid was observed due to which the pullout force became constant or started decreasing. In the other case, geogrid was found to break due to rupture or tensile failure, due to which a sudden fall of the pullout force was noticed. Similar observations were reported by Bernal et al. [1] and Tanchaisawat et al. [18]. When the normal stress is applied to the sample, the fill material i.e., the rubber-sand mixtures tend to dilate. However, due to the horizontal and vertical confinement, the dilation of the material is restrained. Hence, the normal stress at the interface increases. This effect is more apparent in the case of higher normal stress due to which higher friction is generated leading to the rupture of the geogrid.
4.2. Pullout resistance factor (F*)
The geogrid opposes the pullout by developing shear resistance on both the planes of the geogrid and passive resistance against the transverse ribs. Both these mechanisms are mobilized as a result of elongation. The maximum pullout forces obtained at different normal stresses at different rubber-sand mixtures were used to calculate the pullout resistance factor (F*). It represents the interaction between backfill material and geogrid specimen as reported by Christopher et al. [28]:
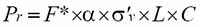
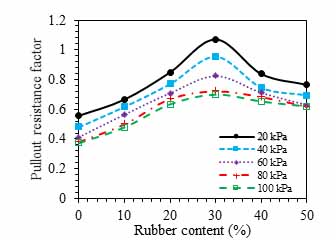
where, Pr is the pullout resistance per unit width in kN/m; L is the reinforcement length in the anchorage zone in m; σ’v is the effective vertical stress in kPa; α is the scale effect correction factor which is taken as 0.8 for geogrid [29], C is the effective unit perimeter of geogrid which is equal to 2 and F* is the pullout resistance factor. The interaction compares the soil-geosynthetic interface strength with the soil shear strength. Tanchaisawat et al. [18] reported that the interaction coefficient represents the efficiency of the geosynthetics in transferring the stresses from adjacent soil particles to the geosynthetic specimen. Figure 6 shows the effect of normal stress on the variation of pullout resistance factor for different rubber-sand mixtures.
The maximum and minimum values of F* are 1.07 and 0.38, respectively which are within the range reported by Tatlisoz et al. [16] and Ghaaowd and McCartney [21]. The pullout resistance factor was minimum at 0% rubber content. With the increase in the rubber content up to 30%, the value of F* was found to increase for all the normal stress values. F* was found to be 92% higher at 30% rubber as compared to no rubber content at 20 kPa normal stress. The increment was also observed at 10:90 and 20:80 rubber-sand mixtures, however, it was less compared to 30:70. F* was found to be 50.4% higher at 40% rubber compared to 0%. Hence, with further addition of rubber (i.e. 40% and 50%), F* was found to reduce. The reason for this observation is the angle of internal friction, which was found to increase up to 30% rubber content, after which it decreased. The geogrid opposes the pullout by developing shear resistance on both the planes of the geogrid and passive resistance against the transverse ribs. Similar patterns were observed for other normal stresses as well.
4.3. Strain analysis
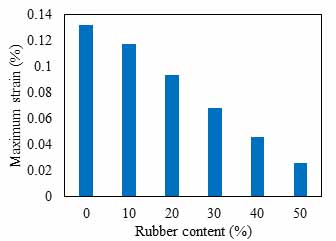
Analysing the strain responses of the geogrid at different normal stresses helps in studying the interaction behaviour of the geogrid specimen. It also helps the engineers in designing the geogrid reinforced structure for different vertical loading. It was observed that with the addition of crumb rubber in the sand, strain values decreased. This is because rubber is lighter as compared to sand as shown in Fig. 3, which reduces the overburden load at the geogrid. Figure 7 shows the variation of maximum strain observed at 100 kPa normal stress. It should be noted that the maximum strain presented is the strain obtained at a distance of 300 mm from the end of the sleeve and it may not be the maximum strain of the geogrid specimen. The geogrid strain was found to reduce with the increase in rubber content. Strain value reduced by over 48% at a rubber content of 30% as compared to no rubber content. The strain values decreased further with the increase in the rubber content.
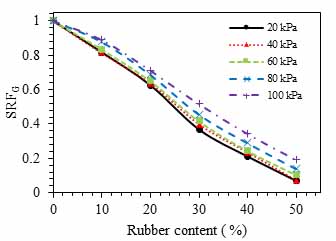
Furthermore, the strain response was compared in terms of strain reduction factor in geogrid (SRFG) at different normal stresses. It is defined as the ratio of the maximum strain value at any specific rubber-sand mixture to the maximum strain value at no rubber content (0:100). Figure 8 shows the variation between rubber content and the SRFG. The strain was found to reduce to 71% at 20:80 rubber mixture compared to no rubber content at 100 kPa normal stress. While it was reduced to 51.6% at 30:70 rubber-sand mixture for the same normal stress value. With the further addition of rubber, the strain was found to reduce as well. Similar patterns of strain reduction were observed for other normal stress values.
5. Conclusions
The pullout behaviour of a biaxial geogrid at different sand-crumb rubber sand mixtures was studied in this paper. In this contrast, a series of laboratory pullout tests were conducted. Five different normal stresses were applied to each rubber-sand mixture sample during the experimental study. The maximum pullout resistance was found to increase with the increase in normal stress. The maximum pullout resistance was obtained at 30% rubber, after which it decreased. Pullout resistance was found to increase by 61% for 30% rubber at 100 kPa normal stress. While it was found that the increment was about 51% at 40% rubber content. Pullout resistance factors were calculated for all the rubber-sand mixtures and it was noticed that the factor increased up to 30% rubber content. The maximum value was obtained at 30% rubber i.e., 1.07, which was 92% higher than with only sand backfills. Further addition of rubber to the sand led to a reduction in the resistance factor. Strain at the geogrid was also analysed during pullout loading. The maximum strain was observed at no rubber content. With the increase in rubber, the strain was found to decrease. Strain reduction factor was reduced to 51.6% at 30:70 rubber-sand mixture compared to no rubber content at 100 kPa normal stress. Hence, from the overall analysis, it can be concluded that a crumb rubber-sand mixture with 30% rubber is recommended to be used as fill material.
References
[1] R. Bernal, R. Salgado, R. H. Swan and C.W. Lovell, “Interaction between tire shreds, rubber:sand and geosynthetics,”Geosynthetics International, 4(6) pp. 623-643, 1997. View Article
[2] D. Humphrey, T. Sandford, M. Cribbs and W. Manion, "Shear strength and compressibility of tire chips for use as retaining wall backfill," Transp. Res. Rec. 1422, Transportation Research Board. Washington, D.C., pp. 29-35, 1993.
[3] T. Edil, and P. Bosscher, "Engineering properties of tire chips and soil mixtures," Geotech. Testing J., 17(4), pp. 453-464, 1994. View Article
[4] C. Benson, M. Olson, and W. Bergstrom, "Temperatures of an insulated landfill liner," Transp. Res. Rec. 1534, Transportation Research Board, Washington, D.C., pp. 24-31, 1996. View Article
[5] G. Foose, C. Benson, and P. Bosscher, "Sand reinforced with shredded waste tires,” J. Geotech. Engrg., ASCE, 122(9), pp. 760-767, 1996. View Article
[6] A. Bernal, R. Salgado, and C. Lovell, "Laboratory study on the use of tire shreds and rubber-sand in backfills and reinforced soil applications," Final Rep., Indiana Dept. of Transp., Joint Hwy. Res. Proj. Rep. No. FHWAIlNIJHRP-96, Purdue Univ., West Lafayette, Ind., 1996. View Article
[7] S. B. Reddy, A. M. Krishna, “Recycled tire chips mixed with sand as lightweight backfill material in retaining wall applications: an experimental investigation,” International Journal of Geosynthetics and Ground Engineering, 1(4), pp. 1-11, 2015. View Article
[8] A. Edinçliler, G. Baykal, A. Saygılı, “Influence of different processing techniques on the mechanical properties of used tires in embankment construction,” Waste Management, 30(6) pp. 1073-1080, 2010. View Article
[9] J. S. Yadav, and S. K. Tiwari, “A study on the potential utilization of crumb rubber in cement treated soft clay,” Journal of Building Engineering, 9, pp. 177-191, 2017. View Article
[10] M. M. El-Emam, and R. J. Bathurst, “Influence of reinforcement parameters on the seismic response of reduced-scale reinforced soil retaining walls,” Geotextiles and Geomembranes, 25(1), pp. 33-49, 2007. View Article
[11] G. M. Latha, and A. M. Krishna, “Seismic response of reinforced soil retaining wall models: influence of backfill relative density,” Geotextiles and Geomembranes, 26(4), pp. 335-349, 2008. View Article
[12] A. K. Panah, M. Yazdi, and A. Ghalandarzadeh, “Shaking table tests on soil retaining walls reinforced by polymeric strips.” Geotextiles and Geomembranes, 43(2), pp. 148-161, 2015. View Article
[13] S. K. Nandan, T. S. Bandyopadhyay, and P. Chakrabortty, “Effect of Backfill Sand Density on Dynamic Response of Mechanically Stabilized Earth (MSE) Walls.” In Proceedings of the Indian Geotechnical Conference 2019, Springer Singapore, pp. 817-827, 2021. View Article
[14] T. S. Bandyopadhyay, P. Chakrabortty, and A. Hegde, “Shake Table Studies to Assess the Effect of Reinforced Backfill Parameters on Dynamic Response of MSE Walls,” In Ground Improvement Techniques: Select Proceedings of 7th ICRAGEE 2020, Springer Singapore, pp. 227-237, 2021. View Article
[15] M. L. Lopes, and M. Ladeira, “Role of specimen geometry, soil height and sleeve length on the pull-out behaviour of geogrids,” Geosynthetics International, 3, No. 6, pp. 701–719, 1996. View Article
[16] N. Tatlisoz, T. B. Edil and C. H. Benson, “Interaction between reinforcing geosynthetics and soil-tire chip mixtures,” Journal of Geotechnical and Geoenvironmental Engineering, 124(11), pp. 1109-1119, 1998. View Article
[17] N. Moraci and P. Recalcati, “Factors affecting the pullout behaviour of extruded geogrids embedded in a compacted granular soil,” Geotextiles and Geomembranes, 24(4), pp. 220-242, 2006. View Article
[18] T. Tanchaisawat, D. T. Bergado, P. Voottipruex and K. Shehzad, “Interaction between geogrid reinforcement and tire chip–sand lightweight backfill,” Geotextiles and Geomembranes, 28(1), pp. 119-127, 2010. View Article
[19] S. H. Sadat Taghavi, and M. Mosallanezhad, “Experimental analysis of large-scale pullout tests conducted on polyester anchored geogrid reinforcement systems,” Canadian Geotechnical Journal, 54(5), pp. 621-630, 2017. View Article
[20] A. Hegde and R. Roy, “A comparative numerical study on soil–geosynthetic interactions using large scale direct shear test and pullout test,” International Journal of Geosynthetics and Ground Engineering, 4(1), 1-11, 2018. View Article
[21] I. Ghaaowd and J. S. McCartney, “Pullout of geogrids from tire-derived aggregate having large particle size,” Geosynthetics International, 27(6) 671-684, 2020. View Article
[22] T. S. Bandyopadhyay, P. Chakrabortty and A. Hegde, “Pullout behaviour of geogrid in sand-crumb rubber mixtures,” Proceedings of the 7th World Congress on Civil, Structural, and Environmental Engineering (CSEE'22) Lisbon, Portugal Virtual Conference – April 10 – 12, Paper No. ICGRE 180, 1-9, 2022.
[23] M. C. Alfaro, S. Hayashi, N. Miura and K. Watanabe, “Pullout interaction mechanism of geogrid strip reinforcement,” Geosynthetics International, 2(4), pp. 679-698, 1995. View Article
[24] ASTM D422, “Standard test method for particle-size analysis of soils,” ASTM International, West Conshohocken, PA, USA, 2007.
[25] ASTM D698, “Standard Test Method for Laboratory Compaction Characteristics of Soil Using Standard Method Effort (600 kN-m/m3),” ASTM International, West Conshohocken, PA, USA, 1991.
[26] ASTM D-6637, “Standard Test Method for Determining the Tensile Properties of Geogrid by the Single or Multi-rib Tensile Method,” ASTM International, West Conshohocken, PA, USA, 2011.
[27] ASTM D-6706, “Standard Test Method for Measuring Geosynthetic Pullout Resistance in Soil,” ASTM International, West Conshohocken, PA, USA, 2013.
[28] B. R. Christopher, S. A. Gill, J. P. Giroud, I. Juran, J. K. Mitchell, F. Schlosser and J. Dunnicliff, “Reinforced Soil Structures,” Volume I: Design and Constructions Guidelines Report, FHWA RD- 89-043. U.S. Department of Transportation Federal Highway Administration, McLean, VA, USA, 1990.
[29] V. Elias, B. R. Christopher and R. Berg, “Mechanically Stabilized Earth Walls and Reinforced Soil Slopes, Design & Construction Guidelines,” Federal Highway Administration (FHWA) SA-00-043. National Highway Institute, Federal Highway Administration, Washington, DC, USA, 2001.