International Journal of Civil Infrastructure (IJCI)
ISSN: 2563-8084

Volume 5 - Year 2022- Pages 85-94
DOI: 10.11159/ijci.2022.012
Back Calculation of various Geomechanical Properties of Pare Rock Mass
Pawan Kumar Singh1 (Corresponding Author), and Diganta Goswami2, Ranjeet Bahadur Singh3
Assam Engineering College
Department of Civil Engineering, Assam Engineering College, Guwahati 781013, Guwahati, India
singhpawank123@gmail.com, digantagoswami.ce@aec.ac.in, rbsinghntpc@gmail.com
Abstract - With the interest of overcoming certain challenges like floods, shortage of electricity, drinking water, etc., river valley projects are taken which can serve the required purposes in the long run. Generally, the river valley projects which involve the construction of dam are situated in gorges where constructions are done through the rock masses. So, the specifications of the supports provided at the site can be utilized again for estimating the behaviour of the rock mass with the help of back calculation technique. Further, the determination of the properties of the rock mass at the site also aid in the assessment of stability, which can be done with the help of in-situ tests as well as laboratory tests. Since it is not feasible to conduct a large number of in-situ tests at site, one can find it advantageous to use the tools like Finite element codes like Plaxis 3D AE for determining the properties of the rock mass. In this research work, an attempt has been made to derive the properties of the rock mass by back calculation technique using the results of in-situ Plate load test. An appropriate material modelling is very important in any Finite Element analysis to arrive at solutions close to the exact values, necessitating the selection of appropriate constitutive model. In this context, the suitability of the four constitutive models viz. Jointed Rock mass model, Hoek- Brown model, Mohr-coulomb model and Hardening Soil model, appropriate to Pare Rock mass is examined. Through this study, a systematic approach has been adopted for the simulation of rock mass properties of the Pare Hydroelectric Project site with the help of numerical modelling. In addition to this, two different parameters viz. RMSE and MAPE values are computed to check the discrepancies among the field and the FEM values in the constitutive models for both loading and unloading conditions.
Keywords: Pare Hydroelectric Project, Plate load test, Finite Element Method, Back Calculation Technique, Root Mean Square Error, Mean Absolute Percentage Error.
© Copyright 2022 Authors - This is an Open Access article published under the Creative Commons Attribution License terms. Unrestricted use, distribution, and reproduction in any medium are permitted, provided the original work is properly cited.
Date Received: 2022-08-14
Date Accepted: 2022-08-30
Date Published: 2022-09-01
1. Introduction
The demand for power in India is rapidly increasing due to development requirements and so also the construction of more hydroelectric power projects. Construction of the various components of a river valley project tend to create instability in the rock mass, which is often water charged too, primarily due to alteration of in-situ stress conditions. For a safe design and execution of these elements, the behaviour of the geo-material involved, namely the rock mass, needs to be understood thoroughly and predicted well. As most of the hydro-electric power projects of India are in the Himalayan region and many more are likely to come up in this region, the behaviour of the Himalayan rock mass, with respect to construction of their various components such as dam foundation, powerhouse cavern, Headrace tunnels, surge shaft etc., needs to be understood and predicted with higher confidence level. In-situ tests like Plate load test, Tri-axial shear test, Direct shear test etc. represent the properties in a more sophisticated way than the other methods. However, multiple numbers of tests requires more resources which becomes an economic restrain, as the resources available are limited [1]. Further, the zone of influence in case of plate load test is limited only to a minimum depth from the top surface of rock formation. Therefore detailed evaluation of design models of the site cannot be made from this limited number of test results, encouraging the geotechnical engineers to go for numerical modelling or forces them to develop empirical correlations [2]. Back analyses are also often needed to be carried out to ascertain appropriate rock mass parameters like deformation modulus, sub-grade modulus, Poisson’s ratio etc. The deflection profile is often taken into account in the determination of the in-situ elastic modulus while performing back calculation analysis [3]. Singh & Goel (2011) [4] states that repeated cycles of back analysis and forward analysis eliminates many uncertainties in understanding the rock mass behaviour. The results obtained from back calculation techniques may differ depending on the assumptions, methods, and material models considered in the study [5]. So, a combination of forward calculation and backward analysis, from the field instrumented data capturing the actual field behaviour, during construction needs to be incorporated, to arrive at some practically correct geo-material properties. In spite of the fact that the soil mass is highly heterogeneous, the notion of a single soil model to accurately predict the soil behaviour seems to be inappropriate [6].
2. The Study Area
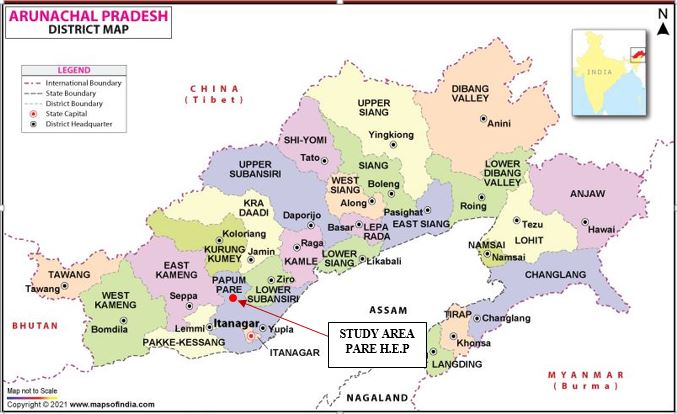
The present study has been carried out at the site of the proposed Pare hydroelectric project across Pare River situated in Papum Pare district in Arunachal Pradesh. The project has been proposed to generate about 110 MW of power in a power house, which will be produced with the help of a tunnel supplying a combined discharge of 180 cumecs from Pare and Ranga Nadi Hydro Electric Project – Stage I. The area of the Power project is represented by upper Siwalik sub-group of the sub-Himalaya range. The location of Pare Hydro-Electric Power Project (H.E.P) has been shown in figure 1.
3. Methodology
The aim of the first phase of work is to compile the results obtained from the geological and geotechnical investigative studies and then to use the parameters of support system used at the site for the computation of rock mass rating. The next phase deals with the simulation of the observed site results of plate load test with the results obtained from the finite element method using different soil models in PLAXIS 3D AE. The characteristic of soil profiles and soil parameters are identified from field and laboratory tests. The back calculation was done by using PLAXIS 3D AE. The Mohr-Coulomb Model, Hoek and Brown Soil Model, Hardening Soil Model and Jointed Rock Model are used as a material model for simulation. At last the results obtained from PLAXIS 3D AE were compared with those obtained from field data using numerous trial and error procedure to get the material properties of the Pare rock mass.
4. Geological and Geotechnical studies
The rocks site of Upper Siwalik formation mostly has sandstone. The geological profile at the rocks of Upper Siwalik formation comprises of repetitive sequence of soft, friable, medium grained, brownish, greenish and grey coloured, moderately jointed, profusely current bedded, salt-pepper textured sandstone, pebble sandstone and pebble beds with minor silt partings occur in the project area[7]. Highly overburden in rocks have been observed in the HRT alignment, surge shaft, penstock and power house areas.
To determine the geo-mechanical properties of the test conducted area, different types of field and laboratory tests including Plate load test, petrographic measures, In situ direct shear test, and unconfined compressive strength test were carried out.
4.1. Laboratory tests and Field tests
The shear strength parameters (C and Ф) has been obtained with the help of the laboratory tests viz. Unconfined Compression test (Saturated condition), Triaxial test for the samples collected from the dam site and In situ Direct shear test for rock to rock interface at the dam site. However, it is emphasized that presence of local discontinuities / weaker zones such as fissures, fractures and joints, faults if any, within the foundation area, are to be taken into due consideration while judiciously adopting shear strength parameters and other derived quantities from the in-situ tests for design. The average of the values of angle of internal friction and cohesion as obtained from various laboratory and field tests corresponding to Pare rock mass have been presented in table 1 and 2 respectively.
Table 1. Average Value of cohesion ‘C’ at Pare H.E.P Site
|
Sl. No. |
Type of Test |
Value(kN/m2) |
|
1 |
Tri axial test (UU) |
115 |
|
2 |
In-situ Shear test |
121.7 |
|
3 |
Unconfined compression test |
141,144,148,144,129 (Five Readings) |
|
4 |
Unconfined compression test |
104,148,164,142,148(Five Readings) |
|
5 |
Tri axial test |
76,88 (Two Readings) |
|
6 |
Tri axial test |
151 |
|
Average value of Cohesion (C) |
131.6 |
|
Table 2. Average Value of Angle of Internal Friction (Φ) at Pare H.E.P Site
|
Sl. No. |
Type of Test |
Value |
|
1 |
Tri axial test(UU) |
43.64° |
|
2 |
In-situ Shear test |
49.92° |
|
3 |
Unconfined compression test |
50°,48°,52°,48°,68°(Five Readings) |
|
4 |
Unconfined compression test |
32°,48°,52°,54° (Four Readings) |
|
5 |
Tri axial test |
51°,46° (Two Readings) |
|
6 |
Tri axial test |
48° |
|
Average value of Angle of internal friction (Φ) |
49.64° |
|
4.1.1 Plate load tests
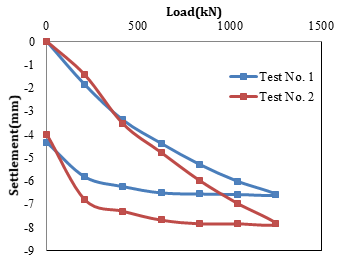
The load-settlement curve from two plate load tests conducted at two locations at Pare is shown in figure 2.The Plate load test was conducted following the guidelines mentioned in IS 1888-1982 [8], for the proposed Pare H.E. Project at Dam axis. The vertical load was applied on the test plate (Plate dimension 0.45 m x 0.45 m, thickness 25mm) by means of a hydraulic jack against rolled steel joist capable of providing reaction and the settlement was recorded by means of two dial gauges of 0.01 mm sensitivity each positioned on either side of the plate and held by datum bars resting on immovable support on either side of the plate. The design load was estimated to be about 5883.99 kN/sqm. Water table was not encountered at the site and so the surface was kept saturated by artificial submergence.
It is observed from figure 2 that, with the increase in load, the increase in settlement is not proportional, rather the rate of settlement decreases with the rate of increase of load. This is possible only when the material is gaining in strength with the increase in the load. There may be closure of micro-cracks in the rock mass for which it exhibits a trend as obtained in these load-settlement curves.
5. Validation Parameters
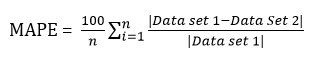
Two validation parameters viz. Root Mean Square Error (RMSE) & Mean Absolute Percentage Error (MAPE) has been used for the verification of the back calculation done in the present work.
RMSE is defined by the expression given below,

Where n is the total number of observations.
Similarly, MAPE is given by the expression,
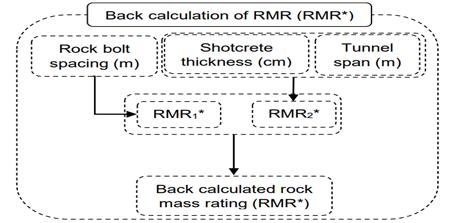
6. Back-Calculation of RMR
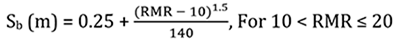
The RMR system of rock mass classification is one of the oldest system and the preferred classification system on which majority of the tunnel engineers rely upon. Continuous modifications have been made in this system considering the problems faced by the tunnel designers. In this context, a great contribution has been made by Lowson and Bieniawski, 2013 [9]. They came up with a new idea of establishing a relationship between bolt spacing and RMR presented in Eqs. (3, 4 & 5) and a support chart based on span and RMR for a given thickness of shotcrete. They considered thickness of Shotcrete as the function of Tunnel span and RMR. Their contribution has proven to be a useful tool for predicting the accuracy of the support system actually installed at the site.
The rock bolt spacing proposed by Lowson and Bieniawski can be calculated as follows:


The purpose of back-calculation is to compare the RMR values (RMR89) computed using RMR classification system and that obtained from back-calculation. The RMR back-calculated from bolt spacing is RMR1* and that obtained from shotcrete thickness and tunnel span is RMR2*. The back-calculated RMR (RMR*) is taken to be the average of RMR1* and RMR2* as conferred through Figure 3.
7. Numerical Modelling
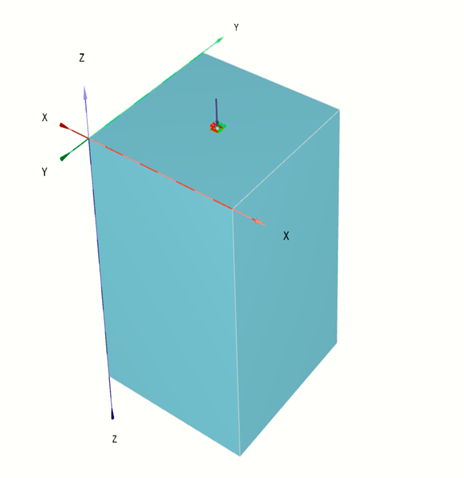
The simulation of Plate load test with field reports are based on FEA, which has been incorporated using PLAXIS 3D AE. The dimension of the three dimensional model has been taken as 8m X 8m with a depth of 10 m, so that the boundary effect is negligible. The finite element model of the Plate load test is shown in figure 4. The parameters of soil have been taken out from the field and laboratory tests. 15 noded element is used for the model. The rock mass domain is discretised by 10 noded-tetrahedral element. The domain has been meshed with 10 noded tetrahedral element with medium coarseness. This element gives rise to a parabolic interpolation of displacements.
Steel plate is modelled as an elastic element. The size of steel plate is taken as 450mmX450mm with 25mm thickness. Two dimensional six noded triangular element is used to mesh the plate. The plate is meshed as plate elements with modulus of elasticity, Esteel= 2 x E8 kN/m2, Poisson’s ratio, ν= 0.3, Unit weight, γ= 78 kN/m3.
Point load is applied vertically on the plate. Self-weight of the plate is also considered for simulation process. External load system is increased in a gradual manner and is allowed to rebound by reducing the load from phase to phase in each cycle. The analysis consists of 5 cycle.
The FEM analysis of Plate load test is modelled with a number of simulations by changing the values of the soil parameters C, Ф, and E. Some of the values of elastic modulus is collected from the back calculation of the plate load test by trial-error method. The aim of the simulation process is to compare the results obtained from both the FEA and the field test.
Table 3 shows the material properties of the rock mass corresponding to different soil models used for simulation. The material properties of the model which best matches with the field plot have been presented in table 3.
Note: γunsat - Unsaturated unit weight ; γsat - Unsaturated unit weight; e - Void ratio; ν' - Poisson’s ratio for unloading / reloading; E50 ref - Secant stiffness in standard drained Triaxial test; Eoedref - Tangent stiffness for Primary Oedometer loading; Eurref - Unloading/ reloading stiffness from drained triaxial test; Cref' - (Effective) cohesion; Ф - (Effective) angle of internal friction; Ψ - Dilatency angle; Konc- Ko-value for normal value of consolidation; Pref- Reference stress for stiffnesses ; ;σ - Effective vertical stress; mi - Intact rock parameter; GSI - Geological Strength Index; D - Disturbance factor; G2- Shear modulus perpendicular on ‘Plane 1’ direction; α 1 - Dip; α 2 - Strike.
Table 3. Physical and Mechanical properties of the rock mass corresponding to the soil models for Finite Element Modelling
|
Geomaterial modelling |
Mohr Coulomb Model |
Hoek – Brown Model |
Jointed Rock Model |
Hardening Soil Model |
|
Drainage type |
Drained |
Drained |
Drained |
Drained |
|
γunsat(kN/m3) |
17.542 |
17.542 |
17.542 |
17.542 |
|
γsat(kN/m3) |
20.44 |
20.44 |
20.44 |
20.44 |
|
e |
0.422 |
0.422 |
0.422 |
0.422 |
|
ν' |
0.2 |
0.25 |
0.2 |
0.2 |
|
E50 ref(kN/m2) |
3xE5 |
2.7xE5 |
3xE5 |
3xE5 |
|
Eoedref(kN/m2) |
- |
- |
- |
3xE5 |
|
Eurref(kN/m2) |
- |
- |
- |
2xE6 |
|
Cref'(kN/m2) |
131.6 |
- |
105.3 |
131.6 |
|
Ф |
49.64 |
- |
49.6 |
49.64 |
|
Ψ |
0 |
600 |
0 |
- |
|
Konc |
- |
- |
- |
0.2569 |
|
PrefkN/m2 |
- |
- |
- |
100 |
|
Zref |
0 |
- |
- |
0 |
|
skN/m2 |
- |
1500 |
- |
0 |
|
C’inckN/m2 |
0 |
- |
- |
0 |
|
mi |
- |
21 |
- |
1 |
|
GSI |
- |
90 |
- |
- |
|
D |
|
0 |
- |
- |
|
G2(kN/m2) |
- |
- |
1.8xE5 |
- |
|
α 1 |
- |
- |
400 (Plane 1) |
- |
|
400 (Plane 2) |
||||
|
450 (Plane 3) |
||||
|
α 2 |
- |
- |
1100 (Plane 1) |
- |
|
1500 (Plane 2) |
||||
|
1600 (Plane 3) |
8. Results
8.1 Back-Calculated RMR
The values of the RMR has been calculated using the back calculation procedure given by Lawson & Bieniwaski, 2013 as presented in table 4. The input parameters i.e. the span of the HRT is 9.0m and the thickness of shotcrete provided has been taken to be 110 mm respectively as obtained from the site details. Table 4 shows the values of back-calculated RMR for only the first 5 Chainages and its deviation from the value obtained using RMR classification in terms of statistical parameters MAPE and RMSE has been presented in table 5.
Table 4. Back calculation of RMR* of Pare Rock Mass
|
Tunnel Meter |
Bolt Spacing actually provided |
RMR Calculation using bolt spacing (RMR1*) |
RMR calculation using span and Shotcrete Thickness, (RMR2*) |
Avg. RMR (RMR*) |
|
1165 |
1 |
33 |
38 |
35.5 |
|
1168 |
1 |
33 |
38 |
35.5 |
|
1170 |
1 |
33 |
38 |
35.5 |
|
1171 |
1 |
33 |
38 |
35.5 |
|
1173 |
1 |
33 |
38 |
35.5 |
Table 5. Validation of the Back Calculation of RMR
|
Validation Parameter Method Adopted → ↓ |
MAPE (%) |
RMSE |
|
Bieniawski, 1989 |
32.22 |
11.72 |
From the validation process, it has been found that the back calculation performed is observed to be in a reasonable agreement with the results obtained using the recommendations of Bieniawski, 1989 considering a higher degree of variability in the properties of the rock mass at the site of Pare.
7.2 Back Calculation using Plate Load Test
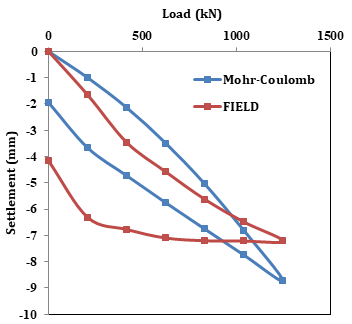
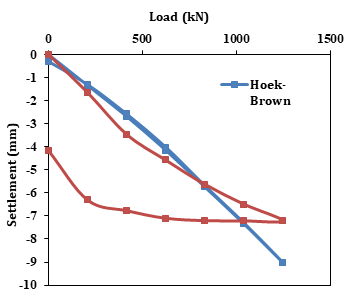
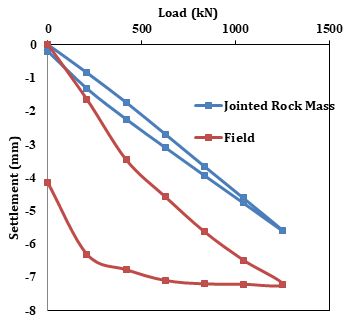
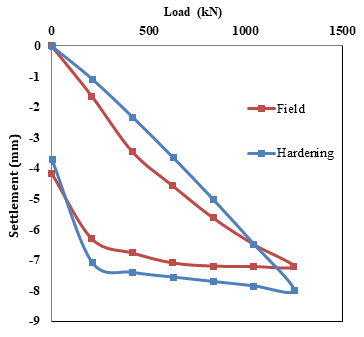
The experimental load-settlement curves obtained from Plate load test are compared with the numerical results obtained using the constitutive models viz. Mohr-coulomb model, Hoek-Brown model, Jointed Rock model and Hardening soil model as shown in the figures 5, 6, 7 and 8 respectively.
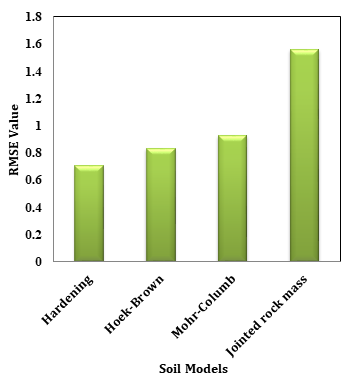
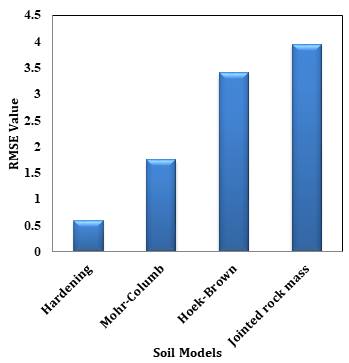
The values of RMSE corresponding to each soil model has been computed for both the loading as well as unloading phases using Eq. 1 and has been shown in table no. 6.
Table 6. RMSE values obtained for Soil Models
|
SI No. |
Soil Model |
Phase |
RMSE |
|
1 |
Mohr-coulomb model |
Loading |
0.932 |
|
Unloading |
1.75 |
||
|
2 |
Hoek-Brown model |
Loading |
0.836 |
|
Unloading |
3.4 |
||
|
3 |
Jointed Rock mass model |
Loading |
1.563 |
|
Unloading |
3.9511 |
||
|
4 |
Hardening soil model |
Loading |
0.706 |
|
Unloading |
0.5864 |
It is observed from Table 6 that for Mohr – Coulomb model, although RMSE is 0.932 in the loading, during unloading the RMSE is 1.75, which is very high. Therefore, it may be stated that the Mohr – Coulomb model does not reflect the Pare rock mass behaviour well. The unloading behaviour is not at all reflected by the Hoek & Brown Criteria either as RMSE (Ref. Table 6) is found to be 3.4 for unloading stage which is very high. The trend of both the loading and unloading curve is not found to match with the field plate load test data. Again, in case of Jointed Rock mass Model, the RMSE value is found to be 3.9511 for unloading stage which is very high as per Table 6. While in case of Hardening soil model good agreement is found to exist between the two. Here, RMSE is found to be 0.5864 for unloading stage, which shows a very good agreement between field and FEM values.
Figure 9 and 10 displays a comparison of the deviations in loading and unloading respectively, in terms of Root Mean Square Error (RMSE), for the four geo-material model, namely Hardening Soil (HS) model, Hoek – Brown model, Mohr – Coulomb model and Jointed Rock Mass model.
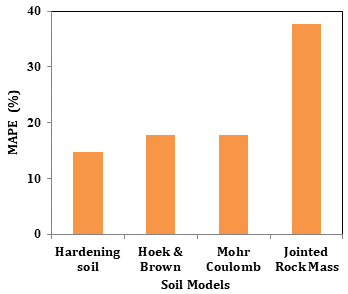
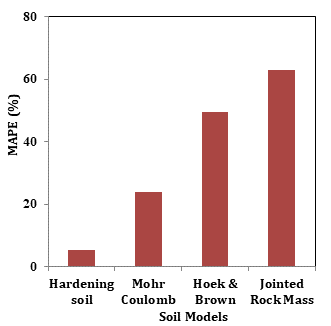
The values of MAPE corresponding to each soil model has been computed for both the loading as well as unloading phases using Eq. 2 and has been shown in table no. 7.
Table 7. MAPE values obtained for Soil Models
|
SI No. |
Soil Model |
Phase |
MAPE |
|
1 |
Mohr-coulomb model |
Loading |
17.86 |
|
Unloading |
23.87 |
||
|
2 |
Hoek-Brown model |
Loading |
17.79 |
|
Unloading |
49.55 |
||
|
3 |
Jointed Rock mass model |
Loading |
37.62 |
|
Unloading |
67.76 |
||
|
4 |
Hardening soil model |
Loading |
14.81 |
|
Unloading |
5.33 |
It is observed from Table 7 that for Mohr – Coulomb model, although MAPE is 17.86 in the loading, during unloading the MAPE is 23.87, which is very high. Therefore, it may be stated that the Mohr – Coulomb does not reflect the Pare rock mass behaviour well. Again, the unloading behaviour is not at all reflected by the Hoek & Brown Criteria either as the MAPE (Ref. Table 7) is found to be 49.55 for unloading stage which is very high. The trend of both the loading and unloading curve is not found to match with the field plate load test data. MAPE is found to be 67.76 for unloading stage in case of Jointed Rock mass Model which is very high as per Table 7. However, for Hardening soil model, good agreement is found to exist between the two where MAPE is found to be 5.33 for unloading stage.
Figure 11 and 12 displays a comparison of the deviations in loading and unloading respectively, in terms of Mean Absolute Percentage Error (MAPE), for the four geo-material model, namely Hardening Soil (HS) model, Hoek – Brown model, Mohr – Coulomb model and Jointed Rock Mass model.
9. CONCLUSION
Back Calculation Analysis showed that the values of RMR obtained using Bieniawski, 1989 are in good agreement with that obtained from the Back Calculation. So, it can be inferred that the supports provided at the site of Pare H.E.P are sufficient to bear the load developed due to the underground excavation at the site.
Further, the case study of load-settlement plot of plate load test at site of Pare, Arunachal Pradesh is simulated with the help of several non-linear finite element processes. The four main models used in this study are Hoek & Brown soil model, Mohr-coulomb model, Hardening soil model and Jointed rock model. A large number of trials have been taken corresponding to each soil model, but the results of the best suitable cases have been presented for each soil model. From the analysis, it has been concluded that:
- The Hoek & Brown soil model, Jointed rock model and Mohr-Coulomb model shows linear response whereas the hardening soil model shows non-linear behaviour.
- Hardening soil model is found to be more usable in the simulation of different soil model.
- The value of the validation parameters namely “RMSE” and “MAPE” is found to be lowest during both loading and unloading stage.
- The trends of both loading and unloading curves are in good agreement with that obtained from the in-situ Plate Load Test.
- Hence, the physical and mechanical properties as obtained from simulation corresponding to hardening soil model are representative of the Pare Geological Strata as shown in Table 8.
However, since the material modelling has been done using the results of in-situ Plate Load Test conducted at only two locations of the whole project sites, a better picture of the properties would have been obtained, had there been more number of tests conducted at various locations of the site.
Table 8. Physical and Mechanical Properties of the Pare Rock Mass as obtained from Simulation
|
Material |
Pare Rock Mass |
|
|
Constitutive Model |
Hardening soil model |
|
|
Parameters |
γunsat |
17.54 kN/m3 |
|
γsat |
20.44 kN/m3 |
|
|
e |
0.42 |
|
|
ν' |
0.2 |
|
|
E50ref |
290e3 kN/m2 |
|
|
Eoedref |
290e3 kN/m2 |
|
|
Eurref |
2e6 kN/m2 |
|
|
m |
1 |
|
|
C'ref |
131.6 kN/m2 |
|
|
Ф |
49.6° |
|
Acknowledgements
This work is the result of a research project sponsored by NEEPCO Ltd. We sincerely acknowledge NEEPCO Ltd. For providing us the various geological as well as geotechnical data of Pare rock mass, which was necessary for carrying out the present work.
References
[1] N.S. Isik, R. Ulusayand V. Doyuran, “Deformation modulus of heavily jointed-sheared and blocky greywackes by Pressuremeter tests: numerical, experimental and empirical assessments,” Eng. Geol., 101, pp. 269-282, 2008. View Article
[2] A. Kayabasi, C. Gokceoglu and M. Ercanoglu, “Estimating the deformation modulus of rock masses: A comparative study,” Int. J. Rock Mech. Min. Sci., 40, pp. 55–63, 2003. View Article
[3] R. Zhang, T. Ren, A. Khan, Y. Teng and J. Zheng, “Back-Calculation of Soil Modulus from PFWD Based on a Viscoelastic Model,” Adv. Civ. Eng. Hindawi, 2019. View Article
[4] B. Singh and R.K. Goel, Engineering Rock Mass Classification”. Elsevier Inc. Publication, Amsterdam, pp. 364, 2011. View Article
[5] J. G. Grasmick, M. A. Mooney, R. W. Surdahl, M. Voth, and C. Senseney, “Capturing a layer response during the curing of stabilized earthwork using a multiple sensor lightweight deflectometer,” J. Mater. Civ., vol. 27, no. 6, Article ID 04014183, 2015. View Article
[6] M. J. Kavvadas, “Modelling the soil behaviour – selection of soil parameters. General report,” in Proceedings of the 2nd International Conference on the Geotechnics of Hard Soils-Soft Rocks. Athens; 12–14 October 1998, vol. 2: pp. 1441–1481.
[7] Consulting Engineering Services, Geological report on pare Hydro Electric Project, Papum pare district, Arunachal Pradesh (Report No. 2005025/PE/REP/05 (R0), 2005.
[8] IS 1888: Method of load test on soils, Bureau of Indian Standards, New Delhi (1982).
[9] A. Lowson and Z. Bieniawski, “Critical assessment of RMR based tunnel design practices: A practical engineer’s approach,” in Proceedings of the SME, Rapid Excavation and Tunnelling Conference, Washington, DC, USA, 23–26 June 2013, pp. 180–198.