International Journal of Civil Infrastructure (IJCI)
ISSN: 2563-8084

Volume 6 - Year 2023- Pages 08-16
DOI: 10.11159/ijci.2023.002
Identifying Soft Soils using Pore-Pressure Parameters: A Machine Learning Approach
Jeniffer Viegas1, António Gallardo1, Lucas Bottaro1, Rodrigo Marinaro2
1TPF Consultores de Engenharia e Arquitetura S.A
1050-138, Lisbon, Portugal
jeniffer.viegas@tpf.pt
2Vale S.A
34006-270, Nova Lima, MG, Brazil
Abstract - The cone penetration test (CPT) is a widely used method for identifying soil profiles and estimating soil parameters. Numerous correlations have been established to facilitate geo-characterization of soils based on CPT data. However, caution must be exercised when applying these correlations and laboratory tests should be used to validate them. Tropical residual soils are highly variable, even for seemingly similar samples, which can make it difficult for project designers to accurately characterize them. The present work focuses on a case study where the goal was to distinguish and characterize two soft soils existent on the foundation of a tailings dam in the southwest of Brazil. The construction of the dam is still ongoing, and its foundation belongs to a complex geological environment with soft soils that can reach NSPT blows as low as its own weight. The geological survey identifies two horizons of residual soil of dolomitic phyllite: soft and very soft. However, spatially distinguishing this material regarding its consistence has shown to be a challenging task. Since they differ essentially on the degree of weathering, most parameters for both materials are quite similar, and from laboratory tests, the parameter that helps differentiate these soils is the pore pressure Skempton parameter at failure – Af. Based on these findings, it can be inferred that the pore-pressure parameter Bq in CPT represents the excess pore-pressure during the test, whereas Af describes the excess pore-pressure at failure during triaxial tests. Despite the lack of a currently established theoretical correlation between the two parameters, they can offer valuable insight into the soil's response to rapid loading. Notably, both measures have proven to be effective in distinguishing between residual soils, even though they are distinct measures. In this study, the Bq and Af parameters are employed to classify soils using an unsupervised learning method, specifically the K-means algorithm. The resulting clusters exhibit strong agreement with borehole profiles near the CPT locations.
Keywords: Pore-Pressure Parameter, Machine Learning, Tropical Residual soils, Cone Penetration Test.
© Copyright 2023 Authors - This is an Open Access article published under the Creative Commons Attribution License terms. Unrestricted use, distribution, and reproduction in any medium are permitted, provided the original work is properly cited.
Date Received: 2023-03-03
Date Revised: 2023-04-08
Date Accepted: 2023-04-18
Date Published: 2023-16-09
1. Introduction
Distinguishing soils and characterizing them is one of the first steps in geotechnical design. In large projects, the number of field investigation can easily reach hundreds and how one organizes and extract information from these data can be the key for success. Statistical analysis can be implemented to help dealing with a large dataset. One of the goals of this work is to identify two kinds of soils of same origin and thus very similar: saprolitic soil of dolomitic phyllite and residual soil of dolomitic phyllite.
Cluster analysis [1] is a widely used method to categorize data based on its properties. In the field of geotechnical engineering, it is commonly used with Cone Penetration Test (CPT) data for various purposes. For instance, in [2], a review of soil classification based on CPT data is presented, along with a novel methodology that employs the kernel k-means algorithm and artificial neural networks for soil classification. In [3], a cluster analysis technique is utilized to group CPT data based on normalized cone resistance, friction ratio, and soil behaviour index, which led to layer grouping used later to determine soil rigidity model. Additionally, cluster analysis has been used to improve total weight prediction [4], classify different types of phosphogypsum in a stack where the Soil Behaviour Type system (SBTn) was not effective [5], and group soil layers, delineate lenses and outliers within a sub-layer [6]. Despite the objective of grouping, each of the cited examples employs a specific mathematical approach, such as K-means, Gaussian Mixture Model (GMM), or Fuzzy C-means. In the present study, the K-means method is utilized to identify two soft soils.
2. Site and Data Description
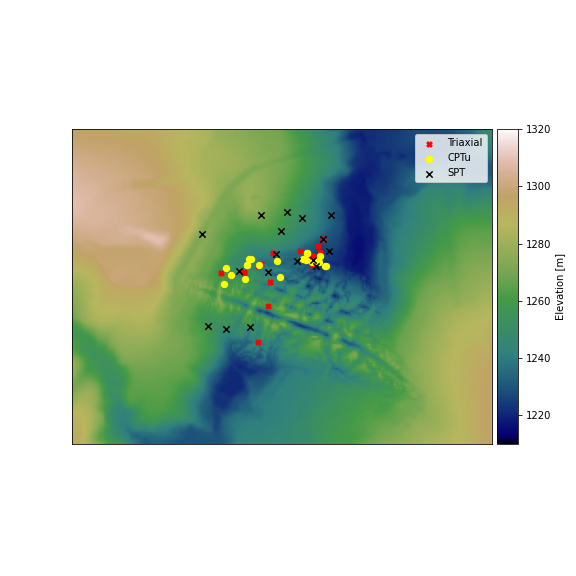
This case of study refers to materials existent on the offset of a tailings dam located on the Quadrilátero Ferrífero, an iron ore rich area located in the state of Minas Gerais, southwest of Brazil. To successfully move into the second phase of construction, it's crucial to identify and characterize the soft materials present at the foundation of the tailings dam. These materials were identified on the downstream rise of the structure on the left abutment, making it necessary to thoroughly understand their properties before proceeding. By doing so, the construction team can ensure that the project is built on a stable foundation, minimizing the risk of future issues. Although there are hundreds of surveys, the present study focuses on the data localized in the interest area. The available data in this area is presented in Figure 1, where the red squares represent laboratory samples (triaxial tests and characterization tests – Atterberg limits and granulometric distribution), the yellow circles represent cone penetration tests with measurement of pore pressure, and the black cross represents standard penetration tests.
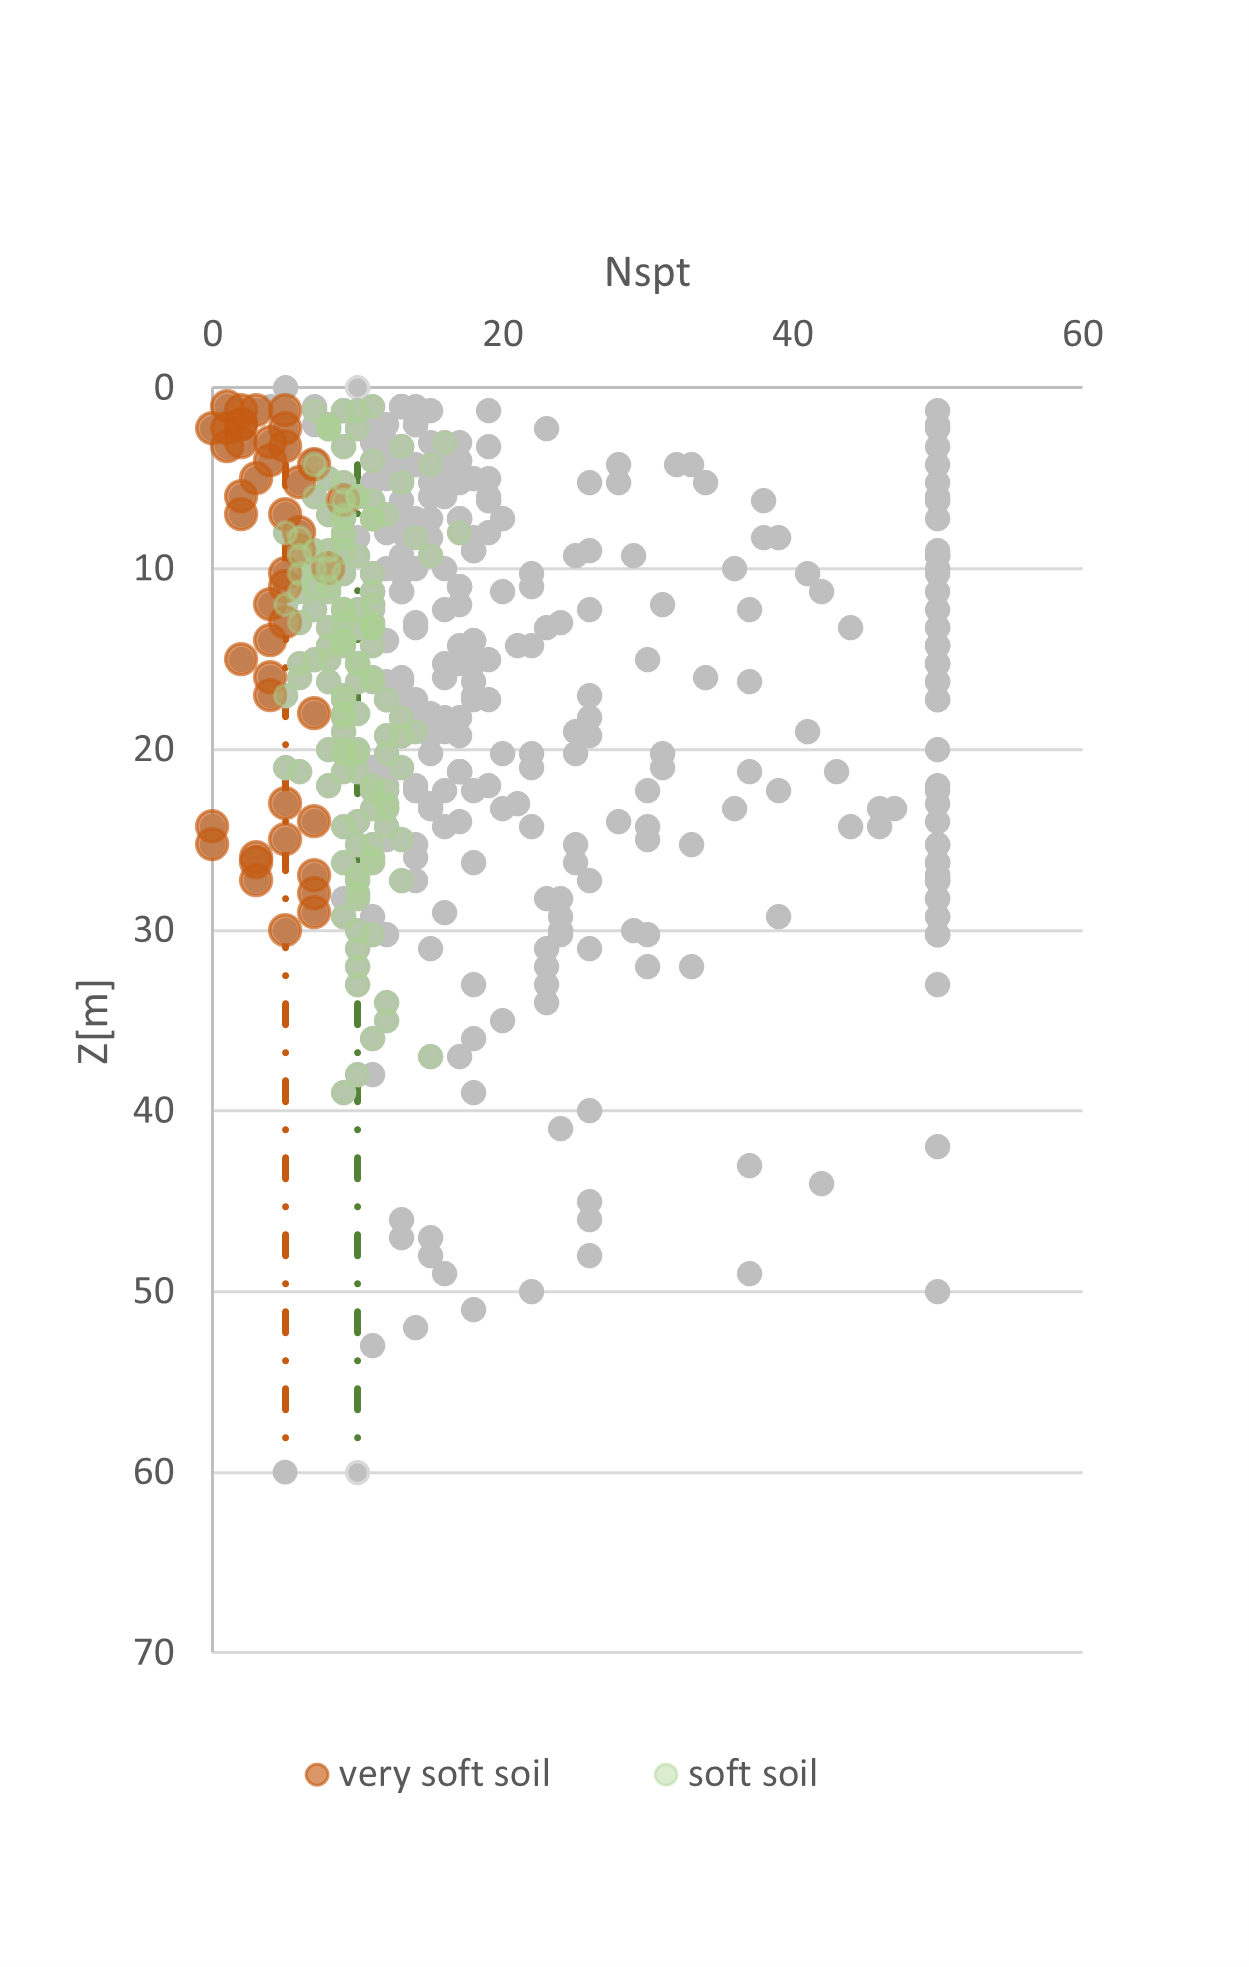
Some of the standard penetration tests (SPT) have reached NSPT blow as low as its own weight, revealing a very soft soil that could not be limited to a specific layer, as shown in Figure 2, where the number of blows (Nspt) are plotted against the depth. The goal of this work is to identify these soils in CPT results and to understand its spatial distribution.
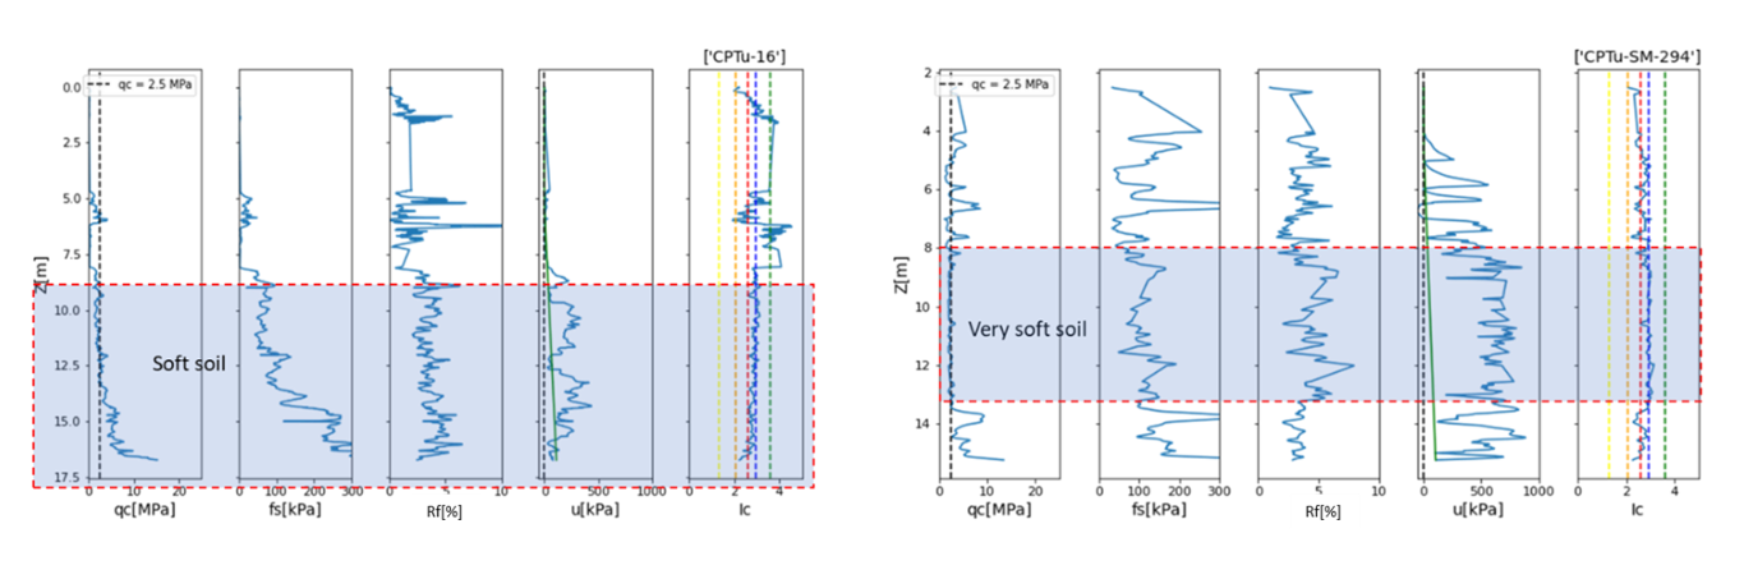
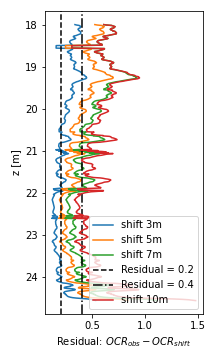
To deal with the large amount of data, all information was treated with an opensource programming language, allowing the standardization and fast treatment of all data. The CPT data were analyzed following the approach in [7]. Figure 3 shows an example of the CPT data with identification of the investigated soils, using SPT investigations existent on the area to confirm the layer zone. For some CPT, the water level was not clear, and a sensitive analysis of the influence of a wrong estimation of the water level in the apparent overconsolidation ratio (OCR) was performed. OCR was defined as:
It was possible to see that a wrong estimation of the water level within 3m would impact in a difference in the OCR value about 0.2 to 0.4, as shown in Figure 4. This figure shows the comparison of residuals for different values of the water table. The residual is determined by the difference between the value of the OCR parameter calculated through CPT correlations that consider the water table level provided by the CPT dissipation test (or its indication in the nearest drilling report) and the OCR value obtained when an increase (shift – always deeper) is made in the value of the water table, of 3m, 5m, 7m or 10m.
3. K-Means Method
In this study, the K-means method was applied to group laboratory samples and later, to group CPT data. The K-means algorithm [1],[8],[9] clusters the n data points into K disjoint clusters C, defined as input from the user. The grouping is performed by minimizing the distance from the sample point, xi to the group centre (mean of the samples, μj), known as the inertia or within-cluster sum-of-squares criterion.
4. Results
4. 1. Laboratory Data
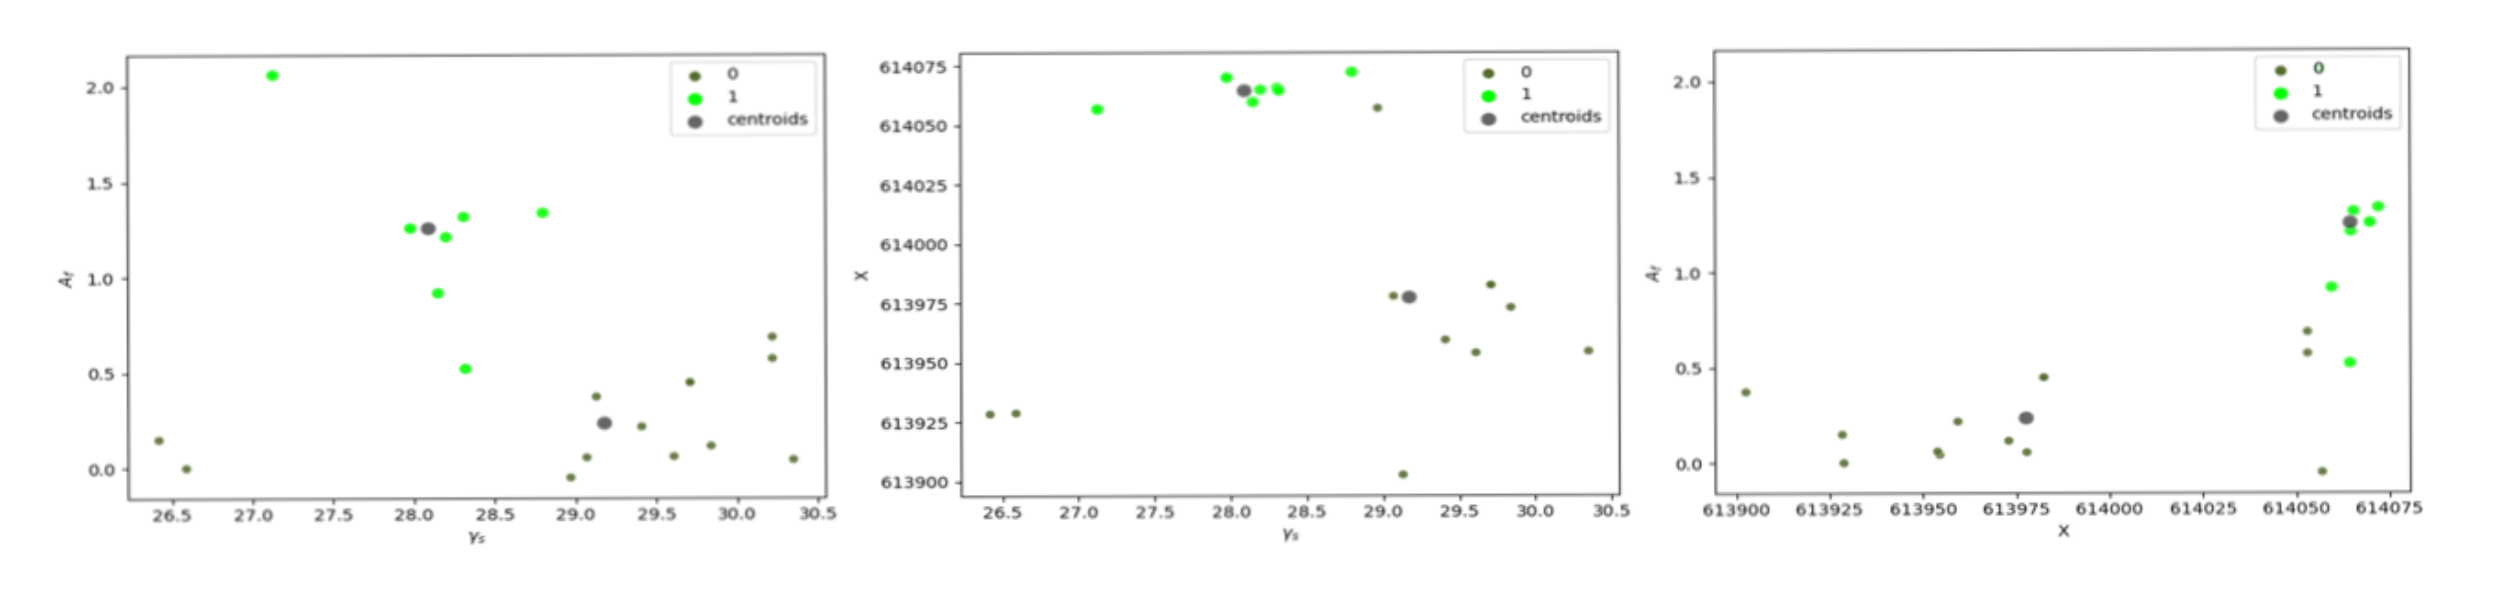
Atterberg limits, granulometric distribution, specific weight of particles and undrained triaxial tests were analyzed to distinguish the two materials and to find any parameter that could be chosen as a flag for each material. The selection of the parameters used to perform the cluster analyses was based on the Principal Feature Analysis (PFA) [10] that selects a subset of the original features that contains most of the essential information. Several combinations of features were tested, and the select features were the pore pressure Skempton parameter at failure Af, the specific weight of solid particles γs, and a spatial variable, the X coordinate of the location where the sample was collected. The number of clusters was set to two, since the goal was to separate the sample within the two soft soils. Figure 5 presents the scatter plot for all features in the three planes where the points are colored by the result from the cluster analysis. Cluster 1 (light green) represent a material with lower specific weight of solid particles and higher pore pressure A Skempton parameter at the failure.
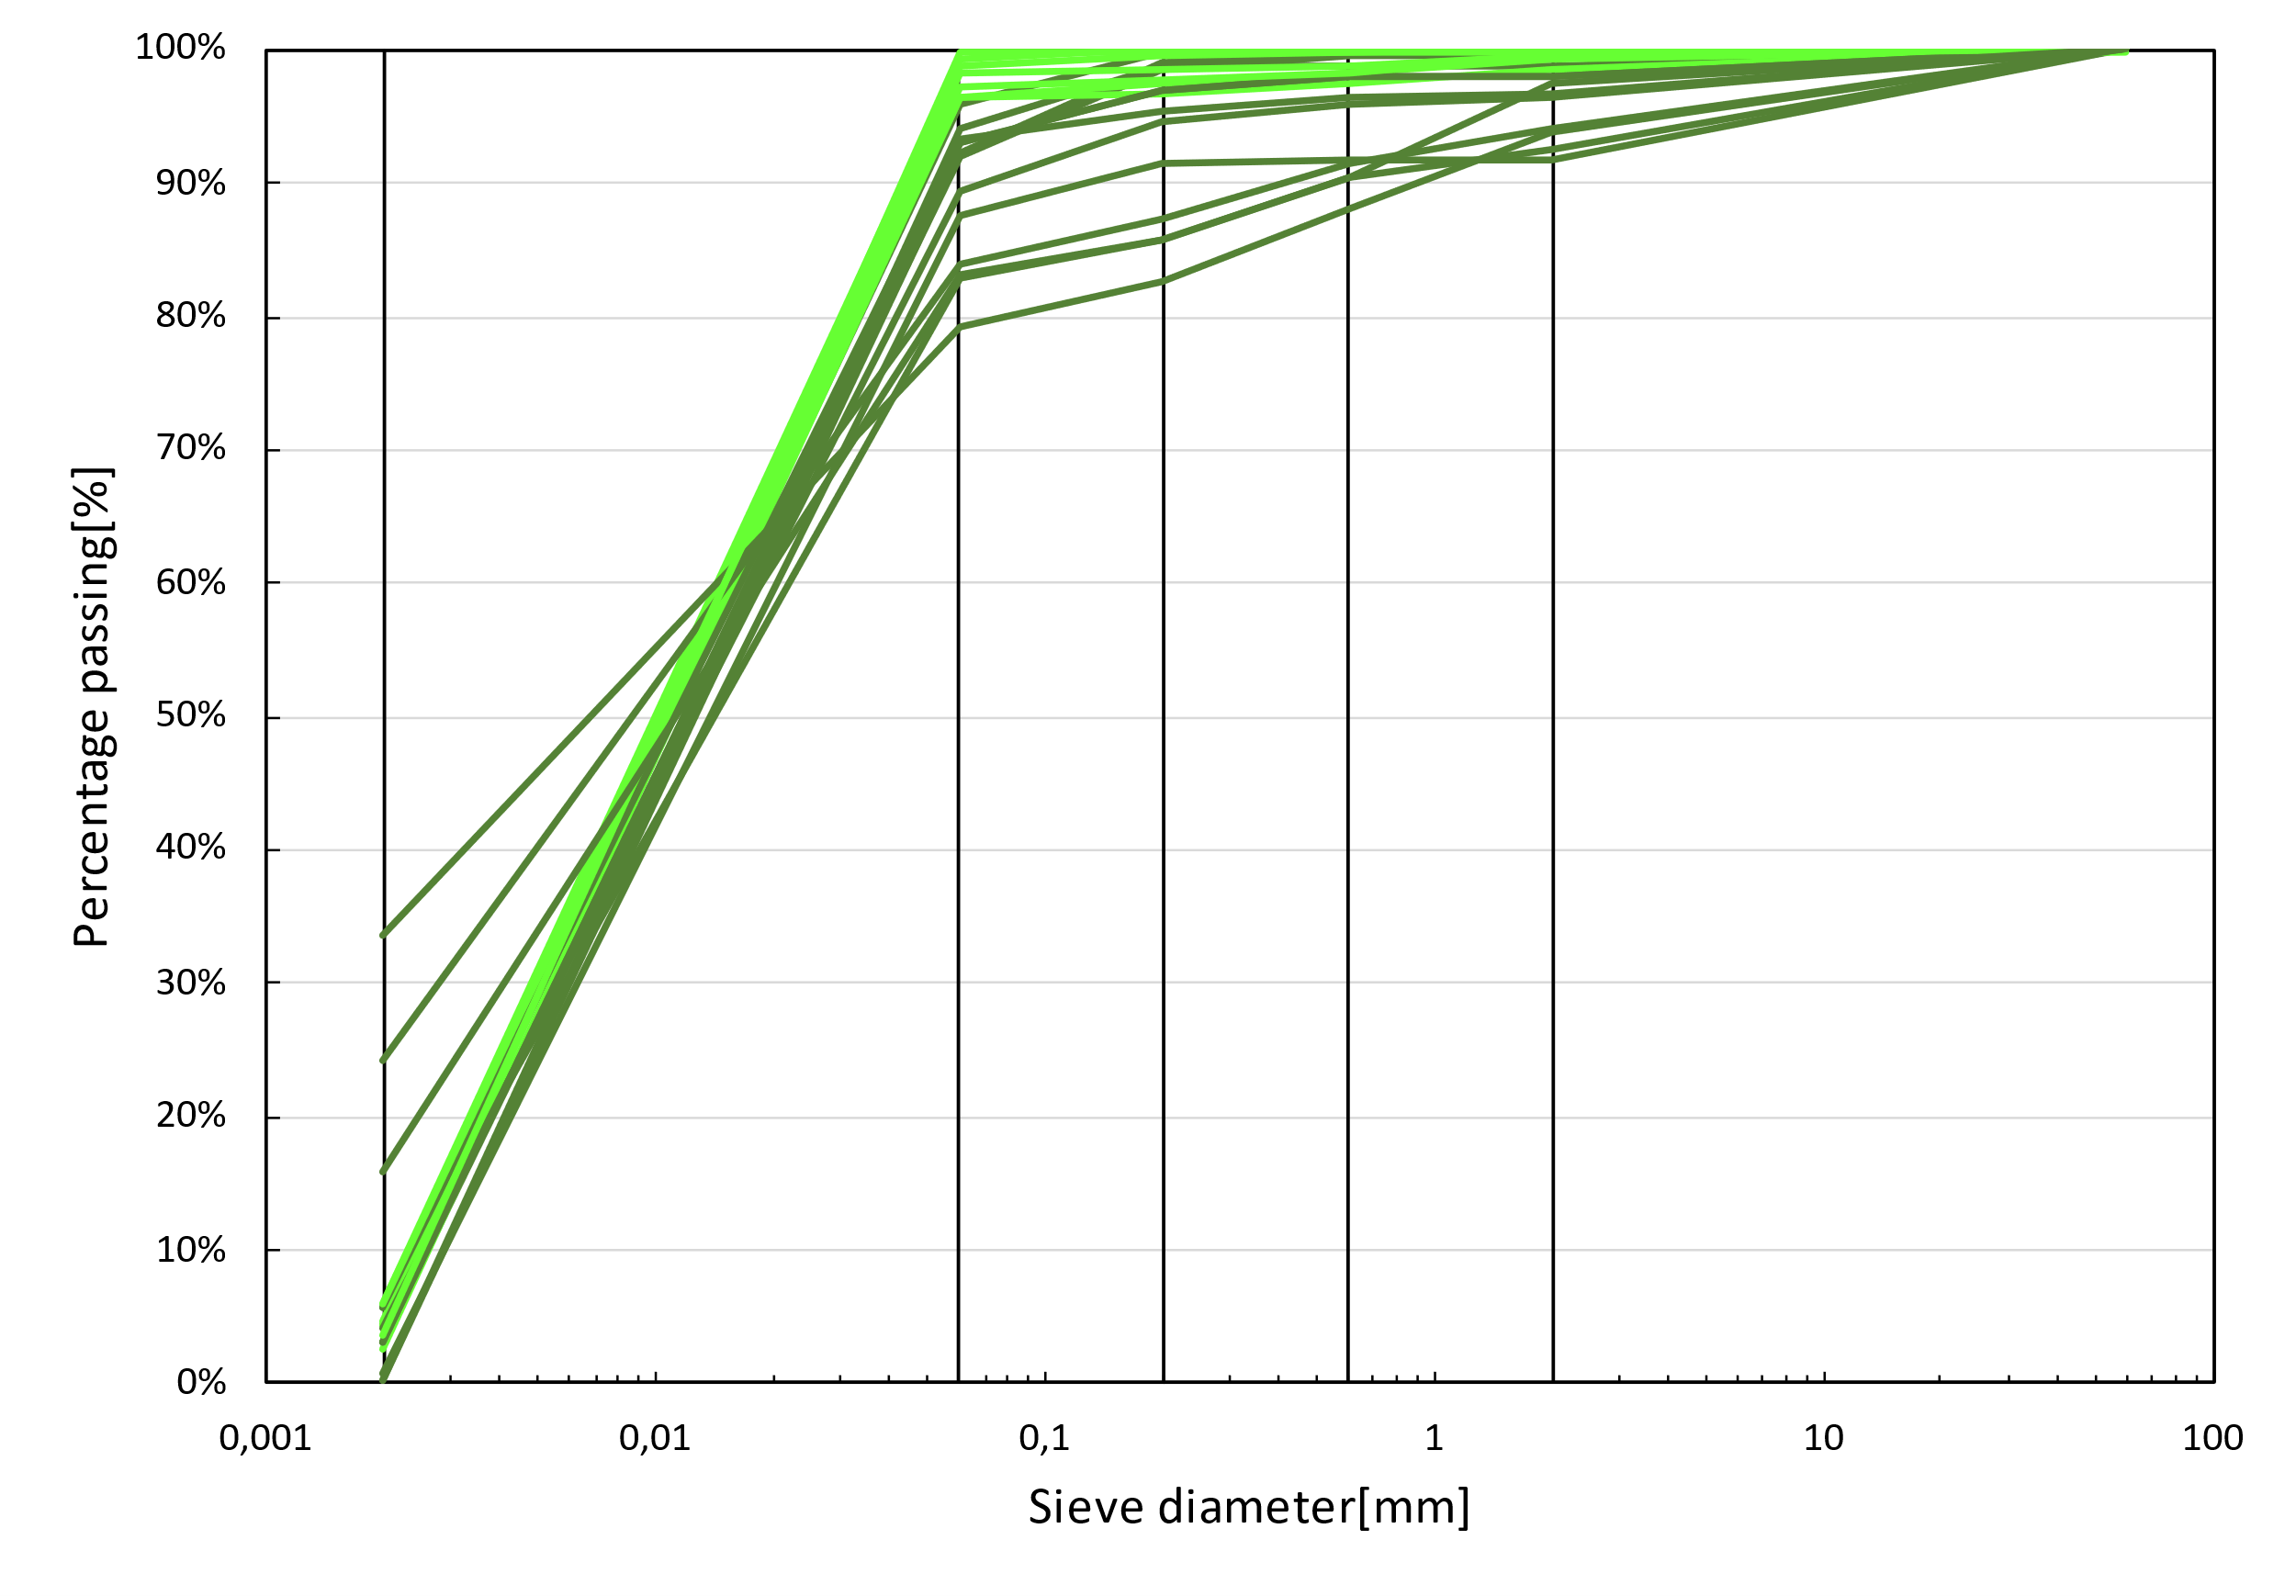
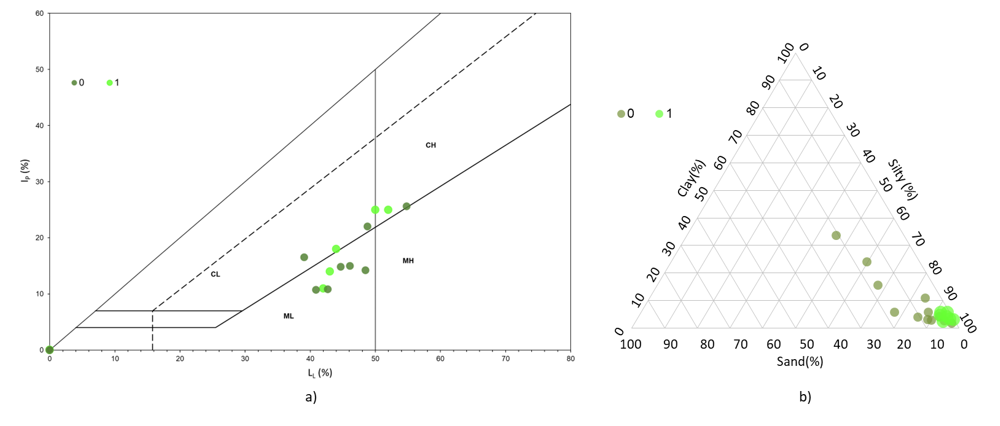
From the granulometric curve in Figure 6 and the ternary diagram in Figure 7 b) it is possible to see that this material is mainly silty. The Casagrande plasticity chart presented in Figure 7 a) offer little assistance in distinguish these materials, since they are quite mixed in this chart, the non-plastic materials are mapped as Ip=LL=0 (points at origin of the graph).
The data from triaxial undrained tests were treated according [11], where the stress paths are presented in the axis:
With σ’1 and σ’3 being the major and minor principal effective stresses. The pore pressure A Skempton parameter is defined as:
In Figure 8 a), the stress paths are plotted for all samples and in Figure 8 b) the pore pressure A Skempton parameter is displayed as a function of t. In both figures the samples are colored according to the group resulting from the cluster analysis. One can see that the cluster 1 shows a contractile soil with higher pore pressure A Skempton parameter, while cluster 0 shows the opposite.
4. 2. CPT Data
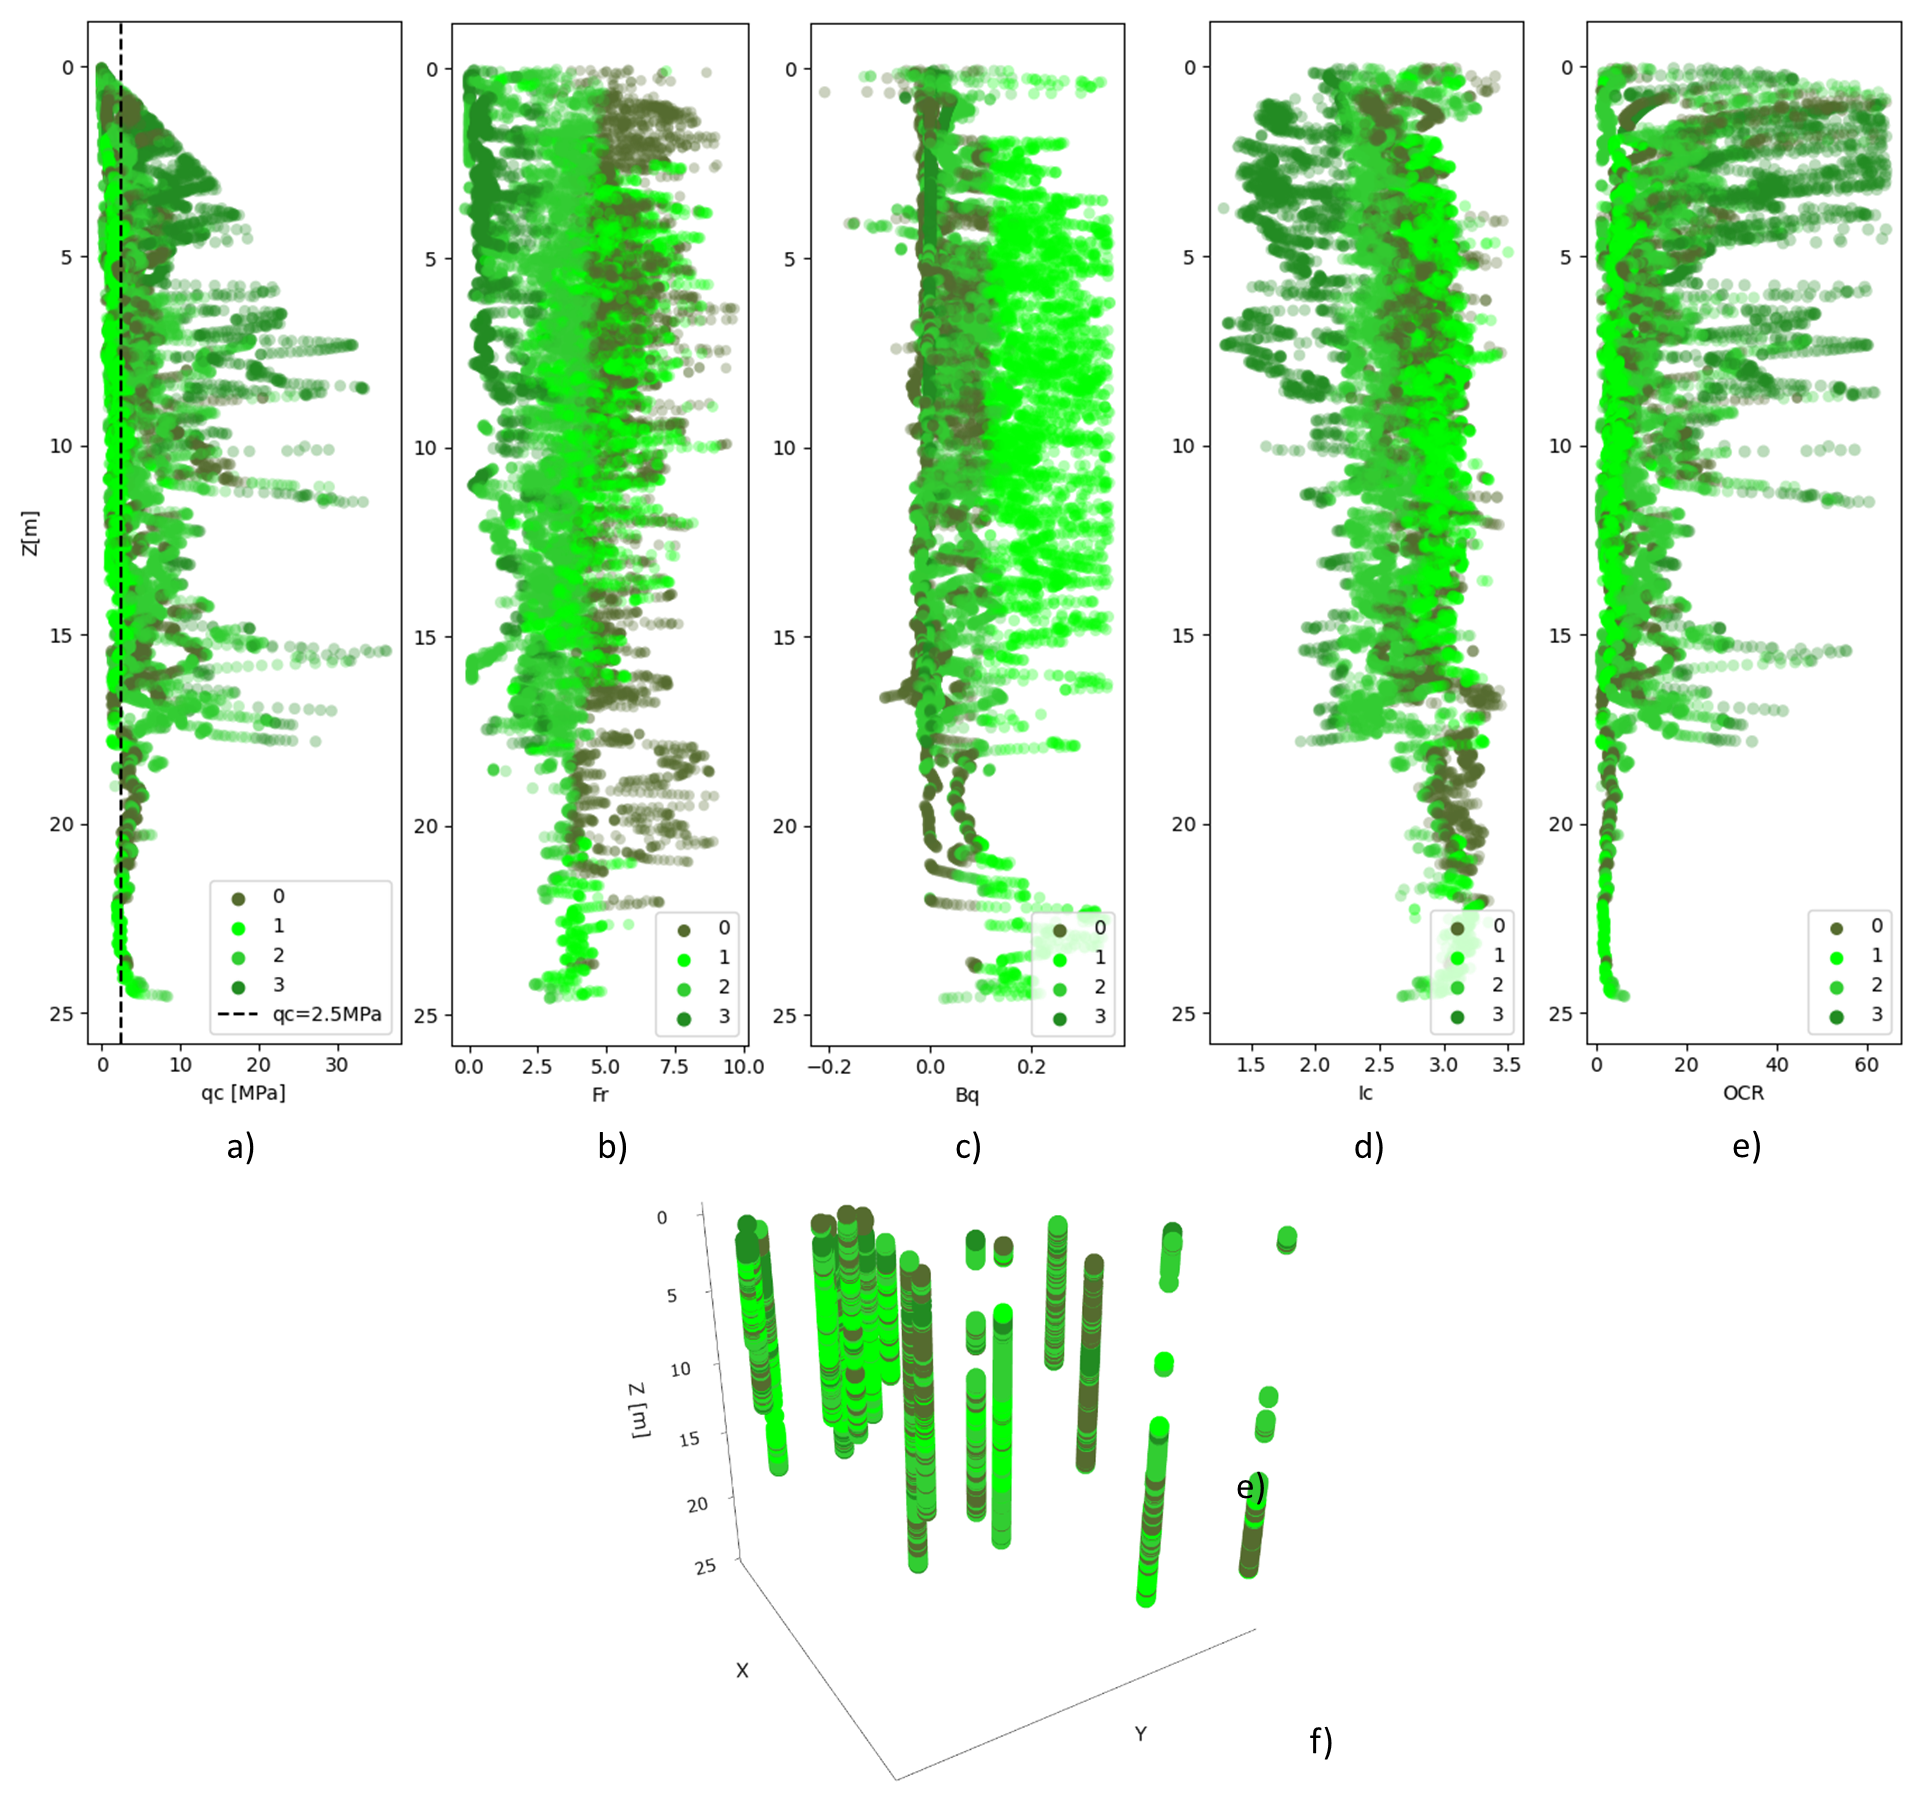
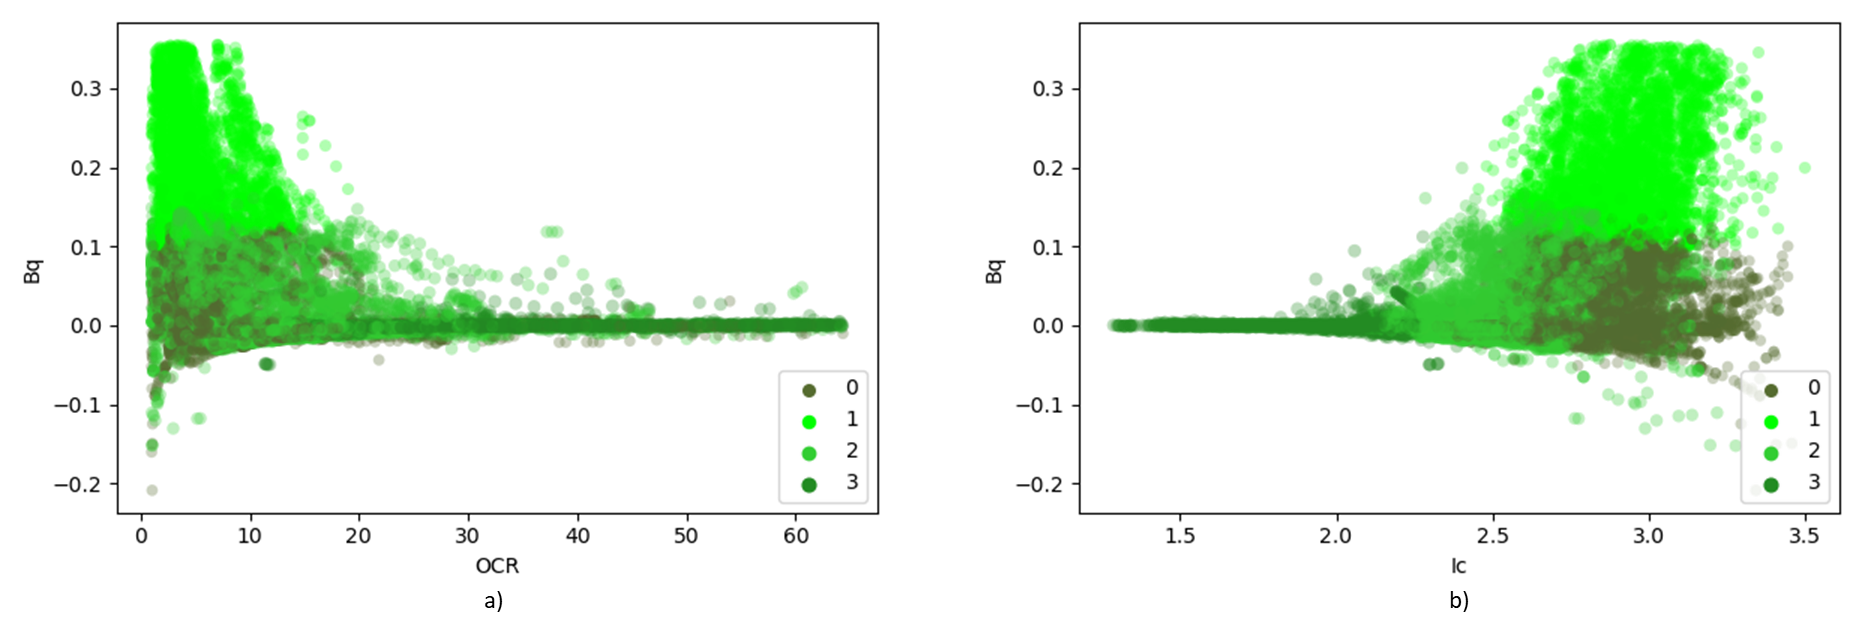
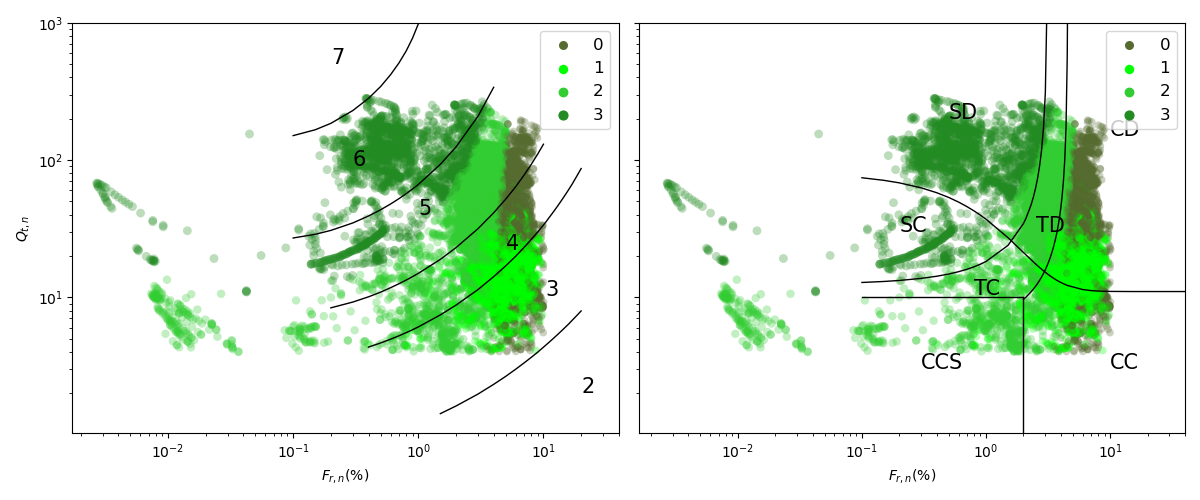
The CPT data shown in Figure 1 was treated following [7] and a cluster analysis analog to the one used on the laboratory tests data was also applied to the CPT data. The goal of this section was to find the soft and very soft soil identified on SPT and triaxial samples in the CPT data. Three tests were performed with the same variables as features: pore pressure ratio Bq; soil behavior index Ic; and friction ratio Fr. The difference in the tests was the number of clusters to form, and since it was not possible to know in advance the exact number of soils presented in the CPTs (which included soils other than the 2 of interest), simulations were conducted varying from 3 to 5 clusters (groups of soils). All tests created a group for soil with low tip resistance (qc ≤ 5Mpa), low OCR, and high pore pressure ratio. Figure 9 shows the result for the test with 4 clusters, in terms of a) cone resistance, qc, b) friction ratio, Fr , c) pore pressure ratio, Bq, d) soil behavior type index, Ic, e) apparent overconsolidation ratio, OCR, and f) the 3D distributions of the clusters. The group mentioned above is identified as cluster 1 (light green). Cluster 1 could be the very soft soil identified in the laboratory samples (cluster 1 in Figure 8). The only issue in this classification would be the Ic parameter, that is in the range of 2.8-3.5, suggesting a material with silty clay to clay behaviour, while the granulometric distribution of the soil of interest shows up to 95% of silt. Is important remember, though, that the Ic is a behaviour type index, and regardless the soil being almost integrally silty, due to some structure or even the presence of a relatively small percentage of clay it could easily present a response to the probe penetration like a clay or silty clay. This group could not be assigned as the soft soil (cluster 0 in Figure 8) due to the elevated pore pressure generated during to the penetration of the probe, since the laboratory tests showed lower pore pressure A Skempton parameter at failure. In addition, when comparing adjacent SPT and CPT, it is possible to understand that the major difference between the soft and very soft horizons is indeed the pore pressure, as shown in Figure 3, where for the very soft soil the excess pore pressure is higher than 500 kPa. Figure 10 illustrates the relationship between the pore-pressure ratio Bq, and the OCR and Ic parameters. As shown in the figure, cluster 1 exhibits a non-linear trend on these plots, tending towards zero asymptotically as the OCR and Ic values increase. This observation suggests that as the OCR and Ic values increase, the effect of pore-pressure ratio Bq on the material decreases, indicating a lower susceptibility to liquefaction. The data was plotted on the normalized CPT Soil Behaviour Type chart [7], as shown in Figure 11. The plot reveals that cluster 1 is distributed across the transition zone and clay-like materials, with some points positioned in the zone of sensitive clays. This observation suggests that the material's behaviour could vary, indicating the need for further investigation to determine its properties accurately.
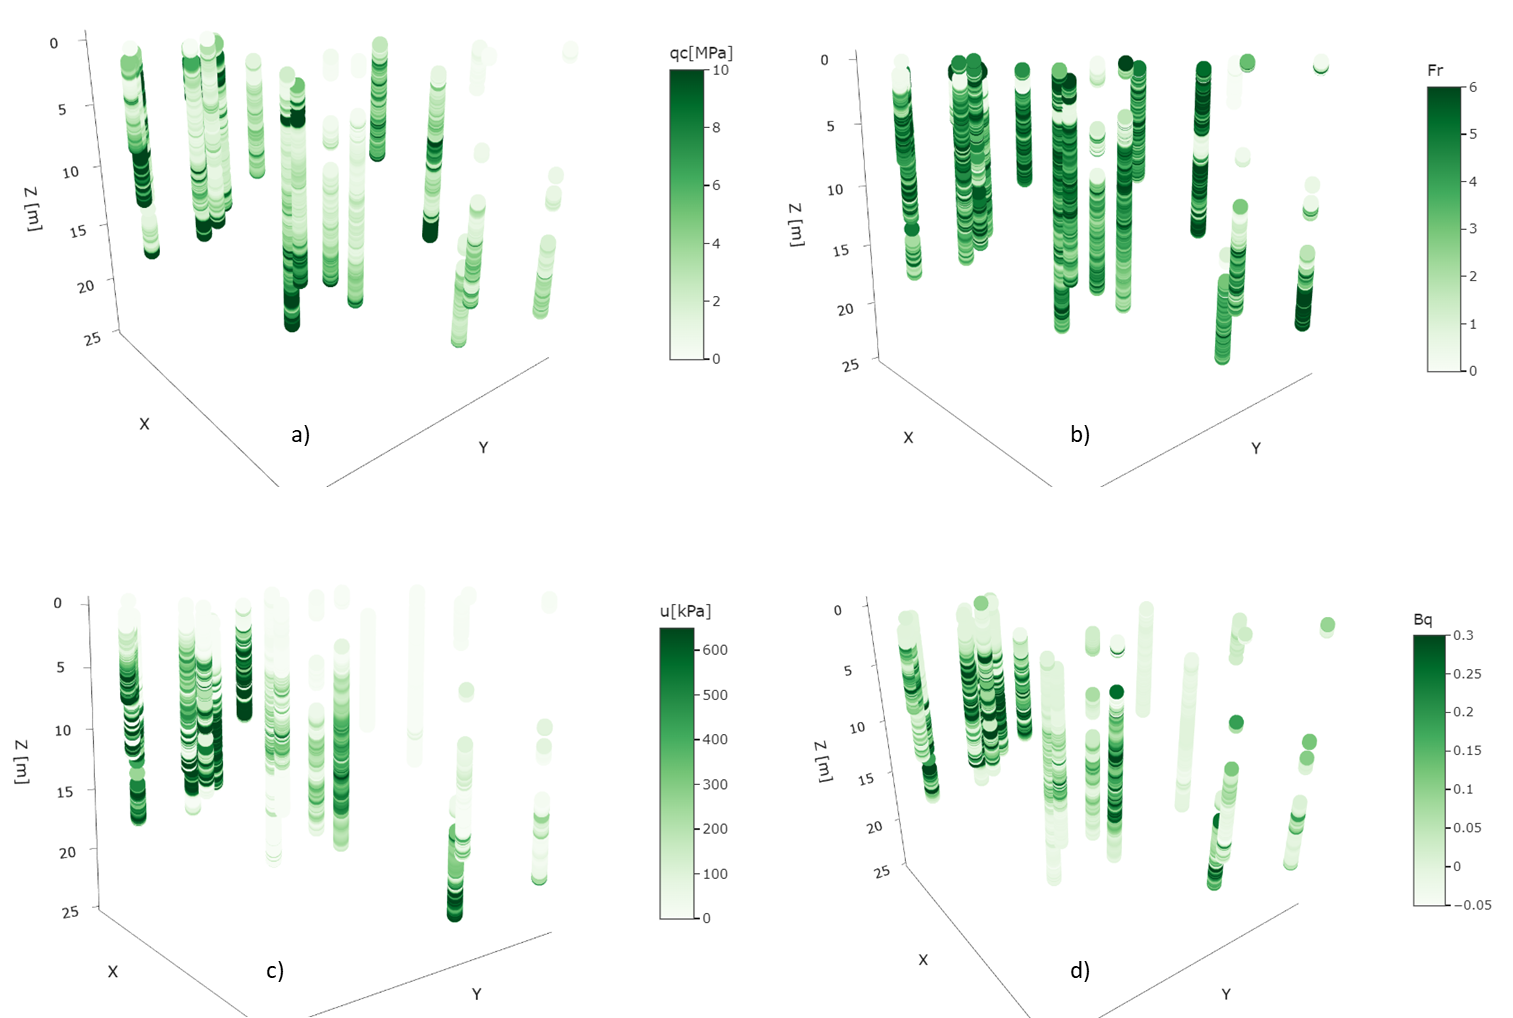
From Figure 9 e), it is possible to note that the existence of cluster 1 cannot be restricted to one layer or specific zone, since this material is spread without a clear pattern all over the study area. To check the matching between soil properties and to verify if cluster 1 is the very soft soil, the data were plotted in 3D. Figure 12 presents the data colored by a) the cone resistance, qc, b) the friction ratio, Fr, c) the pore pressure during the cone penetration, u, and d) the pore pressure ratio, Bq. Comparing these figures with Figure 9 e), it is possible to conclude that cluster 1 has low cone resistance qc, high pore pressure u (and consequently pore pressure ratio), and high friction ratio, Fr. The high pore pressure levels due to penetration corroborate the triaxial test results, showing that this is a soil that generates elevated excess pore pressure when subject to shear. On the other hand, cluster 0 (dark green) could be the soft soil, which also present low cone resistance and high friction ratio, but with lower pore pressure generated.
5. Conclusion
The interpretation and cluster analysis of the laboratory tests helped to understand the behavior of these soft and very soft residual soils when subject to shear, showing that the pore pressure parameter at failure (Af) is the main difference between them. Knowing that these materials tend to differ in such manner increased the confidence in establishing Bq as the parameter on CPT that better distinguish them, as clearly observed in the comparison of adjacent SPT and CPT surveys. This is a very interesting outcome of this study, since tip resistance and friction ratio are much more commonly used for differentiating materials than Bq. Nevertheless, to confirm the results from the CPT cluster analysis, it would be valuable to have samples in-depth, since all laboratory samples were collected at the surface.
Although it was not possible to establish clear layers of very soft soil and the soft soil in CPT soundings, it was possible to see the location where the parameters indicate the possible existence of these soils. This lack of well-defined layers in this study should not be interpreted as an incapacity of the model or inadequacy of the laboratory tests or field surveys, but rather an intrinsic geological characteristic of these tropical residual soils, which show very complex weathering patterns and cannot be compared to the layered and better-defined depositions of sedimentary formations, for instance. It is safe to say that there is no guarantee that the very soft soil is restricted to a layer or a specific zone, and treating this problem in such way would not be the best approach, especially for ultimate state evaluation, such as a limit equilibrium analysis. A more realistic methodology could be to understand the spatial variability of the soil parameters and generate random fields, based on the scale of fluctuation observed.
References
[1] MacQueen, I. (1967). Some methods for classification and analysis of multivariate observations. In Proceedings 5th Berkeley Symposium on Mathematical Statistics Problems (pp. 281-297).
[2] Carvalho, L. O., & Ribeiro, D. B. (2020). Application of kernel k-means and kernel x-means clustering to obtain soil classes from cone penetration test data. Soils and Rocks, 43(4), 607-618.
View Article
[3] Młynarek, Z., Wierzbicki, J. & Wołyński, W. (2018). Use of functional cluster analysis of CPTU data for assessment of a subsoil rigidity. Studia Geotechnica et Mechanica,40(2) 117-124. https://doi.org/10.2478/sgem-2018-0017
View Article
[4] Collico, S., Arroyo, M., DeVincenzi, M., Rodriguez, A., & Deu, A. (2022). Clustering analysis to improve total unit weight prediction from CPTu. In Cone Penetration Testing 2022 (pp. 339-344). CRC Press.
View Article
[5] Coelho, P, Nogueira, G., Katahira, D., Franco, J. (2022). Interpretação de Ensaios CPTu Realizados em Pilha de Fosfogesso por Meio de Técnicas de Estatística Multivariada. COBRAMSEG 2022. ISBN: 978-65-89463-30-6.
View Article
[6] Yin, J., Opoku, L., Miao, Y. H., Zuo, P. P., Yang, Y., & Lu, J. F. (2021). An improved site characterization method based on interval type-2 fuzzy C-means clustering of CPTu data. Arabian Journal of Geosciences, 14(14), 1-11.
View Article
[7] Robertson, P. K., & Cabal, K. L. (2015). Guide to cone penetration testing for geotechnical engineering. Gregg Drilling & Testing, Inc, 6.
[8] Clustering. Scikit-learn.org. (Accessed in December 2022). https://scikitlearn.org/stable/modules/clustering.html
[9] Vassilvitskii, S., & Arthur, D. (2006, June). k-means: The advantages of careful seeding. In Proceedings of the eighteenth annual ACM-SIAM symposium on Discrete algorithms (pp. 1027-1035).
[10] Lu, Y., Cohen, I., Zhou, X. S., & Tian, Q. (2007, September). Feature selection using principal feature analysis. In Proceedings of the 15th ACM international conference on Multimedia (pp. 301-304).
View Article
[11] ASTM. (2011). Standard test method for consolidated undrained triaxial compression test for cohesive soils. ASTM International - Committee D-18 on Soil and Rock.
[1] MacQueen, I. (1967). Some methods for classification and analysis of multivariate observations. In Proceedings 5th Berkeley Symposium on Mathematical Statistics Problems (pp. 281-297).
[2] Carvalho, L. O., & Ribeiro, D. B. (2020). Application of kernel k-means and kernel x-means clustering to obtain soil classes from cone penetration test data. Soils and Rocks, 43(4), 607-618. View Article
[3] Młynarek, Z., Wierzbicki, J. & Wołyński, W. (2018). Use of functional cluster analysis of CPTU data for assessment of a subsoil rigidity. Studia Geotechnica et Mechanica,40(2) 117-124. https://doi.org/10.2478/sgem-2018-0017 View Article
[4] Collico, S., Arroyo, M., DeVincenzi, M., Rodriguez, A., & Deu, A. (2022). Clustering analysis to improve total unit weight prediction from CPTu. In Cone Penetration Testing 2022 (pp. 339-344). CRC Press. View Article
[5] Coelho, P, Nogueira, G., Katahira, D., Franco, J. (2022). Interpretação de Ensaios CPTu Realizados em Pilha de Fosfogesso por Meio de Técnicas de Estatística Multivariada. COBRAMSEG 2022. ISBN: 978-65-89463-30-6. View Article
[6] Yin, J., Opoku, L., Miao, Y. H., Zuo, P. P., Yang, Y., & Lu, J. F. (2021). An improved site characterization method based on interval type-2 fuzzy C-means clustering of CPTu data. Arabian Journal of Geosciences, 14(14), 1-11. View Article
[7] Robertson, P. K., & Cabal, K. L. (2015). Guide to cone penetration testing for geotechnical engineering. Gregg Drilling & Testing, Inc, 6.
[8] Clustering. Scikit-learn.org. (Accessed in December 2022). https://scikitlearn.org/stable/modules/clustering.html
[9] Vassilvitskii, S., & Arthur, D. (2006, June). k-means: The advantages of careful seeding. In Proceedings of the eighteenth annual ACM-SIAM symposium on Discrete algorithms (pp. 1027-1035).
[10] Lu, Y., Cohen, I., Zhou, X. S., & Tian, Q. (2007, September). Feature selection using principal feature analysis. In Proceedings of the 15th ACM international conference on Multimedia (pp. 301-304). View Article
[11] ASTM. (2011). Standard test method for consolidated undrained triaxial compression test for cohesive soils. ASTM International - Committee D-18 on Soil and Rock.