International Journal of Civil Infrastructure (IJCI)
ISSN: 2563-8084

Volume 6 - Year 2023- Pages 27-35
DOI: 10.11159/ijci.2023.004
Bearing Capacity and Strength of Fibre-Reinforced Sand: Experimental and Parametric Study
Magdi Elemam1, Ruba Elmootassem1, Haitham Badrawi1,Ashraf Amin2
1American University of Sharjah, Department of Civil Engineering
Sharjah, United Arab Emirates
melmam@aus.edu
2Chief Road Engineer/Road and Transportation Authority,
RTA, Dubai, United Arab Emirates
ashraf.amin@rta.ae
Abstract - In this paper, Polyolefin fibre which is produced from simple olefin (CnH2n) was mixed with dry sand to investigate the shear strength improvement of the admixture. Specimens with 0.5%, 1%, 1.5% and 2% fibre contents with yarns lengths of 15 mm and 30 mm are prepared in repeatable steps and tested in direct shear tests. Bearing capacity of hypothetical footing resting on ground surface of the tested fibre-reinforced-sand was estimated using Terzaghi’s bearing capacity equation. Moreover, a parametric study includes thickness of reinforced layer, depth of foundation, and fibres content percent is conducted. In the parametric study, the continuous footing was analysed using procedures estimating the bearing capacity of layered soils. Results of shear strength tests indicated that, the inclusion of randomly distributed discrete fibres significantly improved the shear strength of sand. The optimum fibre percentage for improving both friction angle was about 1%. Adding fibre more than this ratio resulted in a significant reduction in soil shear strength parameters. The effect of fibre on sand apparent tensile cohesion is more pronounced compared to its effect on the friction angle. The parametric study indicates that having a continuous footing resting on a soil layer reinforced with 30 mm artificial fibres at 0.5% content provides the highest ultimate bearing capacity. Finally, the thickness of the reinforced layer and the depth of the foundation are among the parameters that affect bearing capacity.
Keywords: Shear strength, Sand, Soil reinforcement, Bearing Capacity, Geo-Fibre, continuous footing
© Copyright 2023 Authors - This is an Open Access article published under the Creative Commons Attribution License terms. Unrestricted use, distribution, and reproduction in any medium are permitted, provided the original work is properly cited.
Date Received: 2023-03-23
Date Revised: 2023-04-28
Date Accepted: 2023-05-08
Date Published: 2023-08-01
1. Introduction
Soil reinforcement techniques have been developed and implemented successfully for four decades. Different forms of reinforcement such as, plane shape (geotextiles and geogrids), geocells, and discrete fibres are used in practice. Latha and Murthy (2007) concluded that, different forms of reinforcement are expected to give different strength improvements, despite that same quantity of material are used. They attributed the difference in strength improvement to the different mechanism of failure associated with different reinforcement forms and shapes. In addition, they concluded that randomly oriented discrete fibre showed insignificant improvement in stress–strain behaviour of sand. Furthermore, the failure plane of a randomly ordinated sand specimen tested on triaxial test was similar to that of pure sand specimen tested under same conditions. This minor contribution of the discrete fibre to the behaviour of sand could be attributed to the type of fibre used by Latha and Murthy (2007). A close look to the fibre indicated that it was very soft fibre with almost perfectly smooth surface. Therefore, it is expected that this type of fibre may reduce the internal friction between particles rather than increasing it. Despite of this, Latha and Murthy (2007) reported about 45% increase in the shear strength of pure sand when it is reinforced with discrete randomly distributed fibre.
Based on study of sand reinforced with discrete fibres on direct shear test, unconfined compression test, and triaxial test, significant improvement of shear strength of sand due to fibre inclusion was reported (Al-Refeai 1991; Ranjan et al. 1994; Consoli et al. 1998; Yetimoglu and Salbas 2003; Tang et al. 2007). Studies by Gray and Al-Refeai (1986) and Ranjan et al. (1994) indicated that the shear strength of fibre-reinforced sand increased with increasing both percentage and aspect ratio of the fibre. These studies also concluded that, the longer the fibre, the more improvement in the shear strength of the sandy soil. The improvement in soil shear strength parameters has been attributed to the micromechanics of the soil-polypropylene fibre interactions at their interface, where fibres interlock with soil grains, forming a coherent matrix that acts as a three dimensional reinforcing network (Anagnostopoulos et al. 2014). To quantify the effects of fibre reinforcements on the shear strength properties of soil, several parameters have been studied, with research showing that the extent of soil improvement due to the addition of fibre reinforcements is mainly influenced by the percentage of fibre content and the aspect ratio of fibres (Ahmad et al. 2010, Hejazi et al. 2012) The consensus among research is that the addition of natural or artificial fibre reinforcements up to a certain percentage improves shear strength parameters; however, exceeding the optimum percentage may result in a plateau or decline in shear strength because of the reduced contact between soil particles (Ahmad et al. 2010, Anagnostopoulos et al. 2014).
Regarding bearing capacity, El-Emam (2009) indicated that inclusion of one reinforcement layer improved the bearing capacity of soft clay significantly. In addition, the settlement of reinforced clay was considerably less compared to the unreinforced clay. Casagrande et al. (2009) conducted plate load tests to investigate the bearing of polypropylene fibre-reinforced and non-reinforced sandy soil. Results of these tests concluded that the inclusion of fibre inside the sandy soil increased both strength and stiffness of the soil, which reflected on both loading and settlement of the plate. In addition, the inclusion of fibres changes the failure mechanisms observed for non-reinforced sand. Furthermore, the fibre-reinforced sand shows the ability to maintain strength (or even continue to increase strength) with ongoing deformation, suggesting a very ductile material. Therefore, Casagrande et al. (2009) suggested that the fibre-reinforced sand material could be potentially used in other earthworks that might suffer excessive differential settlement, such as part of cover liners of municipal solid waste landfills, and embankments over organic soft soils.
2. Objective and Scope
The current paper presents results from a series of direct shear tests conducted on large number of soil specimens reinforced with discrete polymeric fibre. Fibres with different percentages have been used with sand in order to quantify the optimum fibre content. The simple Terzaghi bearing capacity equation is used to estimate the improvements on bearing capacity of shallow foundation resting on the top of fibre reinforced sand layer. The effects of foundation width, foundation depth, and reinforced sand layer thickness on the bearing capacity of a strip foundation resting on a layer of fibre reinforced soil on top of a weak soil layer are investigated. The ultimate bearing capacity procedure presented by Meyerhof (1974) and Meyerhof and Hanna (1987) for a case of a continuous footing laying on strong soil layer over a weak soil layer, is applied in this work.
3. Experimental Work
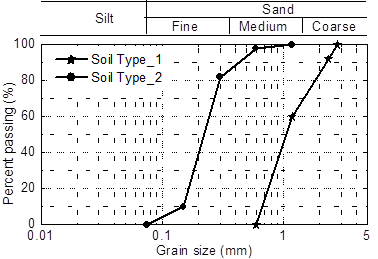
The granular soil types used in this investigation were clean uniformly graded sand. This sand was selected because it can be easily compacted with uniform mechanical properties and in the same time, ensure repeatable sand placement conditions for all direct shear tests. The particle size distribution curves for the two types of sand are shown in Figure 1. Both soil types 1&2 are classified as uniformly graded sand, while type_1 is considered medium to coarse and type_2 is considered fine to medium sand.
Dry sand Specimens with different percentage of geo-fibre were prepared inside the direct shear box. Percentages of geo-fibre by dry soil weight used in the current study are 0% (i.e. pure sand), 0.5%, 1%, 1.5% and 2%. At each fibre percentage, four specimens were prepared to be used in direct shear test. In all tests, the void ratio was kept constant trough the specimen by controlling weights of soil particles and fibre content. To maintain constant void ratio of all specimens, a pre-specified mass of dry sand was compacted in the direct shear box (60 mm x 60 mm) to achieve a specific height h. For reinforced sand specimens, a portion of sand equivalent to the volume of the additional geo-fibre was removed, and the sand-fibre admixture was then compacted inside the shear box to the same height, h. The fibre used in this investigation was Polyolefin produced from simple olefin (CnH2n). Yarns length is 30 mm with tensile strength of 533 MPa, Young’s modulus of 7.1 GPa, and specific gravity of 0.91.
After specimen preparation inside the shear box, the box was fixed at the direct shear frame, and a constant normal stress was applied at the steel top cap. Once the soil specimen was fully consolidated, a horizontal stress was applied until the soil specimen failed or suffered excessive horizontal displacement. Vertical and horizontal displacements and shear force are recorded according to ASTM-D3080-90. At each fibre percentage, four soil samples were tested at different normal stress values, σN = 28, 56, 112, and 224 kPa.
4. Experimental Results and Discussions
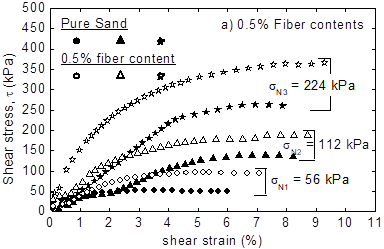
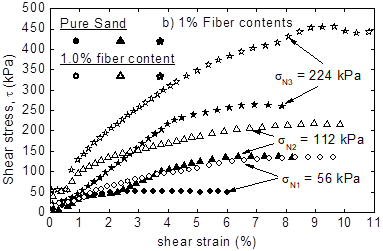
Variation of shear strength (τ) versus shear strain percent at different fibre content percent, and different consolidation stresses (σN) are shown in Fig. 2. For all cases, the reinforced sand showed larger ultimate shear strength compared to pure sand tested at the same normal stress. This is expected as the polymeric fiber is expected to add more confinement and therefore increases the strength of sand. However, in many cases, the ultimate shear strength for reinforced sand occurred at larger shear strain compared to pure sand. This is because the existence of fiber increases the strain required for maximum shear mobilization between soil particles. Moreover, the 1% strain secant shear modulus increased as the percentage of fibre content increased. Secant shear modulus is useful in calculating the elastic settlement of foundation (Bowles 1996). The increase of the secant modulus is due to the initial confinement produced by the inclusion of the geofiber inside the sand.
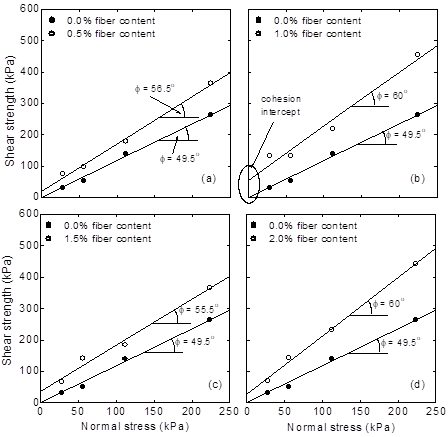
Shear strength envelopes for sand reinforced with different fibre content percent are shown in Fig. 3. Envelop for pure sand is shown in all sub-figures for the sake of comparison. Fig. 3 shows that pure sand has relatively high friction angle ϕ = 49.6°, which means that the sand particles are approximately angular to sub-angular in shape. The figure clearly indicates that for all percentage of fibre contents used in this study, the friction angle was significantly increased beyond the value of pure sand. Despite that the pure sand showed zero cohesion, the fibre reinforced sand showed an apparent tensile cohesion, which is shown by non-zero intercept with shear strength axis in Fig. 3. This indicates that the geo-fibre inclusion in sand introduces an addition tensile strength to its frictional strength.
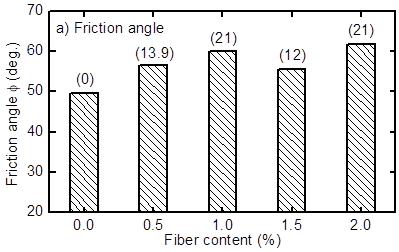
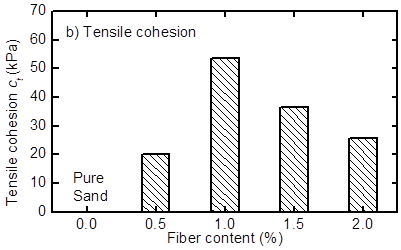
Internal friction angle, ϕ and tensile cohesion, ct inferred from Fig. 3 are plotted in Fig. 4 a&b versus different fibre content percent. Shown also in Fig. 4a, in brackets above each bar, is the percentage increase in the friction angle relative to pure sand value. It is clear from the figure that the friction angle increased as the fibre content percent increased up to 1% fibre content and decreased thereafter. The maximum percentage increase in ϕ was recorded at 1% fibre content was about 21%, which considered as significant improvement. Variation of the tensile cohesion, ct with fibre content percent (Fig. 4b) indicated a trend similar to the variation of the friction angle. The maximum tensile cohesion was measured at 1% fibre content. For other fibre content percent, the tensile cohesion was smaller than that associated with 1% fibre content. The largest friction angle and tensile cohesion occurred at 1% fiber content could be attributed to the volume of fiber relative to the volume of voids in sand. It is expected that at 1% fiber content the volume of fiber is nearly equivalent to the volume of voids. Once the fiber contents increase beyond 1%, it increases the voids in the sand and reduces the shear strength parameters.
5. Practical Application
In this section, a hypothetical model is used to simulate a strip footing over pure sand as well as sand reinforced with different fibre content percent. Shear strength properties measured in direct shear test for pure and improved sand were used to analyse the bearing capacity of the hypothetical footing. Two different possible scenarios for the configurations of reinforced soil arrangement relative to the unreinforced soil are considered. The first arrangement is the top reinforced sand layer has a large thickness so that the failure mode is occurring in this layer. Therefore, the simple Terzaghi bearing capacity equation (Terzaghi 1943) is used in this case to calculate the bearing capacity. The second arrangement is the top reinforced sand has a relatively small thickness to the extent that the full failure mode occurs in the bottom weak layer. In this case, the Meyerhof (1974) and Meyerhof and Hanna (1987) method to calculate ultimate bearing capacity of a continuous footing laying on strong soil layer over a weak soil layer, is applied. The following sections present methods and results of analysis of the two different configurations.
5.1. Relatively Large Thickness (H)
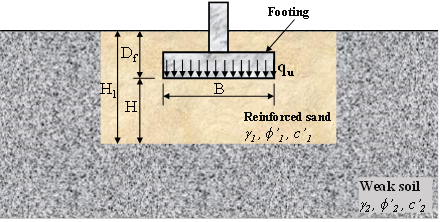
This case is applied, if the depth H in Fig. 5 is relatively large compared to the footing width B, then the failure surface will be completely located in the topsoil layer. The ultimate bearing capacity calculated using Equation 1 represents the upper limit for the ultimate bearing capacity of this problem. To eliminate the effect of foundation depth, all footings were assumed to be constructed at the ground surface with depth of foundation, Df = 0 and foundation width B = 1 m, as shown in Fig. 5.
The assumption of Df = 0 reduced the number of terms used with Terzaghi’s equation to calculate the ultimate bearing capacity of strip footing, qu (Terzaghi 1943) to a shorter form as shown in Equation 1.
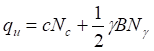
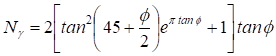
In Equation 1, c is the soil cohesion, g is the soil unit weight, and B is the foundation width. Bearing capacity factors Nc and Ny are calculated, using the soil friction angle f, from Equations 2 and 3 respectively proposed by Vesic (1973).
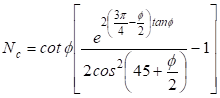
The friction angle (ϕ), measured in direct shear tests and represented in Fig. 4a, is used together with Equations 2 and 3 to calculate the bearing capacity factors Nc and Nc and Ny. Then the measured tensile cohesion ct, shown in Fig. 4b, and bearing capacity factors are used together with Equation 1 to calculate the ultimate bearing capacity, qu for the hypothetical strip footing shown in Fig. 5. In an effort to isolate the effect of friction angle improvement from the effect of tensile cohesion improvement, the bearing capacity is calculated based on each parameter individually in addition to using both parameters together. Results of bearing capacity analysis are shown in Fig. 6.
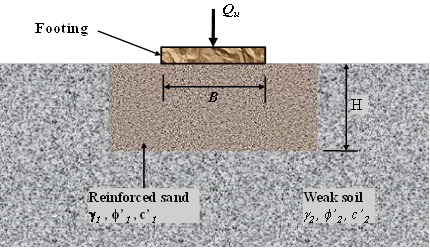
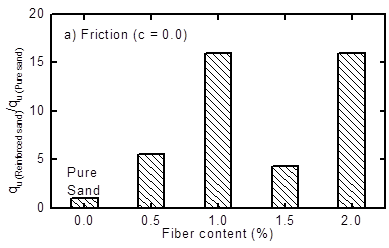
Figure 6a shows the effect of the improvement of friction angle ϕ1 on the bearing capacity of fibre reinforced sand. To isolate the effect of the friction angle, the tensile cohesion was assumed as ct = 0, and the bearing capacity is presented as a ratio relative to pure sand bearing capacity (qu-Reinforced sand/qu-Pure sand). It can be seen that the bearing capacity ratio of fibre reinforced sand is larger compared to that of pure sand (i.e. sand with zero fibre content). In addition, the largest bearing capacity was calculated for sand with 1% fibre content, which showed a bearing capacity ratio of about 15. Similar bearing capacity ratio was calculated at 2% fibre content (Fig. 6a), however, at this fibre content percent, the measured cohesion was less compared to sand with 1% fibre content. In addition, at 2% fiber content, the quantity of fibre was too large to be self randomly distributed. Therefore, it was re-distributed manually, which might affect the uniformity of fibre distribution throughout the soil specimen.
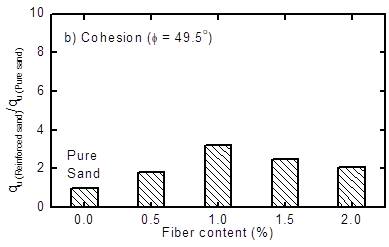
Effect of apparent tensile cohesion (ct) gained due to fibre content on the ultimate bearing capacity ratio is shown in Fig. 6b. The friction angle ϕ is assumed constant for sand with different fibre contents and equal to the pure sand friction angle (i.e. ϕ = 49.5°). It is clear from the figure that bearing capacity ratio is increased with the tensile cohesion which is in turn increased with the fibre content percent. The largest improvement on the bearing capacity was recorded at 1% fibre content, which was about 4 times the bearing capacity of pure sand. However, the effect of friction angle improvement on the bearing capacity ratio (Fig. 6a) is more pronounced compared to the effect of tensile cohesion (Fig. 6b). This is attributed to the presence of the friction angle (ϕ) in calculation of bearing capacity factors Nc and Ng. Equations 2 and 3, showed that Nc and Ny are exponentially changed with the friction angle, ϕ. Therefore, a slight increase in the sand friction angle ϕ resulted in significant increase in both Nc and Ny. The increase in Nc and Ny could be dramatic when the sand friction angle increased beyond ϕ = 40°, as the case of sand used in the current study.
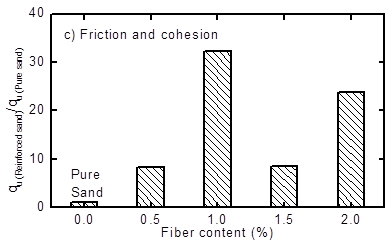
Considering the justification explained above, the effect of fibre improvement on both friction angle ϕ, and tensile cohesion ct on the bearing capacity ratio is shown in Fig. 6c. It could be seen that concurrent improvement on both friction angle and cohesion significantly improved the bearing capacity ratio compared to the effect individual improvement of friction angle (Fig. 5a) or apparent cohesion (Fig. 6b). This attributed to the engagement of both Nc and Ny in the bearing capacity calculation in case of friction angle and cohesion being exists explicitly on the bearing capacity equation. Therefore, introducing geo-fibre in sand resulted in a dramatic improvement of the bearing capacity due to the gaining of tensile cohesion. Fig. 6a concurred the 1% as optimum fibre content in this study. The findings are in agreement with Rong-Her et al. (2011) which reported 1-1.5% optimum fibre content with longer randomly oriented fibre.
5.2. Relatively Small Thickness (H)
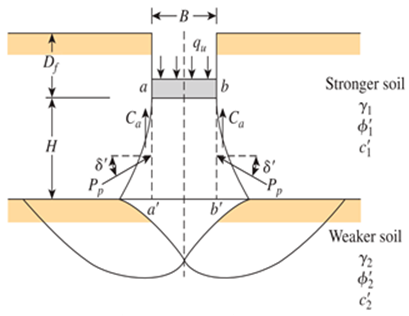
In case of thin layer of reinforced sand under the footing (i.e., H is small relative to the foundation width B), the ultimate bearing capacity procedure presented by Meyerhof (1974) and Meyerhof and Hanna (1987) for a case of a continuous footing laying on strong soil layer over a weak soil layer, is applied. Schematic diagram of this case with all soil properties and footing geometric parameters are shown in Fig. 7. The failure mechanism of this case is expected to be punching shear failure occurs in the topsoil layer, followed by a general shear failure in the bottom soil layer, as shown in Fig. 8. The ultimate bearing capacity for this problem, shown in Fig. 7, can be given as:

The punching shear coefficient Ks, and the adhesion C’a can be obtained from Meyerhof and Hanna (1978), and they are related to ϕ1 and c’1 respectively. Other details about bearing capacity of shallow foundation on layered soil can found in Das et al. (2019). Bearing capacity of the bottom layer qub is calculated using Terzaghi bearing capacity Eq. 5.

Procedures described by Meyerhof and Hanna (1987) are applied through Eqs. 4 and 5 on a footing with width B = 1 m. The reinforced sand properties determined in direct shear tests for fiber length of 30 mm and presented earlier are used for stronger soil layer. Different properties at different fiber contents such as to c’1 and ϕ1 are used with unit weight g1= 19.6 kN/m3. Weak soil properties that is under the reinforced soil is selected to be cohesionless soil with unit weight g2= 14.8 kN/m3, and a friction angle ϕ2= 23o according to M. Attom (2006). The following section presented the parametric study results that considered different fibre contents, thickness of reinforcement layer (H), and different foundation depth (Df).
5.2.1. Effect of Fibre Content and Thickness of Top Layer (H)
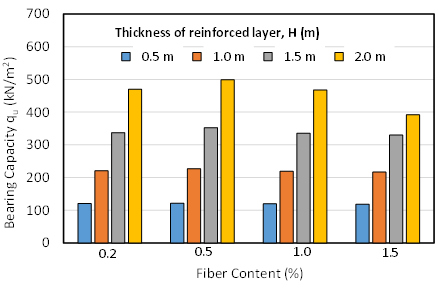
To investigate the effect of the fibre contents and thickness of the reinforced layer, the ultimate bearing capacity was calculated for a continuous footing with B = 1 m. The fibre contents used in calculations are 0.2, 0.5, 1.0 and 1.5% of artificial fibre with 30 mm yarns length. In addition, the thickness of the fibre reinforced layer (H) varies from 0.5 to 2.0 meters at 0.5 meters increments. Figure 9 presents the ultimate bearing capacity at different fibre content percent and at different thickness of top reinforced soil layer. The figure indicates that the ultimate bearing capacity (qu) reaches the largest value at 0.5% fibre content, regardless of the thickness of reinforced soil layer. The bearing capacity decrease as the value of fiber contents increase beyond 0.5%. The figure also indicates that the ultimate bearing capacity (qu) increases with the thickness of the reinforcement layer under the footing, at any fibre content percent.
5.2.2. Effect of Foundation Depth (Df)
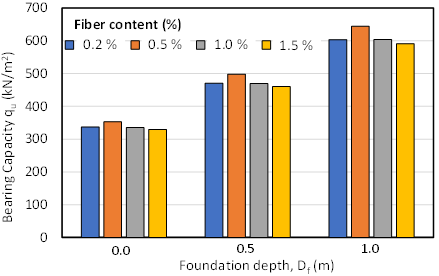
To study the effect of depth of foundation, the ultimate bearing capacity was calculated for a continuous footing, one meter in width, supported by a topsoil layer that is fibre-reinforced with 0.2, 0.5, 1.0 and 1.5% fibre contents, presented earlier, for the 30 mm, natural fibres. Different foundation depth of Df = 0.0, 0.5, and 1.0 m are used in the analysis. Figure 10 shows the effect of foundation depth on the ultimate bearing capacity (qu) at different fiber content percent. It is observed that the ultimate bearing capacity of the continuous footing increases with the increase of depth of foundation (Df) with constant thickness of reinforced layer (H = 1.5 m). It also shows that the foundation depth is more significant in increasing the bearing capacity compared to the fibre percent content. The increase in bearing capacity due to the foundation depth (Df) is explained through Eqs. 4 and 5. Footing with larger Df produces more punching resistance at the top reinforced stronger layer (as in Eq. 4) in addition to larger bearing capacity by bottom weaker layer (qub) as calculated from Eq. 5. It can be also seen from Fig. 10 that the ultimate bearing capacity is the largest at 0.5% fibre content, regardless of the foundation depth.
6. Conclusion
Findings of the study on shallow foundation constructed on fibre reinforced sand underlined by weak cohesionless soil lead to the following conclusions:
- Fibre reinforced sand showed significantly larger ultimate shear strength compared to pure sand, which in turn occurred at larger shear strain compared to pure sand. Moreover, the 1% strain secant shear modulus improved with fibre content percent.
- For all percentage of fibre contents used in this study, the friction angle was significantly increased beyond the value of pure sand. In addition, an apparent tensile cohesion was noticed when fiber was mixed with zero cohesion sand.
- Effect of friction angle improvement on bearing capacity of reinforced sand is more pronounced compared to the effect of cohesion improvement. However, the combined effect of both friction angle and cohesion improvement on bearing capacity is dramatic.
- Regarding the friction angle, cohesion and bearing capacity, it can be concluded that the optimum fiber content percent for the sand used in the current study was found to be 1%. This percentage might be changed if the sand and/or fibre types are changed.
- The ultimate bearing capacity (qu) reaches the largest at fibre content of 0.5%, regardless of the thickness of reinforced soil layer. The bearing capacity decrease as the value of fiber contents increase beyond 0.5%.
- The ultimate bearing capacity of the continuous footing increases with the increase of depth of foundation (Df) at constant thickness of reinforcement layer.
- It also shows that the foundation depth is more significant in increasing the bearing capacity compared to the fiber percent content.
7. Sources of Errors
Error analysis is considered essential, especially in bearing capacity of shallow foundation, Motran et al. (2016). Possible sources of errors may include measurement errors, and modelling errors. More accurate foundation designs can be obtained by estimating errors in soil shear strength measurements. However, the model used remains the main source of errors in shallow foundation design. The soil strength parameter such as the friction angle ϕ, cohesion c are the most essential parameters for ultimate bearing capacity. Many researchers showed great variability for these soil parameters when it measures in the lab. And therefore, the bearing capacity factors Nc, Nq, and Ng of all models which depend on the internal friction angle ϕ, are expected to be different.
The equations developed for Nc, Nq, have been accepted widely, however, no clear agreement on the best equation to calculate Nγ, with many proposed equations. This has become one of the main reasons for significant differences between methods used to estimate qu. Edgar Giovanny (2013) summarised sixty different equations for estimating Nγ in terms of ϕ. Regarding measurement errors, Motran et al. (2016) used guide of the uncertainty in measurement and the Monte Carlo Method to perform measurement uncertainty quantifications. It was found that the measurement uncertainty is approximately ϕ ± 3.16°, where ϕ is the friction angle from 28° to 40°. Regarding the model uncertainty, Motran et al. (2016) concluded that the presence of parameter uncertainty and measurement uncertainty complicates the estimation of model uncertainty.
Acknowledgements
The authors would like to acknowledge the help of Prof. Aqeel Ahmed in conducting the experimental work of this study.
References
[1] Latha G. M. and Murthy V. S. (2007) "Effects of Reinforcement Form on the Behavior of Geosynthetic Reinforced Sand" Geotextiles and Geomembranes: (25), 23-32.
View Article
[2] Al-Refeai T. (1991) "Behavior of granular soils reinforced with discrete randomly oriented inclusions" Geotextiles and Geomembranes: (10) 319-333.
View Article
[3] Ranjan G., Vasan R. M., Charan H. D. (1994) "Behavior of plastic fibre-reinforced sand" Geotextiles and Geomembranes: (13), 555-565.
View Article
[4] Gray D. H., Al-Refeai T. (1986) "Behaviour of fabric vs. fiber reinforced sand" Journal of Geotechnical Engineering, ASCE: 112 (8), 804-820.
View Article
[5] Yetimoglu T., Salbas O. (2003) "A study on shear strength of sands reinforced with randomly distributed discrete fibers" Geotextiles and Geomembranes: 21 (2), 103-110.
View Article
[6] Consoli N. C., Prietto P. D. M., Ulbrich L. A. (1998) "Influence of fiber and cement addition on behaviour of sandy soil" Journal of Geotechnical and Geoenvironmental Engineering, ASCE: 124 (12), 1211-1214.
View Article
[7] ASTM -D3080 (1990) "Method for Direct Shear Test of Soils under Consolidated Drained Conditions" American Society for Testing and Materials, Philadelphia, Pennsylvania, USA.
[8] Bowles J. E., (1996) "Foundation Analysis and Design" 5th Ed., McGraw-Hill, New York.
[9] Terzaghi K. (1943) "Theoretical Soil Mechanics," John Wiley, New York.
View Article
[10] Vesic A. S. (1973) "Analysis of ultimate loads of shallow foundations" J. Soil Mech. Found. Div., ASCE: 99(1), 45-73.
View Article
[11] Rong-Her C., Po-Chuan C., Tai-Ching W., Chia-Chun H. (2011) "Shear Strength of continuous-Filment reinforced Sand" Journal of GeoEngineering: 6 (2), 99-107.
[12] El-Emam M. M. (2009) "Settlement and stress characteristics of reinforced soft clay strata under strip footing: A numerical study," Int. Conf. on Computational Design in Engineering, CODE2009, Seoul, Korea, 9p.
[13] Tang C., Shi B., Gao W., Chen F., Cai Y., (2007) "Strength and mechanical behavior of short polypropylene fiber reinforced and cement stabilized clayey soil" Geotextiles and Geomembranes: 25(3), 194-202.
View Article
[14] Dal Toé Casagrande M., Consoli N. C., and Thomé A. (2009) "Behavior of plate tests bearing on fiber-reinforced sand" Proceedings of the 17th International Conference on Soil Mechanics and Geotechnical Engineering, M. Hamza et al. (Eds.), 905-908, doi:10.3233/978-1-60750-031-5-905.
[15] Ahmad F., Bateni F., Azmi M. (2010) "Performance evaluation of silty sand reinforced with fibers," Geotextiles and Geomembranes: (28), 93-99.
View Article
[16] Anagnostopoulos S. A., Tzetzis D., Berketis K. (2014) "Shear strength behaviour of polypropylene fibre reinforced cohesive soil," Geomechanics and Geoengineering: 9(3), 241-251.
View Article
[17] Meyerhof G. G., Hanna A. M. (1978) "Ultimate bearing capacity of foundations on layered soils under inclined load," Canadian Geotech. J: 15(4), 565-572.
View Article
[18] Hejazi S. M., Shaeikhzadeh S. M., Abtahi S. M., Zadhoushaa A. (2012) "A simple review of soil reinforcement by using natural and synthetic fibers," Construction and Building Materials, 100-116.
View Article
[19] Attom M. (2006) "The use of shredded waste tires to improve the geotechnical engineering properties of sands," Environ Geology, vol. 49, 497-503.
View Article
[20] Meyerhof, G.G. (1974) "Ultimate Bearing Capacity of Footings on Sand Layer Overlying Clay" Canadian Geotechnical Journal, 11, 223-229.
View Article
[21] Das B. M., Sivakugan N. (2019) "Principles of Foundation Engineering, Cengage, Boston, MA 02210 USA, Ninth SI Edition.
[22] Edgar Giovanny, D.S. (2013) "Assessment of the range of variation of Nγ from 60 estimation methods for footings on sand" Can. Geotech. J. 50, 793-800.
View Article
[23] Motran H.B., Stutz H., Wuttke F. (2016) "Quality assessment of soil bearing capacity factor models of shallow foundations" Soils and Foundations 56(2): 265-276.
View Article
[1] Latha G. M. and Murthy V. S. (2007) "Effects of Reinforcement Form on the Behavior of Geosynthetic Reinforced Sand" Geotextiles and Geomembranes: (25), 23-32. View Article
[2] Al-Refeai T. (1991) "Behavior of granular soils reinforced with discrete randomly oriented inclusions" Geotextiles and Geomembranes: (10) 319-333. View Article
[3] Ranjan G., Vasan R. M., Charan H. D. (1994) "Behavior of plastic fibre-reinforced sand" Geotextiles and Geomembranes: (13), 555-565. View Article
[4] Gray D. H., Al-Refeai T. (1986) "Behaviour of fabric vs. fiber reinforced sand" Journal of Geotechnical Engineering, ASCE: 112 (8), 804-820. View Article
[5] Yetimoglu T., Salbas O. (2003) "A study on shear strength of sands reinforced with randomly distributed discrete fibers" Geotextiles and Geomembranes: 21 (2), 103-110. View Article
[6] Consoli N. C., Prietto P. D. M., Ulbrich L. A. (1998) "Influence of fiber and cement addition on behaviour of sandy soil" Journal of Geotechnical and Geoenvironmental Engineering, ASCE: 124 (12), 1211-1214. View Article
[7] ASTM -D3080 (1990) "Method for Direct Shear Test of Soils under Consolidated Drained Conditions" American Society for Testing and Materials, Philadelphia, Pennsylvania, USA.
[8] Bowles J. E., (1996) "Foundation Analysis and Design" 5th Ed., McGraw-Hill, New York.
[9] Terzaghi K. (1943) "Theoretical Soil Mechanics," John Wiley, New York. View Article
[10] Vesic A. S. (1973) "Analysis of ultimate loads of shallow foundations" J. Soil Mech. Found. Div., ASCE: 99(1), 45-73. View Article
[11] Rong-Her C., Po-Chuan C., Tai-Ching W., Chia-Chun H. (2011) "Shear Strength of continuous-Filment reinforced Sand" Journal of GeoEngineering: 6 (2), 99-107.
[12] El-Emam M. M. (2009) "Settlement and stress characteristics of reinforced soft clay strata under strip footing: A numerical study," Int. Conf. on Computational Design in Engineering, CODE2009, Seoul, Korea, 9p.
[13] Tang C., Shi B., Gao W., Chen F., Cai Y., (2007) "Strength and mechanical behavior of short polypropylene fiber reinforced and cement stabilized clayey soil" Geotextiles and Geomembranes: 25(3), 194-202. View Article
[14] Dal Toé Casagrande M., Consoli N. C., and Thomé A. (2009) "Behavior of plate tests bearing on fiber-reinforced sand" Proceedings of the 17th International Conference on Soil Mechanics and Geotechnical Engineering, M. Hamza et al. (Eds.), 905-908, doi:10.3233/978-1-60750-031-5-905.
[15] Ahmad F., Bateni F., Azmi M. (2010) "Performance evaluation of silty sand reinforced with fibers," Geotextiles and Geomembranes: (28), 93-99. View Article
[16] Anagnostopoulos S. A., Tzetzis D., Berketis K. (2014) "Shear strength behaviour of polypropylene fibre reinforced cohesive soil," Geomechanics and Geoengineering: 9(3), 241-251. View Article
[17] Meyerhof G. G., Hanna A. M. (1978) "Ultimate bearing capacity of foundations on layered soils under inclined load," Canadian Geotech. J: 15(4), 565-572. View Article
[18] Hejazi S. M., Shaeikhzadeh S. M., Abtahi S. M., Zadhoushaa A. (2012) "A simple review of soil reinforcement by using natural and synthetic fibers," Construction and Building Materials, 100-116. View Article
[19] Attom M. (2006) "The use of shredded waste tires to improve the geotechnical engineering properties of sands," Environ Geology, vol. 49, 497-503. View Article
[20] Meyerhof, G.G. (1974) "Ultimate Bearing Capacity of Footings on Sand Layer Overlying Clay" Canadian Geotechnical Journal, 11, 223-229. View Article
[21] Das B. M., Sivakugan N. (2019) "Principles of Foundation Engineering, Cengage, Boston, MA 02210 USA, Ninth SI Edition.
[22] Edgar Giovanny, D.S. (2013) "Assessment of the range of variation of Nγ from 60 estimation methods for footings on sand" Can. Geotech. J. 50, 793-800. View Article
[23] Motran H.B., Stutz H., Wuttke F. (2016) "Quality assessment of soil bearing capacity factor models of shallow foundations" Soils and Foundations 56(2): 265-276. View Article