International Journal of Civil Infrastructure (IJCI)
ISSN: 2563-8084

Volume 7 - Year 2024- Pages 73-83
DOI: 10.11159/ijci.2024.008
Stability Assessment of Crown Pillar for an Underground Mine Using K-Cross Validation Technique
Sumant Mohanto1, Debasis Deb2, Amrites Senapati3
1Visvesvaraya National Institute of Technology, Nagpur, Department of Mining Engineering
South Ambazari Road, Nagpur, Maharashtra, India - 440010
sumantmohanto@mng.vnit.ac.in
2Indian Institute of Technology, Kharagpur, Department of Mining Engineering
Paschim Medinipur, Kharagpur, West Bengal, India - 721302
deb@iitkgp.ac.in
3National Institute of Technology, Surathkal, Department of Mining Engineering
Surathkal, Mangalore, Karnataka, India - 575025
amrites.s@gmail.com
Abstract - The role of crown pillar between two main levels in any underground metalliferrous mine plays a crucial role in maintaining the stability of the extracted open stopes. Thus, the dimension of the crown pillar left intact between the main levels in the underground should be competent enough to withstand the induced stresses developed as a result of extraction as well as blasting, especially in large scale production methods such as large-diameter blasthole stoping method. In addition to the crown pillars in adjacent levels, a barrier crown pillar of sufficient thickness is also left intact between the ultimate pit bottom and the first level of extraction. These horizontal pillars are of utmost importance as it is one of the deciding factors in determining the stability of the existing underground structures throughout the life of mine. The present study focuses on the stability of a crown pillar left intact between two main levels existing below an open pit mine operating simultaneously with the underground mine. The targeted proposed production of the underground mine is around 5 million tonne per annum. In this paper, 135 finite element simulation models of the underground mine have been analyzed considering elasto-plastic material model. The simulation models are evaluated in terms of plastic damage index with variation in rock mass properties, thickness of crown pillar, stope-extraction sequence and mining depth. Based on the results obtained, some useful conclusions have been drawn considering multi-variate regression and k-cross validation models.
Keywords: Crown pillar ⋅ Underground structures ⋅ Plastic damage index ⋅ Multi-variate regression ⋅ k-fold cross validation.
© Copyright 2024 Authors - This is an Open Access article published under the Creative Commons Attribution License terms. Unrestricted use, distribution, and reproduction in any medium are permitted, provided the original work is properly cited.
Date Received: 2023-10-11
Date Revised: 2024-05-29
Date Accepted: 2024-06-03
Date Published: 2024-07-02
1. Introduction
Pillars are one of the most essential structural units in any underground mines; which, not only ensure safety to workings but also maximize the ore body extraction [1]. The primary purpose of the natural pillars is to provide overall safe access to working area and also support the overlying strata and overburden stresses between adjacent underground levels. The intact left-over natural pillars in underground metalliferous mines includes the rib pillar, sill pillar, crown pillar, barrier pillar, shaft pillar, and post pillars. The crown pillars left intact in the underground mines are the in-situ rock existing between two main levels [2]. The role of crown pillars is to maintain the stability around mined-out excavations and also control the local displacements in surrounding rock strata. Thus, the economic and safe design of the pillar support system should fulfil the structural stability of the mine [3]. The dimension of crown pillar in metal mines plays an important role to determine the stability of surrounding rock structures especially when dealt with large-scale production methods such as large diameter blasthole (LDBH) stoping method. An under-designed pillar may not sustain the induced stresses developed during stoping and may lead to the collapse of both crown and rib pillars. On the other hand, ores are locked in an over-designed crown pillar and hence, it reduces the ore recovery. Very few studies have been carried out so far to determine and predict the thickness of the crown pillar between two underground levels; however, the study remains limited to surface/barrier crown pillar with longitudinal method adopted for extraction of stopes [4]. There exists no literature to determine and predict the thickness of crown pillar considering transverse method of stope extraction with thick orebodies.
The present study focuses on stability of crown pillars in an underground copper mine with transverse method of stope extraction using three-dimensional non-linear finite element (FE) analyses using ANSYS Workbench Version 2023 [5]. Elasto-plastic constitutive plasticity model has been used to simulate the rock mass stress-strain response. The numerical model results are evaluated in terms of a plastic damage index ‘η ’ as proposed by Mohanto and Deb [6]; where, η is the ratio of effective plastic strain to effective total strain. Parametric study is also carried out varying parameters such as material properties, stope-extraction sequence, thickness of crown pillar and mining depth for determining the significance of independent variables with η . Multi-variate regression (MVR) and k-cross validation models have also been developed considering the mentioned input parameters. From this study, it is quite apparent that the adopted methodology can be applied in similar field conditions as there is hardly any literature reported for crown pillar stability with transverse method of stope extraction.
2. Three-dimensional Numerical Modelling of the Underground Mine
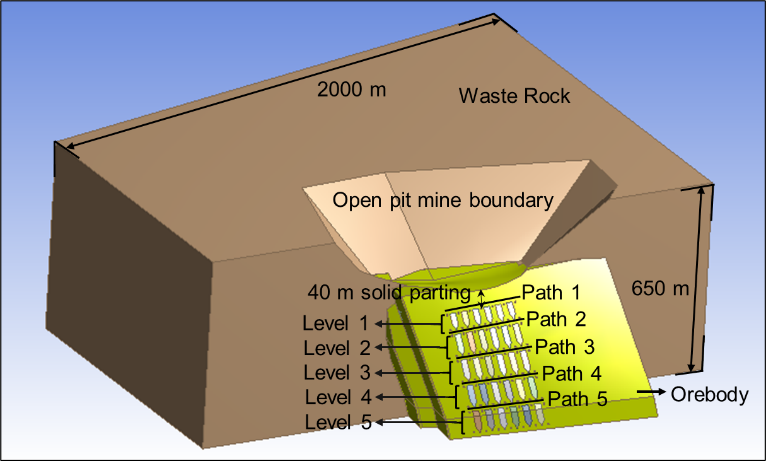
Figure 1 shows the underground mine model geometry below a surface mine, considered for this study. Transverse method of stope extraction is carried out owing to the thicker ore deposit, i.e., stope extraction across the strike direction. The surrounding rock mass includes the orebody (OR) surrounded by waste rock (WR). Five working levels have been considered for the present study with level interval (LI) of 60 m for the first level followed by level interval of 75 m for the subsequent lower levels. In a particular level, two active stopes are operating in each level to meet the production target of the underground mine. A minimum thickness of 40 m surface crown pillar is maintained above the extracted mined-out stopes; thereby, providing overall stability and support to the underground structures. The crown pillar extends throughout the entire stope length from the hanging wall towards footwall side. It is assumed that the all the stopes in a particular level are backfilled before undergoing stope extraction in the lower levels.
2. 1. Rock Mass Properties considered for the study
The borehole rock samples collected from the Malanjkhand copper mine are tested in the laboratory of IIT Kharagpur to determine their strength properties of the intact rock. For incorporating the field conditions, degree of disturbance (D) and geological strength index (GSI) are used to determine the properties of rock mass. To reduce the geo-mechanical properties of the intact rock, RocData Version 4.0 [7] is used. Table 1 shows the rock mass properties considered for the study; where M1: weak rock mass, M2: moderate rock mass representing field conditions and depicting average value of strength values and GSI, and M3: strong rock mass.
Table 1. Material Properties considered for the numerical analyses.
|
Particulars |
M1 |
M2 |
M3 |
|||
|
OR |
WR |
OR |
WR |
OR |
WR |
|
|
GSI |
60 |
60 |
65 |
65 |
70 |
70 |
|
σcm (MPa) |
7.9 |
12.8 |
13.8 |
17.5 |
20.9 |
23.8 |
|
Em (GPa) |
5.2 |
8.8 |
8.5 |
11.1 |
11.8 |
13.5 |
|
fm (deg.) |
51.3 |
55 |
54.7 |
56.4 |
57.5 |
57.8 |
|
cm (MPa) |
2.9 |
3.6 |
3.6 |
4.0 |
4.4 |
4.5 |
2. 2. Loading and Boundary Condition
A 40 m surface crown pillar is kept intact between the first level stopes and ultimate pit bottom. The ground level elevation for Malanjkhand mine is 580 mRL; whereas, the vertical depth of the numerical model is kept 640 m with 240 m of open pit mine depth from surface, 40 m intact surface crown pillar and 360 m of stoping for all levels including the thickness of crown pillars. The maximum (σH) and minimum (σh) values of principal horizontal stress are determined for the Malanjkhand copper mine as provided by given equations below:
where Vd is the vertical depth measured from the ground level. These equations have been taken from the Geotechnical report provided by Malanjkhand mine, based on hydrofracturing test carried out for the mine site.
The principal horizontal stresses calculated from equations (1) and (2) are then applied onto the side faces of underground mine model based on their depth; whereas, the opposite faces are constricted in x and z directions, respectively. To incorporate the in-situ stresses, gravity loading is also applied in y-direction.
2. 3. Input Variables for Parametric Study
A parametric sensitivity study is carried out for determining η based on the variation of the four regressors, i.e., material ratio MR (3 variations: M1, M2 and M3), crown pillar ratio CPR (3 variations: 10 m (C1), 12 m (C2) and 15 m (C3)), stope sequence ratio SSR (3 variations: PRP (S1), PRSRP (S2) and PRSRSRP (S3); where P: Primary stope, R: Rib pillar and S: Secondary stope) and depth ratio DR (5 variations for 5 different levels). A total of three different variations are considered for the sequence of stope extraction for a particular level, i.e., S1, S2 and S3. The nomenclature P refers to the primary stope which is first extracted; whereas, R and S are the rib pillar and the secondary stope which will be extracted at a later stage. The schematic sketch of sequence of stope extraction S3 is shown in Figure 5; where the extracted volume is calculated by subtracting the volume of the vertical intact pillar (between two primary stopes) from the total volume. The total volume comprises the volume of the vertical intact pillar with half the volume of extracted primary stopes on either side. The stope sequence ratio values for all the variations of crown pillar thickness and LI are tabulated in Table 2. The last regressor considered is the mining depth; five depth levels are studied to evaluate the effect of depth of working on the crown pillar stability of a particular level.
All the independent parameters considered are made dimensionless as ratios to compare the simulation results in a better way. The terms MR, CPR, SSR and DR are defined as:
where i and j are the number of variations of that particular parameter.
For depth ratio, i = 1-5 (C1), 6-10 (C2) and 11-15 (C3); whereas, j = 5 (C1), 10 (C2) and 15 (C3). Table 3 shows the depth ratios for all variations of crown pillar thickness. For crown pillar thickness variations, the height of stope changes accordingly to constrain the LI of 60 m or 75 m in the respective levels. Therefore, a total of 15 variations in DR are analyzed considering five different depths of working.
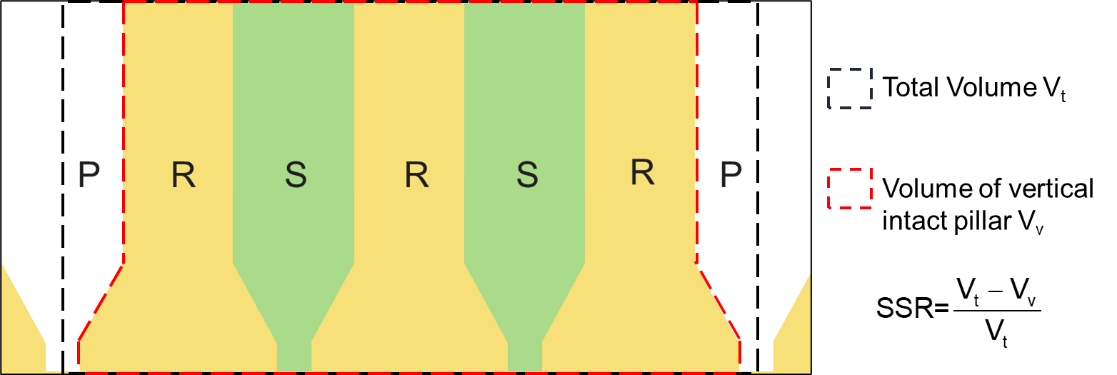
Table 2. Stope sequence of extraction ratio considered for the study.
|
Stoping sequence |
C1 |
C2 |
C3 |
|||
|
60mLI |
75mLI |
60mLI |
75mLI |
60mLI |
75mLI |
|
|
PRP |
0.426 |
0.443 |
0.423 |
0.442 |
0.418 |
0.439 |
|
PRSRP |
0.213 |
0.222 |
0.212 |
0.221 |
0.209 |
0.219 |
|
PRSRSRP |
0.142 |
0.148 |
0.141 |
0.147 |
0.139 |
0.146 |
3. Results and Discussions
The numerical simulation results are assessed along pre-defined paths 1-5 as shown in Figure 1 in terms of η. For the present study, the constitutive model considered is Drucker-Prager failure criterion. The damage classification table given by Mohanto and Deb [6] is used to analyze the extent of damage as a result of stope extraction. The sign convention for compressive stress is taken as negative; whereas, tensile stress is considered as positive.
Table 3. DR values considered for the study.
|
DRa |
Ratio |
DRa |
Ratio |
DRa |
Ratio |
|
DR1 |
0.122 |
DR6 |
0.122 |
DR11 |
0.123 |
|
DR2 |
0.297 |
DR7 |
0.295 |
DRR12 |
0.291 |
|
DR3 |
0.531 |
DR8 |
0.530 |
DR13 |
0.528 |
|
DR4 |
0.766 |
DR9 |
0.765 |
DR14 |
0.764 |
|
DR5 |
1.000 |
DR10 |
1.000 |
D15 |
1.000 |
where a = i or j
3. 1. Effect of material ratio MR
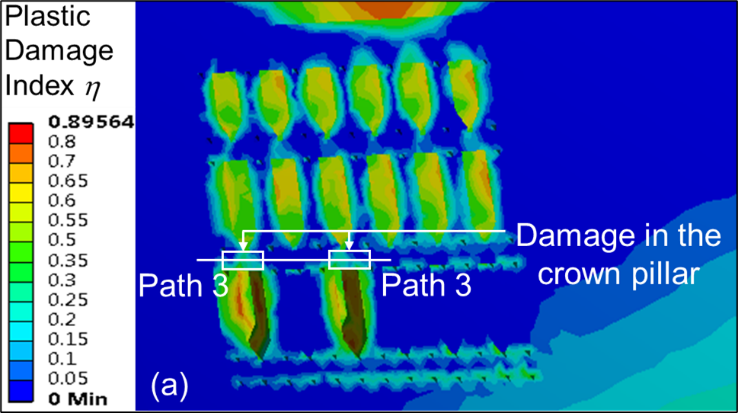
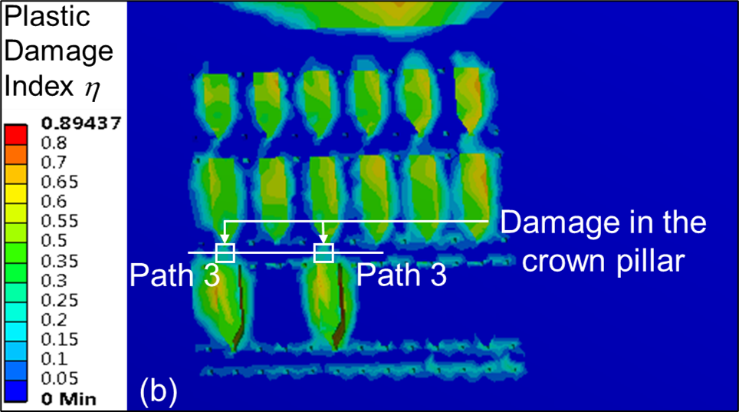
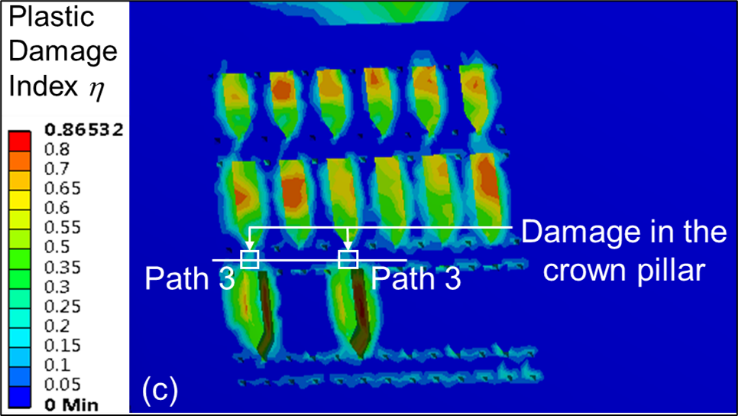
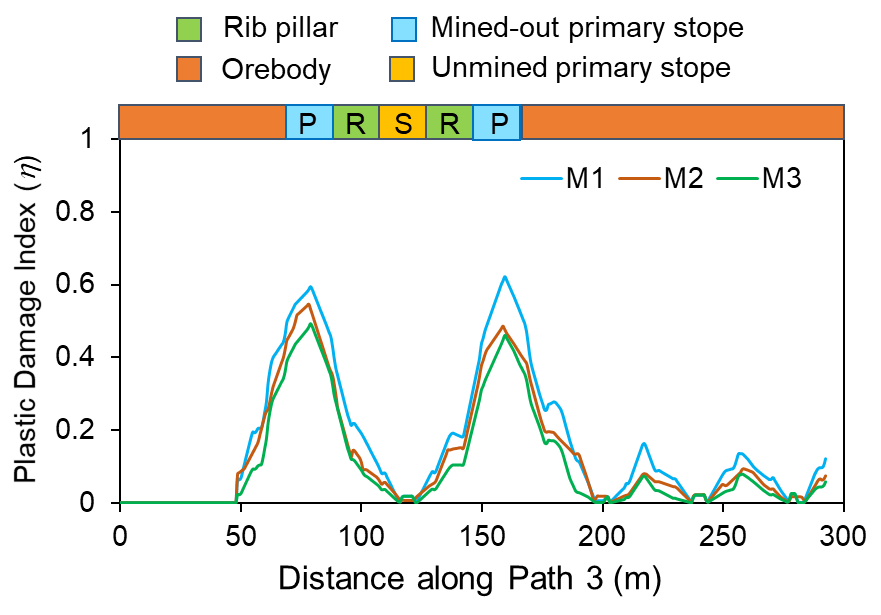
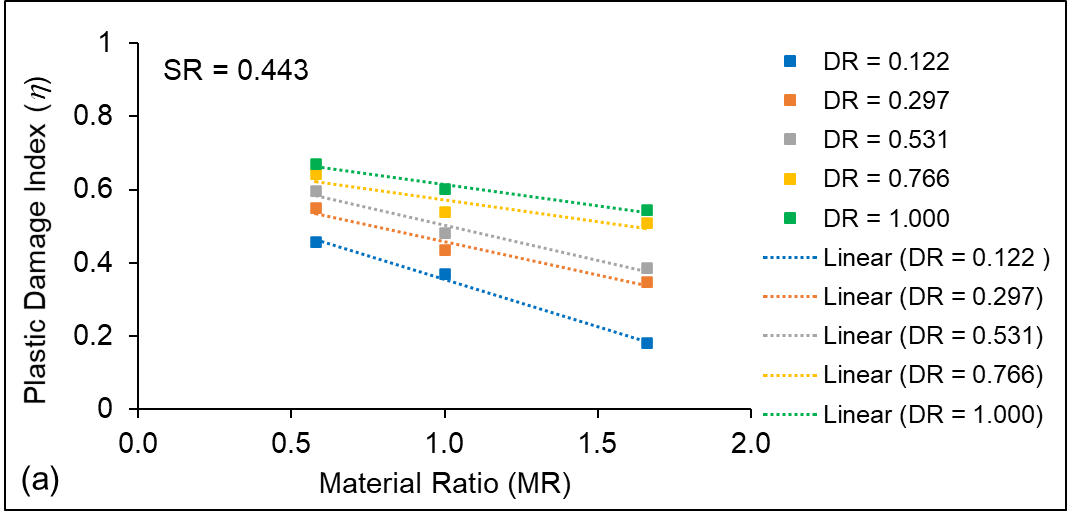
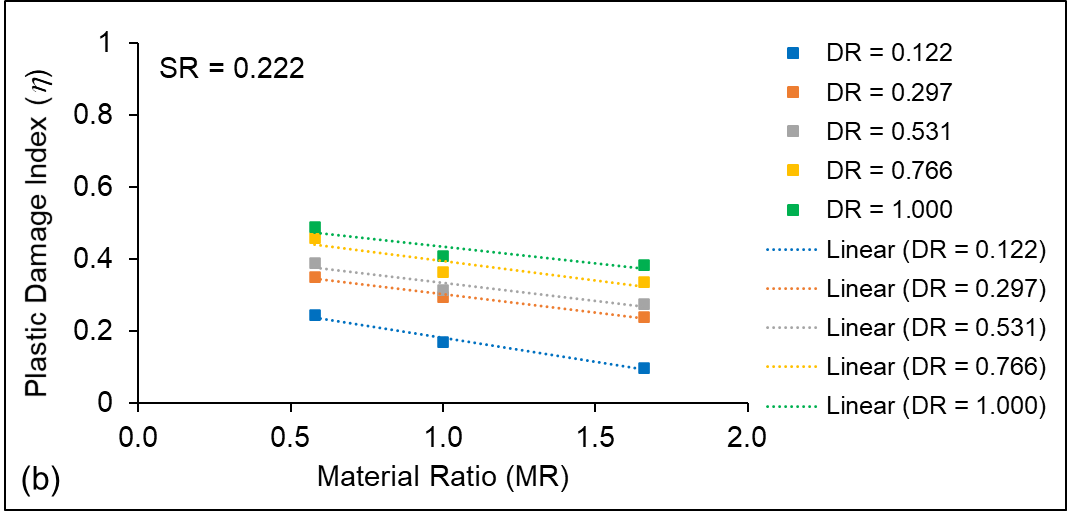
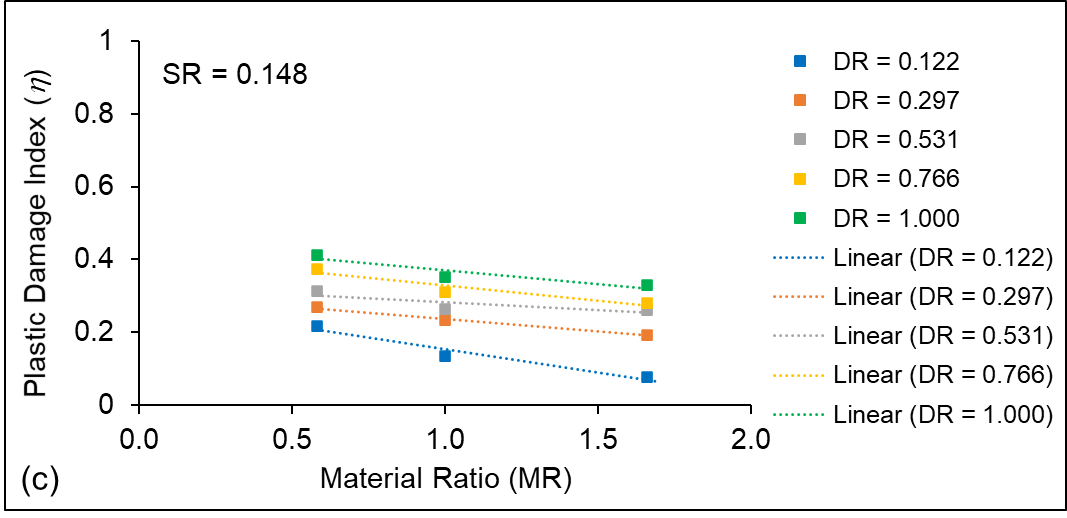
Figures 3 (a – c) show the η contour plots after third level stopes have been extracted for different material ratio ‘MR’ values, keeping the other independent variables fixed for each of the numerical models. In this study, the crown pillar thickness is taken as 12 m. From the contour plots, it is observed that the damage in the crown pillar is higher for M1 material type as compared with M2 and M3. The graphical plot of η along path 3 for different rock mass properties, i.e., M1, M2 and M3 is shown in Figure 4. From the plot, it is inferred that the maximum value of η varies between 0.4 and 0.5 for material M2 and M3 above the extracted stopes in the crown pillar; which indicates that the damage ranges from slight to moderate. However, the maximum value of η is found to be around 0.6 for material M1; thereby, signifying moderate damage. Thus, yielding of the crown pillar just above the extracted stopes may occur for material type M1, i.e., lower range of GSI. However, the condition improves with change in material properties to M2 (moderate rock mass type) and M3 (strong rock mass type). The average η value is estimated considering different variations in each of the individual input parameters. Figure 5 (a–c) show the impact of parameter material ratio ‘MR’ on the average η value for different values of stope sequence ratio ‘SSR’ and mining depth ratio ‘DR’ considering 12 m crown pillar thickness (CP2).
The simulation results indicate that the average value of η drops linearly with an increase in material ratio ‘MR’ values from 0.58 to 1.66 for different sequence of stope extraction. The similar trend is also observed for different variation in crown pillar ratio ‘CPR’, stope sequence ratio ‘SSR’ and mining depth ratio ‘DR’.
3. 2. Effect of crown pillar ratio CPR
Contour plots of η due to fourth level extraction (material M2) for crown pillar thickness C1, C2 and C3 are shown in Figures 6 (a–c), respectively. From the contour plots, it is evident that η value is higher and prominent when the thickness of crown pillar is 10 m as compared with C2 (12 m) and C3 (15 m) condition. Figure 7 show the profile plot of η along the pre-defined path 4 for different variations in thickness of crown pillar, i.e., C1, C2 and C3. It can be observed that the maximum value of η reaches up to 0.8 (high damage) above the mined-out stope for 10 m thick crown pillar; whereas, it varies in the range of 0.4 – 0.6 (moderate damage) for 12 m and 15 m crown pillar thickness.
Figures 8 (a–c) show the relationship of plastic damage index η as a function of crown pillar ratio ‘CPR’ for different material types, i.e., M1, M2 and M3, respectively. The simulation results show that the average η values drop with increase in crown pillar ratio ‘CPR’ from C1 (10 m) to C3 (15 m) for different material ratios ‘MR’ values. It can be attributed to the fact that variation in crown pillar thickness results in high-stress concentration in the crown pillar above the mined-out stopes. Similar trends are observed for other variations in material ratio ‘MR’, stope sequence ratio ‘SSR’ and mining depth ratio ‘DR’.
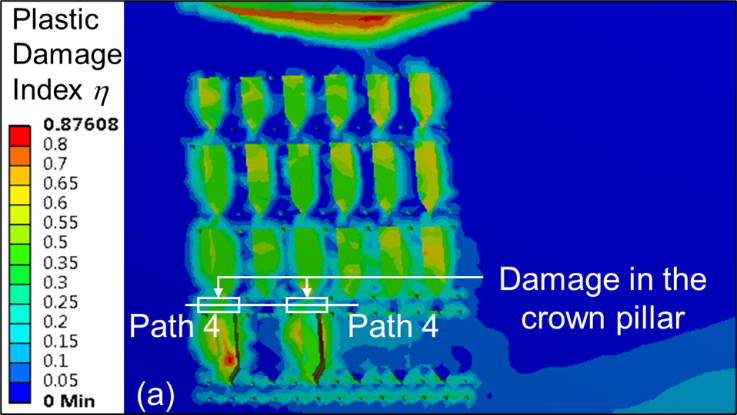
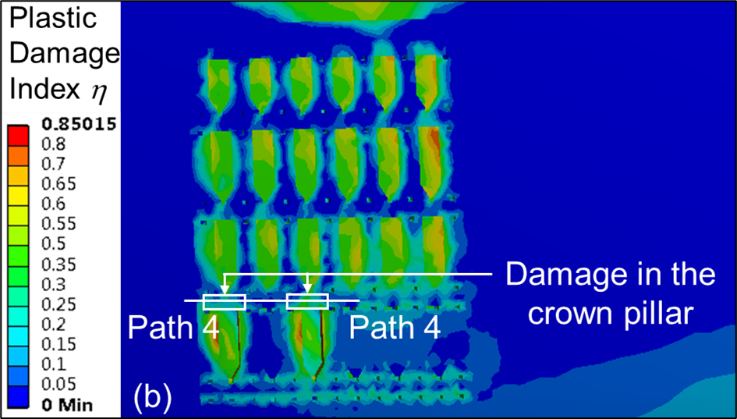
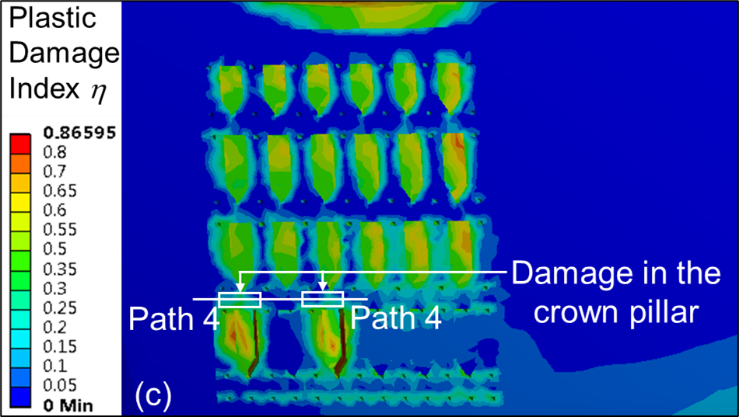 Figure 6. Contour plots for η for crown pillar (a) C1, (b) C2 and (c) C3.
3. 3. Effect of stope sequence ratio SSR
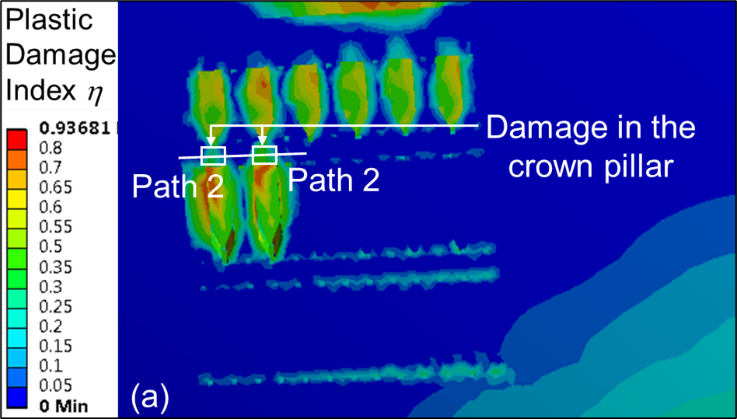
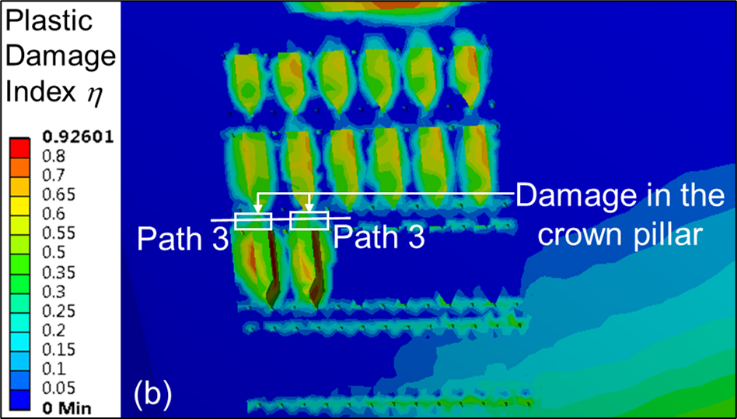
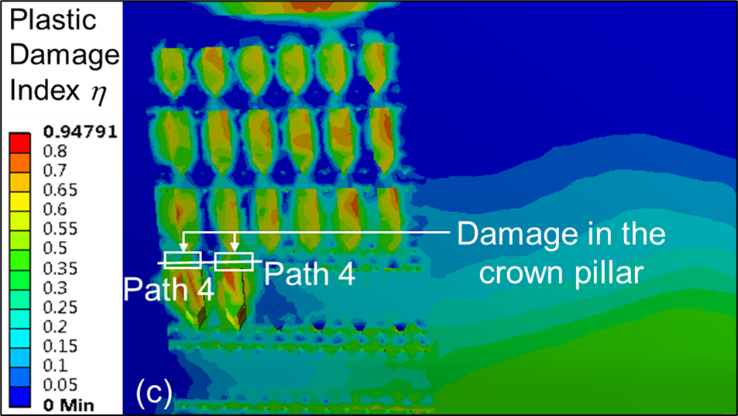
Figures 9 (a–c) show the contour plots of η for material type M1 due to second level extraction and crown pillar thickness C1 for S1, S2 and S3 sequence of extraction, respectively. The plot of η along pre-defined path 2 due to second level extraction with material M1 for all sequence of extraction is shown in Figure 10.
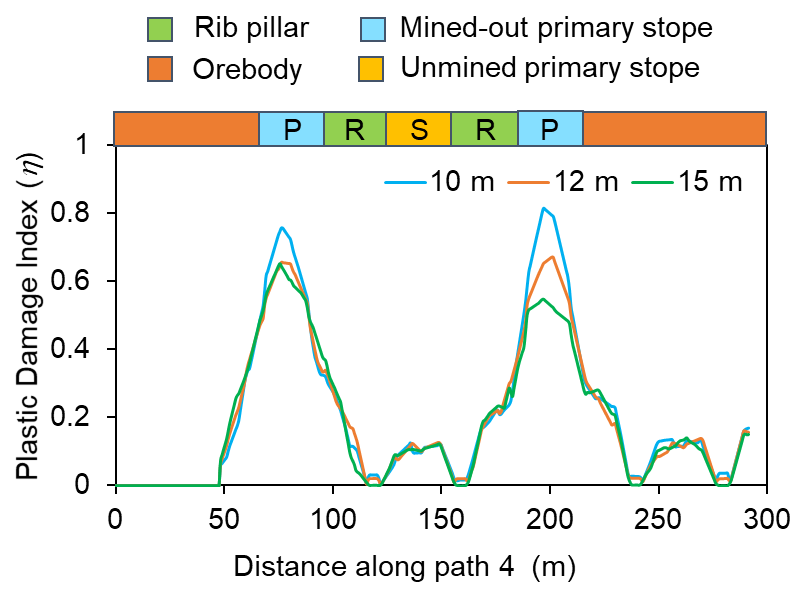
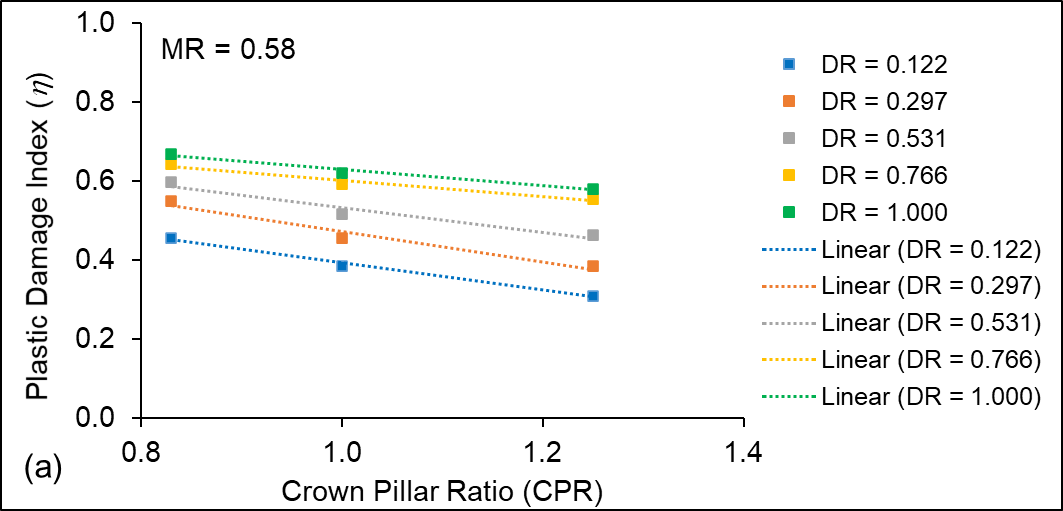
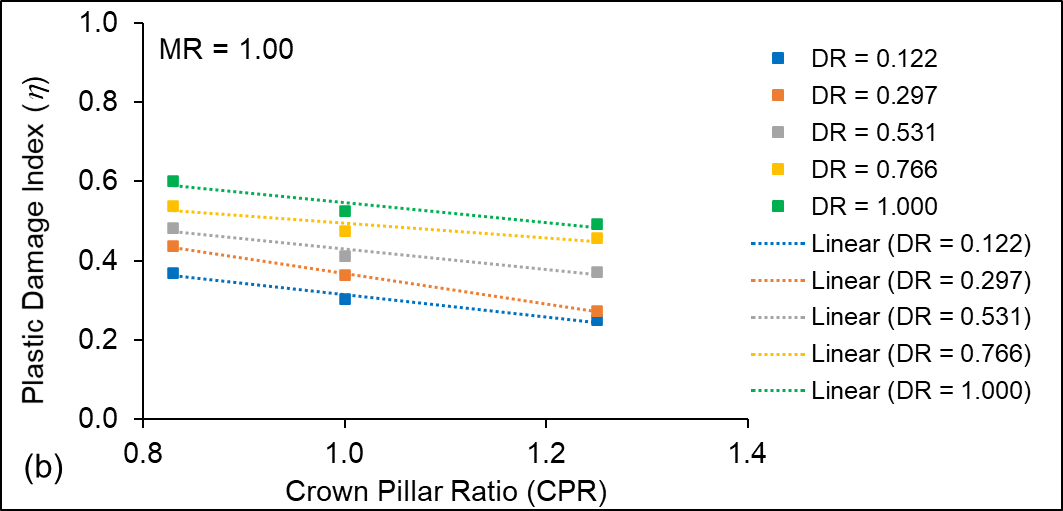
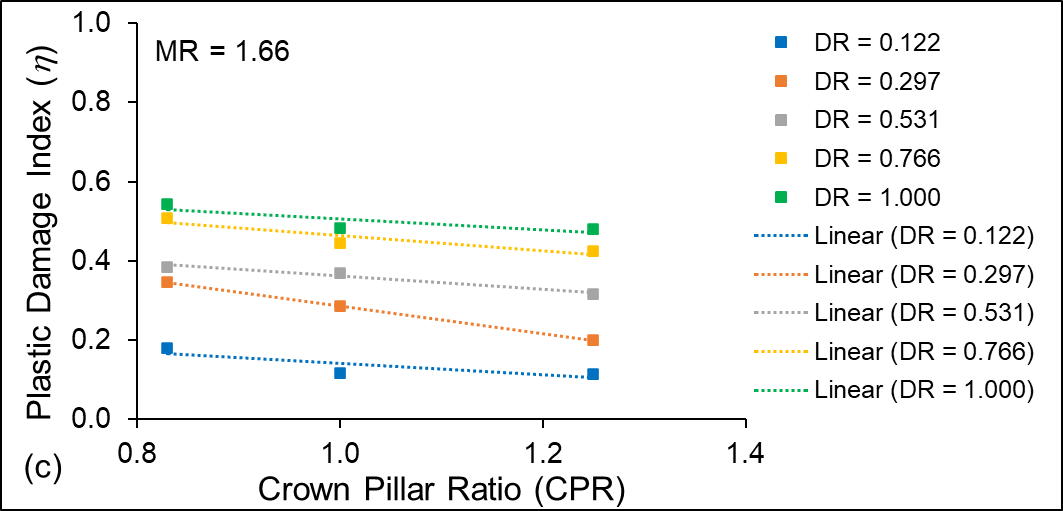 Figure 8. Variation of average η values with change in crown pillar ratio CPR for material (a) M1, (b) M2 and (3) M3.
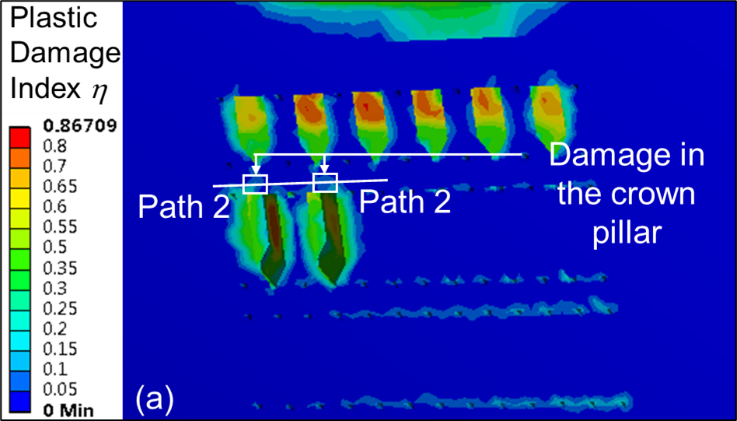
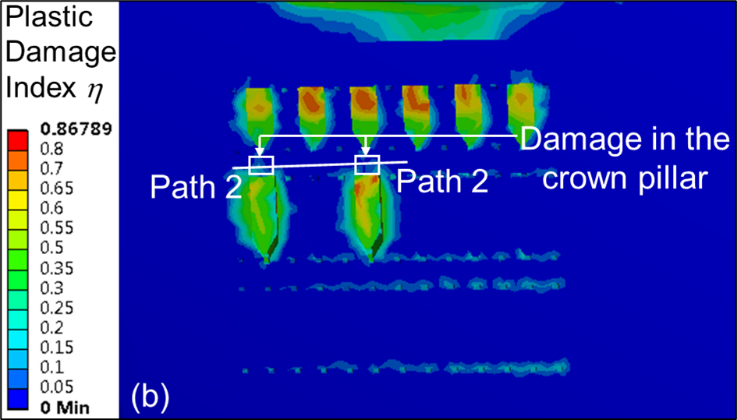
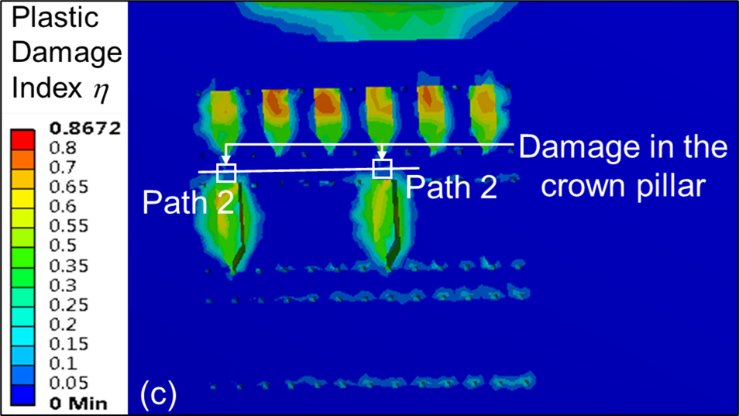
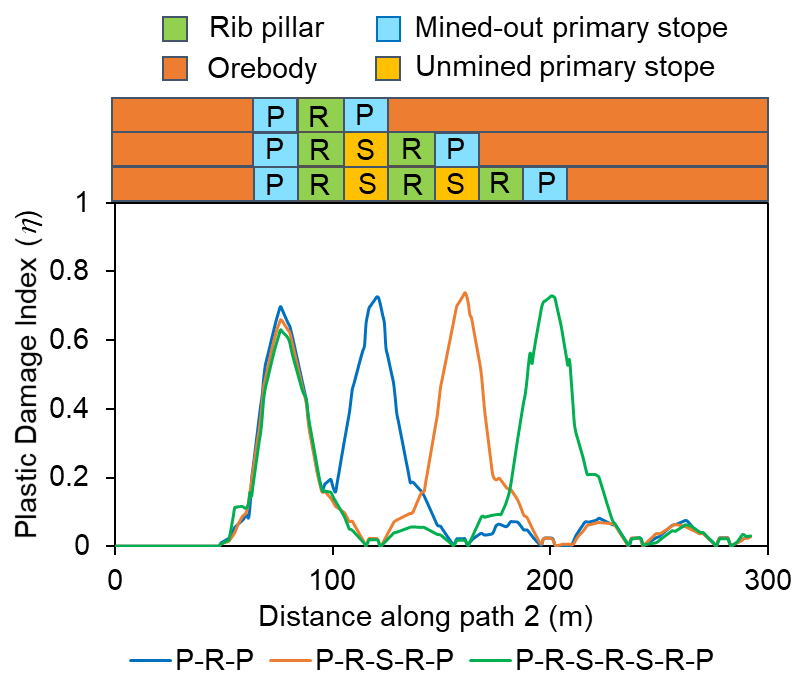
The magnitude of the η is found to be maximum at the mid-portion of the mined-out stope; however, it reduces in the area above the intact rib pillar due to redistribution of stresses. It can be observed that the maximum value of η above the extracted stope varies in the range of 0.6 – 0.72 for different sequences of extraction; thereby, indicating Class V damage (high damage) of the rock strata. However, it should be noted that artificial support such as rock and/or cable bolting (practiced in underground mines) is not taken into consideration in these modelling works. Further, backfilling of void stopes may improve the rock mass condition by providing adequate confinement. The average η values, however, increases with increase in stope sequence ratio ‘SSR’ along the crown pillar length.
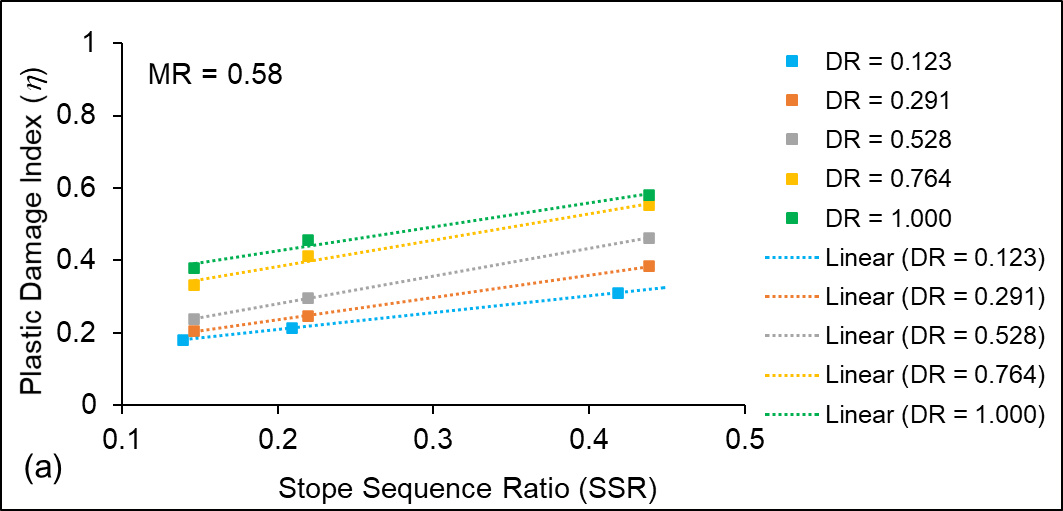
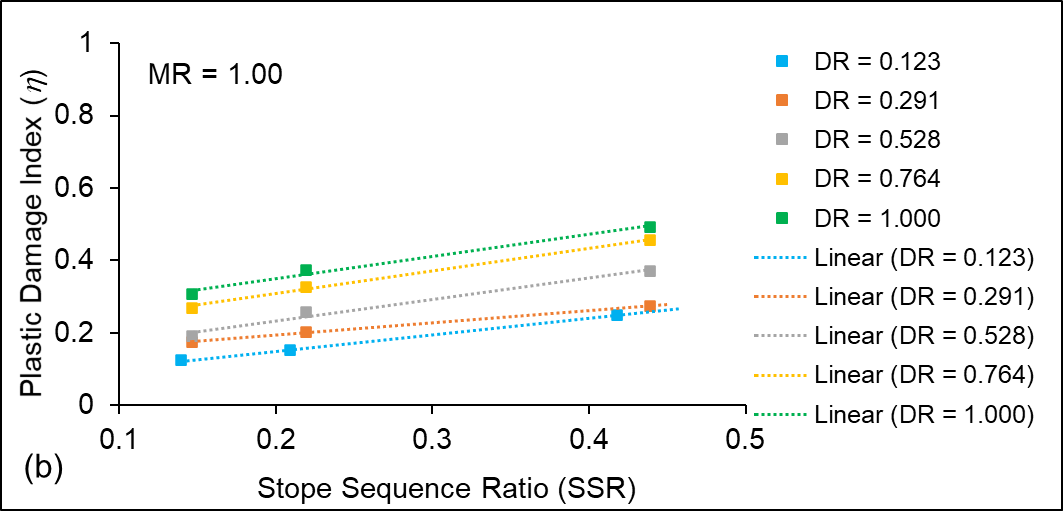
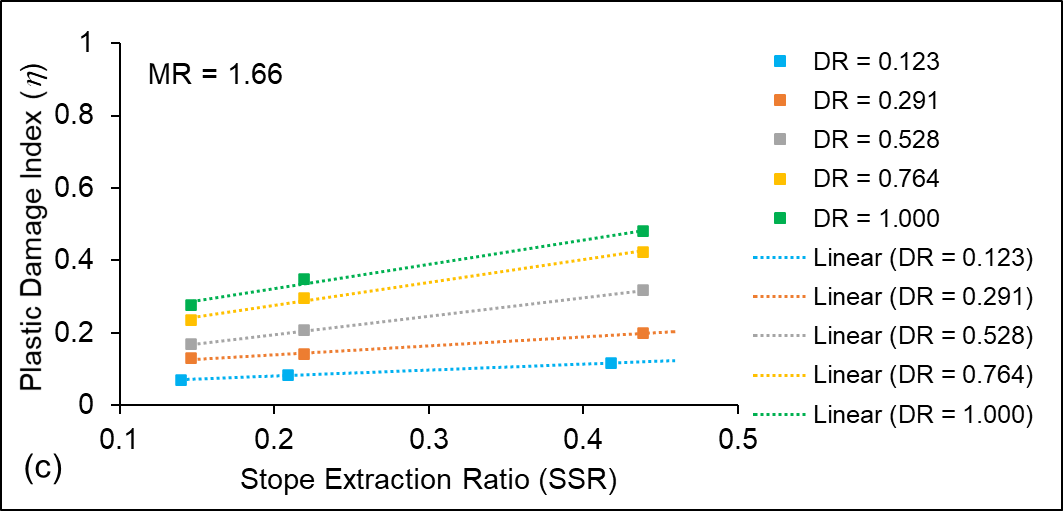
Variation of η with stope sequence ratio ‘SSR’ considering different mining depth ratios are shown in Figures 11 (a–c) for material types M1, M2 and M3, respectively. The simulation results indicate that the average η value varies linearly with stope sequence ratio ‘SSR’ for different variations in material ratio ‘MR’, crown pillar ratio ‘CPR’ and mining depth ratio ‘DR’, with values ranging between 0.1 and 0.5. The other variations of stope sequence ratios SSR with MR, CPR and DR also show a similar trend.
3. 4. Effect of depth ratio DR
Mining depth plays a critical role in determining the thickness of crown pillar in any underground hard rock mine. Rock mass is more prone to shear yielding/failure at greater depths as the ratio of horizontal stress ‘σh’ to vertical stress ‘σv’ increases with mining depth.
The ability of the stirrups to yield or not, however, could not be determined because the shear contribution from transverse reinforcement was not available. This prevented a comparison of the experimental and estimated ultimate shear forces, which are the result of the sum of the shear contributions from the concrete, transverse reinforcement, and FRP.
A higher volume of crown pillar is generally left intact as waste to counteract the high stress regimes at greater depths. Contour plots of plastic damage index η for PRP sequence of extraction and material type M1 with CPR value of unity are shown in Figures 12 (a–c) for stope extraction carried out in second, third and fourth level, respectively. As expected, the extent of damage in the crown pillar increases at a deeper level of extraction.
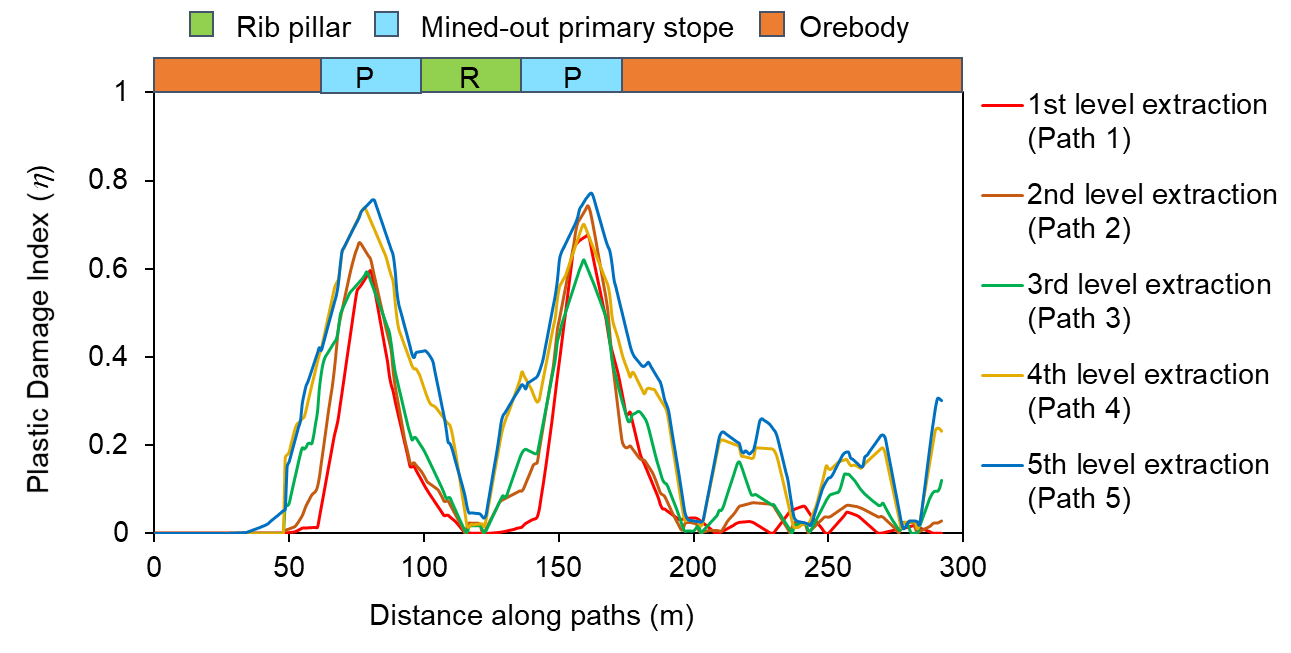
Figure 13 shows the η plot for material M1 and crown pillar C2 along the pre-defined paths 1-5 for each of the five levels of extraction. It is observed that the η value increases with the mining depth from the surface along the crown pillar for the paths 1-5 with PRP stope extraction sequence. The maximum value of η above the mined-out stopes are found to be around 0.57, 0.62 and 0.75 due to stope extraction in second, third and fifth level, respectively. The η value is found to be the maximum at the mid-portion of the extracted stopes; however, the value decreases considerably in areas above the intact rib pillar. Similar trends are observed for other variations in MR, CPR and SSR, with η values increasing with depth of working.
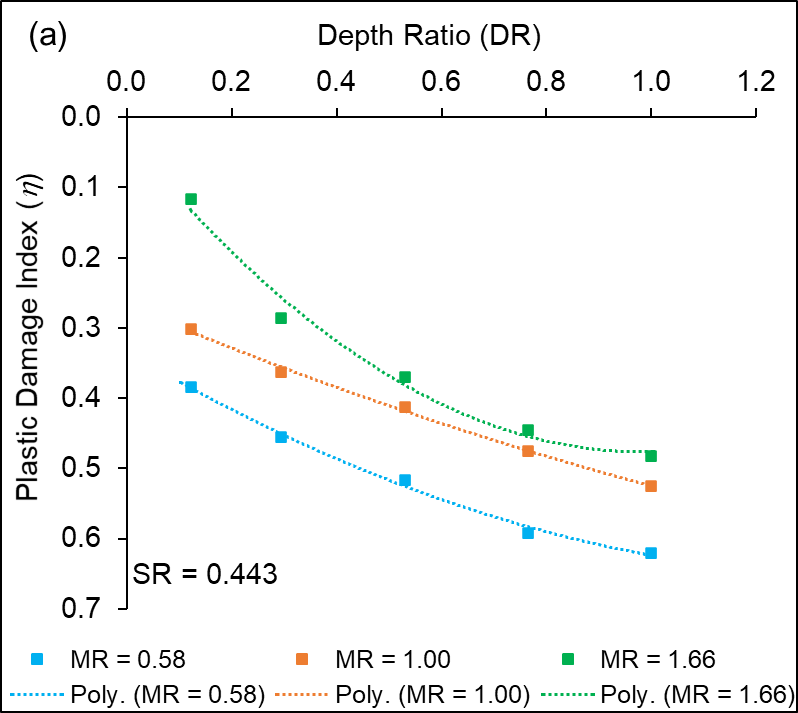
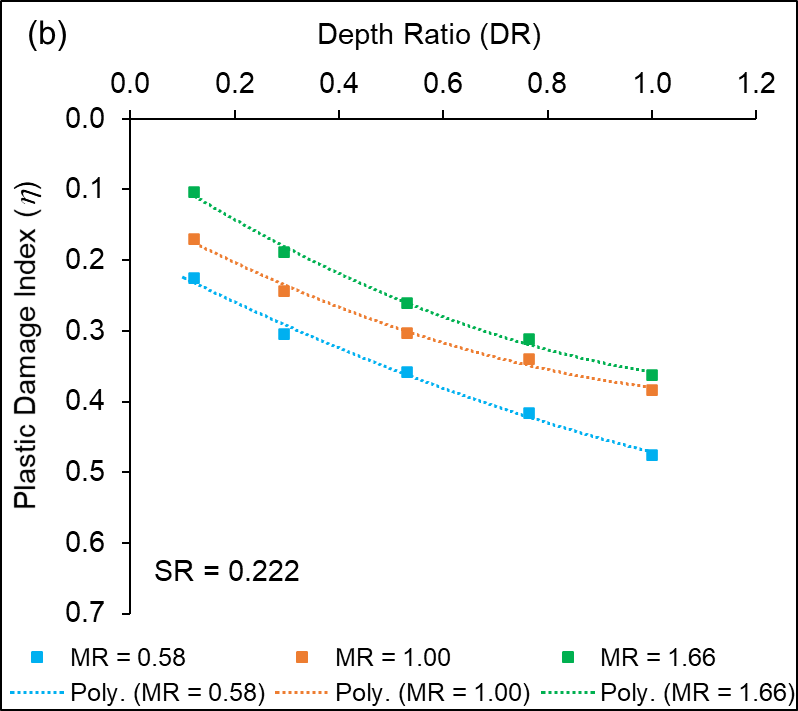
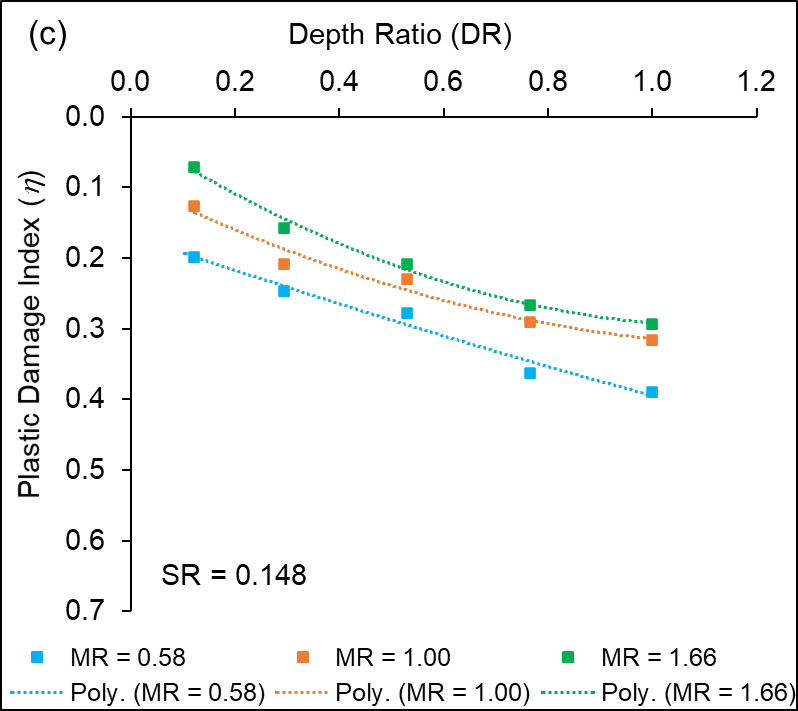
Figures 14 (a – c) show the relationship of plastic damage index ηas a function of DR (CPR = 1.25) for stope sequence ratio P-R-P, P-R-S-R-P and P-R-S-R-S-R-P sequence of extraction, respectively. The results indicate that the average value of plastic damage index (η) increases with an increase in DR for different variations of SSR. A quadratic relationship is found to exist between η and DR, based on the results of the numerical simulations. Similar results are obtained for other variations of MR, CPR and SSR.
4. Multi-variate regression model for crown pillar stability
Based on the simulation results obtained, a multi-variate regression (MVR) model is developed considering all the numerical simulation data generated from finite element models. Considering the stoping and backfilling operations carried out in underground metalliferrous mine, it is quite evident that the parameters stope sequence ratio ‘SSR’, material ratio ‘MR’ and mining depth ratio ‘DR’ have a significant impact on the crown pillar stability. The parameter crown pillar ratio ‘CPR’ also has influence on dependent variable η but it shows minimum effect as compared with other independent variables. The regression analysis results suggest that there exist linear variations of η with MR, CPR and SSR; whereas, a quadratic relationship occur for the parameter DR. The regression model of η for crown pillar stability is given as:

Figure 15 shows the variability of the predicted η obtained from regression analysis and the observed η from FEM analysis. The R2 for the regression analysis of the crown pillar stability between observed and predicted η is found to be 0.94 with F-statistic value of 434.3. The model is found to be significant considering 95% confidence interval. The maximum deviation of magnitude of the observed η value is found to be around 0.15 higher than the obtained regression model.
Table 4. t-statistic values of the MVR model.
|
Dependent variables |
t-statistic value (MVR) |
|
SSR |
28.13 |
|
DR |
9.74 |
|
MR |
-17.90 |
|
CPR |
-9.83 |
|
DR2 |
-3.28 |
Table 4 shows the significance of each of the input variables, i.e., SSR, MR, CPR and DR, based on the t-statistic values obtained from the multi-variate regression analysis. From the table, it is quite evident that the parameters DR and SSR have a strong positive impact on plastic damage index ‘η’ followed by the negative impact of material ratio ‘MR’ and crown pillar ratio ‘CPR’.
5. k-cross validation technique for crown pillar stability
The present study focuses on the ANN analysis for the determination of any non-linear relationship between the predicted and the predictor variables. For this, k-fold cross validation technique has been implemented as it holds good when number of observations ≥ 100 with a reasonable low bias and low variability [8]. In this study, the 135 data sets obtained from the numerical simulation are divided into 9 folds so as to obtain an equal number of data sets in each fold, i.e., 15 data sets. The number of neurons in the hidden layer is calculated with variation starting from 1 up to (2I + 1), where I is the number of input variables [9]. The upper limit of hidden layer neurons is (2I + 1). Hyperbolic tangent function is used as the activation function for the neurons in the hidden layer and output layer. A total of 18 different cases (9 each for η and DC) are analyzed for the crown pillar stability, with one hidden layer in the ANN model.
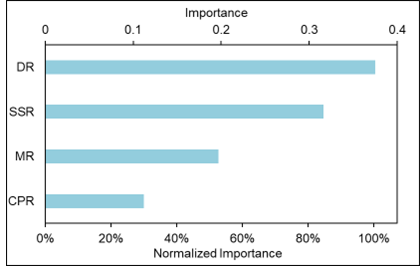
The performance of the neural network is evaluated for each ANN model during the training and testing processes until there was no significant improvement. The relative error of the testing set is used to determine the overall performance of each ANN model. The model with 8 neurons (hidden layer) is found to have the least relative error (0.04567) and moderate variability; thus, considered to be the best amongst the 9 models. Figure 16 shows the importance and normalized importance of independent variables obtained from the ANN model for crown pillar stability; where, normalized importance is defined as the ratio of importance value to the highest importance value, expressed in percentage. It is inferred from the table that depth ratio ‘DR’ (100 %) and stope sequence ratio ‘SSR’ (84 %) have the greatest effect on the dependent variable η and damage class DC for the crown pillar stability, followed by parameters material ratio MR (52.5 %) and crown pillar ratio CPR (29.9 %), respectively. For the categorical dependent variable, i.e., damage class DC, the best artificial neural network model is found with 7 neurons in the hidden layer as shown in Figure 17. A classification (confusion) matrix is also evaluated for the categorical dependent variable, i.e., damage class DC. The percentage of correct predictions for the damage class ‘DC’ is found to be 93.3% as shown in Table 5.
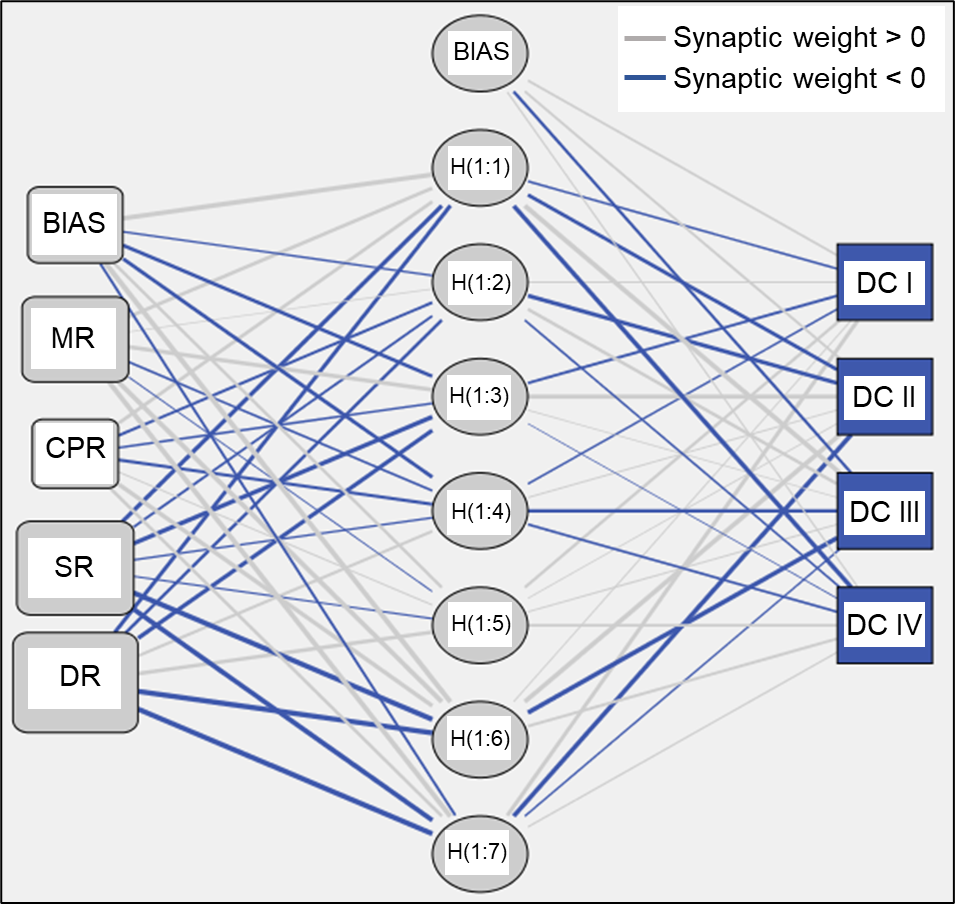
Table 5. Classification matrix for categorical dependent variable DC of the ANN model.
|
Observed |
Predicted |
Percent Correct |
|||
|
DC I |
DC II |
DC III |
DC IV |
||
|
DC I |
23 |
2 |
0 |
0 |
92.0% |
|
DC II |
2 |
72 |
1 |
0 |
96.0% |
|
DC III |
0 |
4 |
27 |
0 |
87.1% |
|
DC IV |
0 |
0 |
0 |
4 |
100.0% |
|
Overall Percent |
18.52 |
57.78 |
20.74 |
2.96 |
93.3% |
6. Conclusions
Maintaining the stability of crown pillars at different levels in an underground metal mine is one of the most critical issues faced by mining engineers when dealt with large scale production scenario. Three-dimensional FE analyses has been performed in this study to simulate the stability of crown pillar with transverse method of stope extraction in an underground mine. The numerical simulation results obtained are analyzed in terms of plastic damage index η. Parametric sensitivity studies have also been carried out to develop a multi-variate regression (MVR) and k-cross validation models for prediction of η, based on the variations in material properties, thickness of crown pillar, stope extraction sequence and mining depth. This study has led to the inference that stoping sequence has the strongest influence on plastic damage index, followed by mining depth, material properties and thickness of crown pillar. Thus, this methodology can be adopted can be applied to other applications of underground mine stability considering different variations of mentioned parameters and also including variations of other parameters including blasting effect, width of rib pillar and stope height.
Acknowledgement
The authors express their gratitude to Hindustan Copper Limited (HCL) for granting this project.
References
[1] M. Ahmad, N. A. Al-Shayea, X. W. Tang, A. Jamal, H. M. Al-Ahmadi, and F. Ahmad, "Predicting the pillar stability of underground mines with random trees and C 4.5 decision trees," Applied Sciences, vol. 10.18, 6486, 2020.
View Article
[2] D. F. Coates, "Rock mechanics principles," in Geoscience Abstracts, American Society Photogrammetry: Bethesda, MD, USA, 1966.
[3] B. Brady and E. Brown, "Pillar supported mining methods," in Rock Mechanics for underground mining. Springer, Dordrecht, 2007.
[4] T.G. Carter, A new approach to surface crown pillar design, in Proceedings of the 16th Canadian Rock Mechanics Symposium, Sudbury, pp. 75-83, 1992.
[5] ANSYS Workbench User's Manual, Version 17.0, Pennsylvania. United States.
[6] S. Mohanto and D. Deb, "Prediction of Plastic Damage Index for Assessing Rib Pillar Stability in Underground Metal Mine Using Multi-variate Regression and Artificial Neural Network Techniques," Geotechnical and Geological Engineering, pp. 767-790, 2020.
View Article
[7] RocData User's Manual, Version 4.0, RocScience, Saint Patrick, St. Toronto.
View Article
[8] Y. Reich and S. V. Barai, "Evaluating machine learning models for engineering problems," Artificial Intelligence in Engineering, Vol 13: 257-272, 1999.
View Article
[9] M. Caudill, "Neural networks primer, Part III," AI Expert, vol. 3(6), pp. 53-59. 1988.
[1] M. Ahmad, N. A. Al-Shayea, X. W. Tang, A. Jamal, H. M. Al-Ahmadi, and F. Ahmad, "Predicting the pillar stability of underground mines with random trees and C 4.5 decision trees," Applied Sciences, vol. 10.18, 6486, 2020. View Article
[2] D. F. Coates, "Rock mechanics principles," in Geoscience Abstracts, American Society Photogrammetry: Bethesda, MD, USA, 1966.
[3] B. Brady and E. Brown, "Pillar supported mining methods," in Rock Mechanics for underground mining. Springer, Dordrecht, 2007.
[4] T.G. Carter, A new approach to surface crown pillar design, in Proceedings of the 16th Canadian Rock Mechanics Symposium, Sudbury, pp. 75-83, 1992.
[5] ANSYS Workbench User's Manual, Version 17.0, Pennsylvania. United States.
[6] S. Mohanto and D. Deb, "Prediction of Plastic Damage Index for Assessing Rib Pillar Stability in Underground Metal Mine Using Multi-variate Regression and Artificial Neural Network Techniques," Geotechnical and Geological Engineering, pp. 767-790, 2020. View Article
[7] RocData User's Manual, Version 4.0, RocScience, Saint Patrick, St. Toronto. View Article
[8] Y. Reich and S. V. Barai, "Evaluating machine learning models for engineering problems," Artificial Intelligence in Engineering, Vol 13: 257-272, 1999. View Article
[9] M. Caudill, "Neural networks primer, Part III," AI Expert, vol. 3(6), pp. 53-59. 1988.