International Journal of Civil Infrastructure (IJCI)
ISSN: 2563-8084

Volume 7 - Year 2024- Pages 92-103
DOI: 10.11159/ijci.2024.010
Strategies and Design Challenges for Topology Optimization of Ultra-High-Performance Fiber-Reinforced Concrete Precast Beams
Maiara G. Montaute1, Hugo Luiz Oliveira2, Thomaz E. T. Buttignol3
1,2,3School of Civil Engineering, Architecture and Urban Design, University of Campinas
Saturnino de Brito 224, 13083-889, Campinas, São Paulo, Brazil
1maiara.montaute@gmail.com, 2hluiz@unicamp.br, 3thomazb@unicamp.br
Abstract - Topology Optimization (TO) is a mathematical method that searches for the ideal spatial distribution of materials based on the design domain, objective function, constraints and boundary conditions. There are different methods and softwares at hand, which can give distinct responses. Thus, the choice of the most appropriate algorithm and program is essential to provide a feasible solution. The aim of this work is to compare the results of the TO of simply supported rectangular Ultra-High-Performance Concrete (UHPFRC) beams, subjected to different static loads and spans ranging from 3 to 10m. The analyses include optimizing 3D parametric beams using Grasshopper's Algorithm-Aided Design (AAD), which is integrated with the Topos plugin, based on the SIMP model, and associated with Galapagos, a genetic algorithm plugin. This approach allows the automation search for the minimum volume of the rectangular beams. The second software used for TO processing is TOSCA, which is integrated with Abaqus/CAE, allowing optimization using the MIMP, RAMP and SIMP methodologies. Finally, the beams were processed in the Fusion software, from Autodesk Nastran In-CAD, which adopts the SIMP model. All the algorithms were used to provide the optimized geometry of the beams automatically to achieve the defined objectives of minimizing the volume and deformations. After the definition of the most suitable geometry, a non-linear analysis in Abaqus software is performed to check the maximum load bearing capacity (ULS) and the deflection (SLS). The results demonstrate a change in the failure mode, from flexural to a truss-like. Moreover, the optimized beams were able to maintain the initial load bearing capacity, without losing performance.
Keywords: Topology Optimization, Precast Beams, Uhpfrc, Fusion, Tosca, Simp.
© Copyright 2024 Authors - This is an Open Access article published under the Creative Commons Attribution License terms. Unrestricted use, distribution, and reproduction in any medium are permitted, provided the original work is properly cited.
Date Received: 2023-12-11
Date Revised: 2024-06-07
Date Accepted: 2024-06-25
Date Published: 2024-07-15
1. Introduction
Progress in desk computing technology, the rational use of resources combined with sustainability, competitiveness and the development of new forms, techniques and materials have enabled the use of topology optimization (TO) in structural design to reach improved performance [1].
The applicability of TO is associated with the search for the local minimum and maximum points of a real function using an iterative process. This procedure allows a material layout problem to be solved using an algorithm with design requirements that must be achieved assuring stability of solution and speed of convergence [2]. However, as a structural configuration is not represented by standard parametric functions, but by a set of distributed functions defined in a fixed domain that represent a parameterisation of the continuous stiffness tensor, it is necessary to choose the appropriate mathematical method that will lead to the consistent formulation of the design and the processing of the results.
A well-established example of this class of algorithms is TO of continuous structures which determines the existence or not of material within the design domain according to a cost (or objective) function. This function can be defined in terms of design geometric parameters to predict the external shape associated with the connectivity between the internal components. This layout parameterization can be seen as an approximation of the material microstructure based on the stiffness and density ratio (variable from 0 to 1) [3].
The SIMP (Simple Isotropic Material with Penalisation) methodology has emerged as the main topology optimisation technique for continuous structures and is widely integrated into commercial finite element software such as OptiStruct, Genesis, MSC/Nastran, Ansys and Tosca [4] for the efficient resolution of engineering problems due to its concise and effective approach.
The SIMP method, described by Bendsoe [5], Zhou et al. [6] and Rozvany [7] is based on equation (1), which defines the density value at each point in the domain Ω, where x ∈ Ω, according to the requirements defined in the project, so as to represent the continuous distribution function, being 0≤ρ(x)≤1, 0 represents the absence of the material and 1 the material is full.
Bendsoe [8] shows that intermediate values of ρ(x) is beneficial for convergence, but result in regions with different material properties, and in some cases with geometries that are unfeasible in terms of manufacturing.
In a subsequent step, intermediate values of ρ(x) are penalised by the coefficient p, based on the Hashin-Shtrikman limits (apud [9]), and particularly for p≥3 the requirements for physically obtaining a microstructure based on the Modulus of Elasticity and Poisson's ratio are met. In mathematical terms, assuming C0 is defined as an isotropic tensor that also depends on the Young’s modulus and Poisson's ratio, the microscopic behavior is expressed in Equation 1:

Stolpe and Svanberg [10] proposed the Rational Approximation of Material Properties (RAMP) method with the aim of increasing the occurrence of 0-1 (grayscale-free) solution for continuous problems by proposing a non-zero sensitivity with a null density value, which represents an alternative for numerical conditions with low densities and shape-dependent loads and it is described by Equation 2.

where Ee0 corresponds to the coefficient of elasticity, Emin is a small value constant (10-9) for empty elements to avoid singularities associated with discretisation, q is the penalty factor which can take values between 0 and 1 defined by the lower and upper limits of Hashin-Shtrikman [9] and xe the material density.
Comparing SIMP and RAMP for different values of p and q, it can be seen that RAMP formulation prevents the stiffness from taking on values close to zero when interpolating the constitutive tensor.
Lastly, the MIMP (Modified Improved Moving Particle Swarm Optimisation) method also seeks the ideal distribution of material satisfying the given preconditions, combining particle swarm optimisation (PSO). This technique was developed by Kennedy and Eberhart [11] and is based on the creation of algorithms for a population of candidate solutions and the movement of particles from their initial condition to the next, converging on the direction within the sample space according to the mathematical objective function [12].
These approaches and techniques are included in the finite element software used in this study, which aims to compare the results obtained from concrete beams models subjected to a typical live/dead load. The Tosca plugin, integrated into the Abaqus/CAE finite element software, has processing interfaces with the three models mentioned above. Fusion software and the Topos plugin are set up for topology optimisation using SIMP.
Other common optimisation procedures and techniques are also available in the literature [13], but they are not covered in this study because they are not included in the softwares being analysed.
From the analyses, the most suitable geometry is selected and a quasi-static 3D non-linear analysis is performed in Abaqus CAE software. The results are compared to the rectangular beam aiming to check the Ultimate Limit State (maximum load carrying capacity) and Serciceability Limit State (midspan deflection).
2. Problem Statement
There have been few studies on topology optimisation applied to concrete beams using Ultra High Performance Fiber Reinforced Concrete (UHPFRC), which makes this subject relevant given the need for the subject to evolve in line with the objective of the rational and sustainable use of materials. In addition, determining the shape and comparing the results of the numerical methods is essential to assess the feasible options in a later stage. Therefore, the mathematical methods SIMP integrated with Topos, Tosca and Fusion, and MIMP and RAMP included in Tosca will be considered for this study.
It is known that the constitutive response of concrete is anisotropic and non-linear. However, as a first approximation of the problem, the UHPFRC with a high fibre density can assume, for simplicity, an homogeneous behaviour in representative volumes compatible with the scale of the structure. Furthermore, for small displacement and deformation regimes, the material and geometric linearity, as a first approximation of the problem, is sufficiently representative. Therefore, all the modelling considered here will have an isotropic linear elastic constitutive response. Once the optimised layout has been obtained, the shape must be simplified to ensure that it is feasible for construction (manufacturing constraints). Once the final shape has been defined, a more rigorous analysis, considering the non-linearity of the material, is performed to determine the actual structural behaviour.
2.1. Input data
In this study, the analyses were based on Brazilian design codes ABNT NBR6120:2019 [14] and ABNT NBR6118:2023 [15]. The load calculation for the simply supported beams usually used in buildings was based on the contribution of a slab with a minimum thickness of 8cm (Item 13.2.4 [15]). The distributed load includes the action of a permanent load due to its own weight adding 1 kN/m² due to the flooring and a live load of 5kN/m².
The loads applied to the beams were calculated from the sum of the permanent and variable loads. Initially, the slab loads were considered as the sum of the self-weight, coating, and live load. To determine the influence area of the slab, it was assumed that the slabs would be supported on the beams and would, therefore, form 45º hinges at their connections, forming a triangular shape where the base is the length of the beam under analysis. Additionally, the self-weight of the beams was considered in each analysis, resulting in distinct loads for each beam length.
All the beams have a fixed width (bw) of 20cm and a height of 10% of the effective span. The maximum displacement for the beams was determined considering the sensory acceptability for structural elements determined in Table 13.3 [15].
The adoption of using statically determined beams is due to the option of analysing precast elements, a system that is more susceptible to be built according to unconventional shapes. Linear material behaviour is considered, as permitted in item 14.5.2 [15], with the secant Young Modulus (Ecs) of 50GPa and Poisson's ratio of 0.20.
In the analyses with Topos plugin, a distributed load was applied on the top surface. A concentrated load at the top midspan was applied in the analyses with Tosca (Abaqus) and Fusion (Autodesk).
The cross-section was not allowed to have a reduction in volume within the 20% of the top compression layer. The compression height was determined as a function of the position of the neutral axis.
Table 1 shows the static loading and geometric settings of the beams with different spans and heights.
Table1: Static loading and geometric settings.
|
Configuration |
Span (m) |
Section area (m²) |
Initial volume (m³) |
|
|
1 |
3 |
0,06 |
0,18 |
|
|
2 |
4 |
0,08 |
0,32 |
|
|
3 |
5 |
0,1 |
0,50 |
|
|
4 |
10 |
0,2 |
2 |
|
|
Configuration |
Loading (kN) |
Limit deflection (mm) |
Compression area (m²) |
|
|
1 |
23,0 |
12 |
0,012 |
|
|
2 |
35,7 |
16 |
0,016 |
|
|
3 |
54,0 |
20 |
0,020 |
|
|
4 |
298,5 |
40 |
0,040 |
|
2.2. Optimization procedures using Topos and Galapagos
Topos plugin allows the optimisation of 3D geometry based on the SIMP approach. It includes solid material according to the integrity of the point stiffness by assigning 0 to the regions not considered in the cost function for mechanical compliance and 1 to the collaborating regions of stiffness based on the block programming carried out by the user. The workflow is shown in Figure 1 having a flowchart at the left and some screenshots from the interface at the right, in which it is possible to verify the process of inserting information such as geometry, loading, material specifications, and optimization criteria for parameterization and the use of the Topos and Galapagos Plugins to converge to the expected result initially described in the function, corresponding to a loop process until the optimal solution is described in the computational interface.
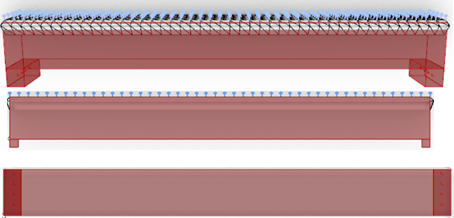
The implementation began with the creation of blocks corresponding to geometry configuration, material characterisation and specification; stresses; load regions and displacement boundary conditions. The 3D parametric model is shown in Figure 2, in which it is possible to see the isometric, side and top views of the element created, as well as the loads acting on the top face of the beam.
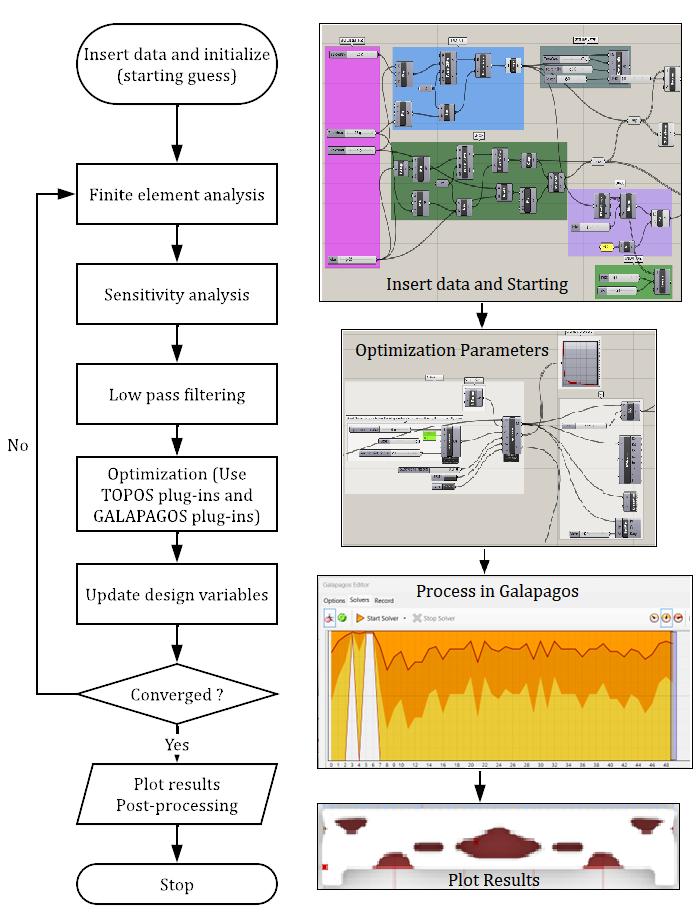
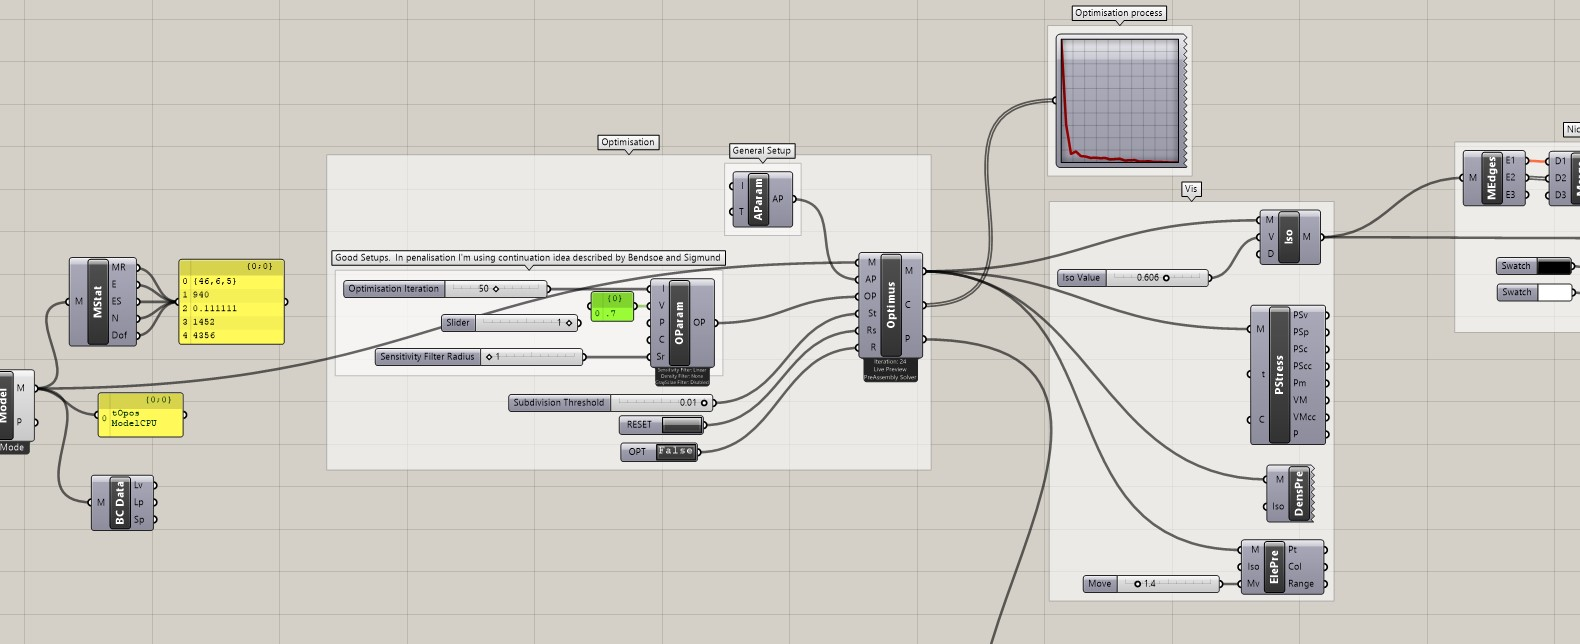
Using optimisation blocks, as shown in Figure 3, the cost function is defined (determining the minimum volume), as well as the restrictions, the number of iterations and how the model will transmit the internal forces. In the simulation shown in Figure 3, it is defined that the number of iterations is 50 and that the optimization should reduce 70% of the beam volume with a Sensitivity Filter Radius of 1 (inputs that will be processed in the other analysis). The Optimus block allows the processing of the information partially demonstrated by the Optimisation process graph located at the top right, moving to the genetic evolution stage presented in Figure 4.
The use of Topos makes it possible to return the optimum geometry based on the pre-fixed conditions and the percentage of the volume set by the user for processing, as shown in the Plot Results in Figure 1, where the white color represents the volume to be maintained, while the red region indicates the material to be removed.
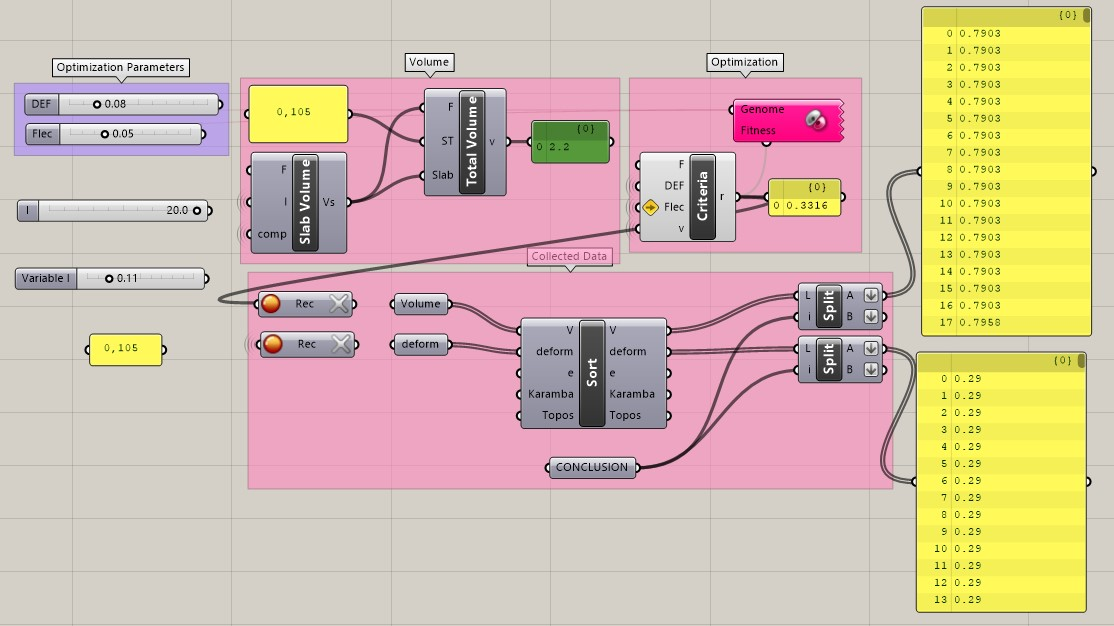
The Galapagos plugin is an evolutionary genetic algorithm native to Grasshopper, capable of involving multiple variables, and is programmed by the user. The plugin generates an initial population of solutions to the optimisation problem and validate the optimal solution through an iterative process based on its objective function (declared in the fitness tool). In this study, the use of Galapagos aims to achieve the minimum volume of concrete after topology optimisation, restraint to achieve the maximum vertical displacement allowed and recommended in [15].
Both Topos and Galapagos are based on visual programming using predefined blocks of commands available for insertion into the user's programmable routines (canvas), as shown in Figure 4, in which the deflection criteria (calculated and limit) and volume are defined for determining the optimal section according to the defined cost function and the performed programming and the numerical results partially presented in the yellow notes. The results of the parametric design geometry are visualised in Rhinoceros 3D software.
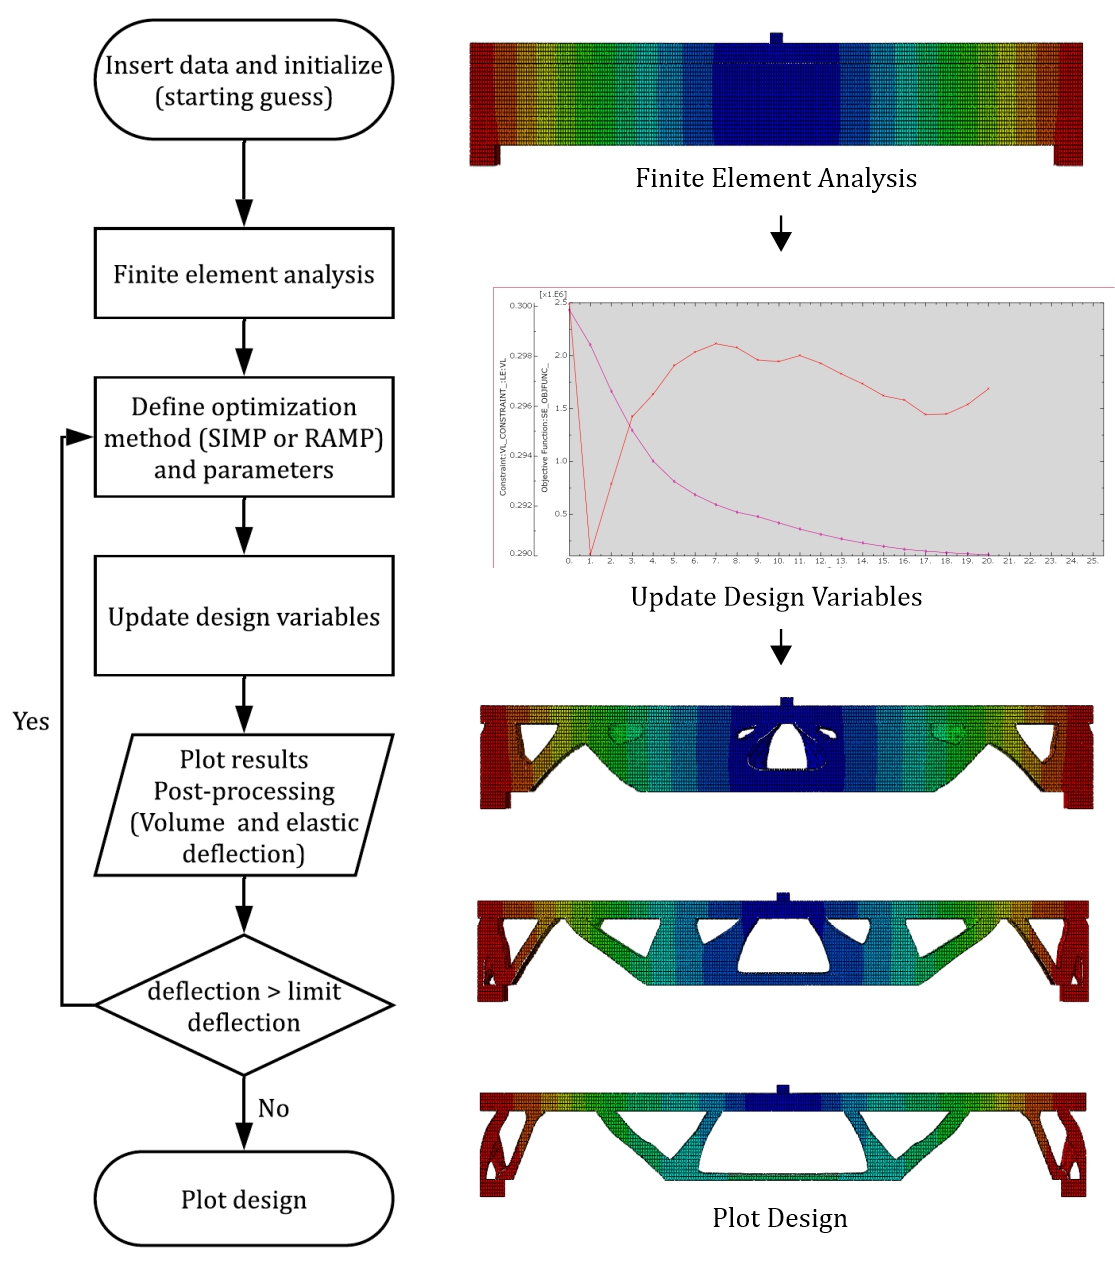
2.3. Optimization procedures using Tosca/Abaqus
Topology optimisation using Tosca, which integrates the Abaqus/CAE software, starts with the modelling of the element described in section 2.1, followed by the specification of materials, loads, boundary conditions, iteration criteria and mesh definition. A flowchart for the TO adopted in Tosca is shown in Figure 5, after defining the material properties and geometry, the optimization analysis method will be determined, which will occur according to the model sensitivity definitions and the material reduction percentage. On the right side of Figure 5, it is possible to see the initial modelled design, the curve with the iterations to solve the objective function, and the partial geometries of the processed model.
In the optimization module, it is possible to define the desired cost function (minimise volume, maximise stiffness), the areas that should be maintained and that one to be optimised, the number of iterations to process, the penalty criterion, and the numerical analysis model, which can be: SIMP, MIMP or RAMP.
The finite element software takes this configuration automatically and calculate the material stresses, deformations and other data of possible interest based on the user’s definitions, displaying a numerical and colour scale according to the optimised region.
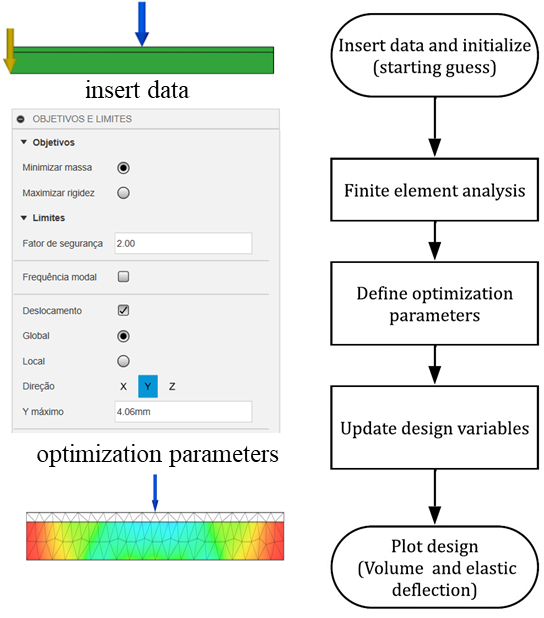
2.4. Optimization procedures using Fusion
Topology optimisation using the Fusion software developed by Autodesk is intuitive for the user and can be processed quickly. The workflow shown in Figure 6 is a simplified version of the process described in section 2.3 and is performed as shown in Figure 6, where it is possible to see the necessary steps and basic prerequisites for processing the TO, based on the definition of the geometry of the analysed beam, the material, the optimization conditions, and the objective function, it is possible to process and plot the result through the programming established in the software and the demonstration in the graphical interface, According to the bottom left image, where the yellow and red colors indicate higher stress concentrations and therefore material conservation areas, while the blue color indicates the area of lower concentration and, consequently, volume removal.
Initially, the element described in section 2.1 was modelled, followed by the specification of materials, loads and boundary conditions. The mesh is defined automatically and can be edited by the user as required. The software has several materials previously registered in its library, which allows them to be quickly applied to the element. It is also possible to edit the components if necessary.
Fusion allows more than one optimisation parameter to be included in the analysis, which, in this case, are the displacements applied in the Y direction and the volume (the same criteria defined in the other models).
In the Simulations tab, it is possible to process the model, which, as Abaqus, displays a numerical and colour scale for visualisation. The software also allows users to generate a data report with the information entered and the results obtained after processing.
3. Results of the Topology Optimization
The non-conventional geometries generated by the softwares after the TO are compared, considering different volume reduction targets. The analyses in Tosca software for the geometries generated and the deflections obtained are shown in Figures 7-11. Tosca offers the possibility of processing the structural elements using the standard settings SIMP, MIMP and RAMP.
The optimization results applying SIMP, MIMP and RAMP are shown in Figure 7 (front side), considering the reduction of 70%, 60% and 40% of the initial volume and 3m span.
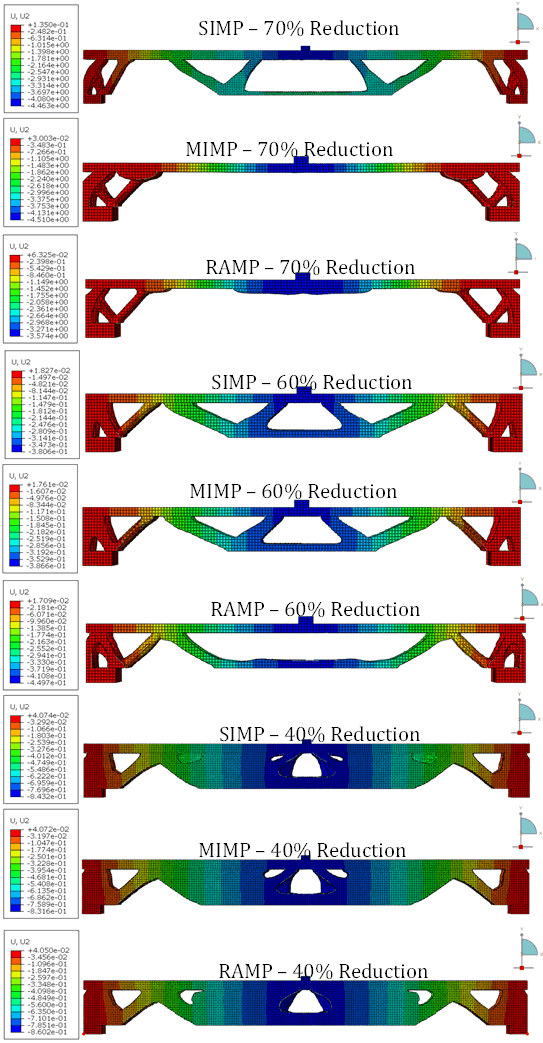
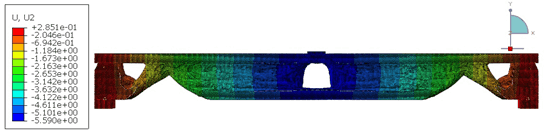
All figures simulated by Tosca in this section present the results in a color scale, where blue colors represent the maximum deflections, located at the center of the structure. The colors vary from darker shades, indicating the highest values, to lighter shades, representing the lowest values, followed by green, yellow, orange, and red, respectively, in a scale from the greatest to the smallest deflection.
Volume reduction percentages greater than 70% led to an error, indicating the failure of the section and, thus, not generating valid information for this work.
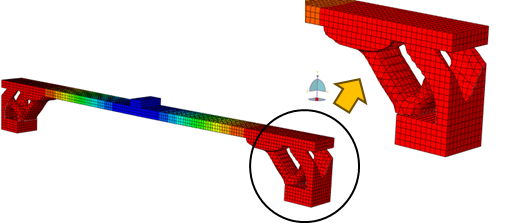
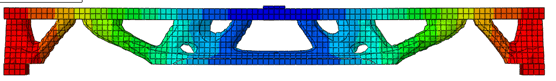
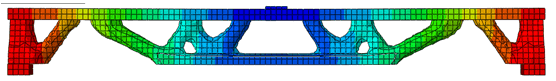
Depending on the selected algorithm, different geometries were generated in Tosca for the analyses considering a volume reduction of 70%. For SIMP, diagonals and intermediate lower flanges are formed, as well as diagonals close to the supports. This is not the case for the simulation in the MIMP and RAMP algorithms. In this case, one can observe that the loads are oriented exclusively through the diagonals close to the supports.
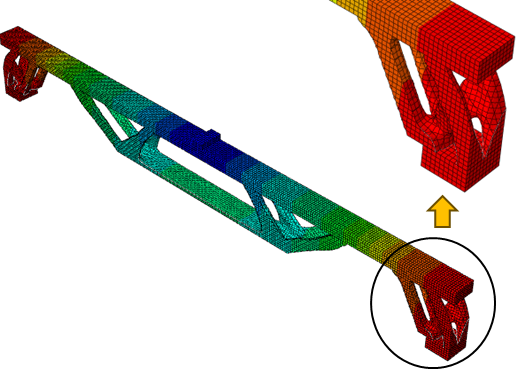
The perspectives shown in Figure 8 show that the diagonals and flanges formed in the SIMP condition with a 70% reduction have a small thickness, while there is greater robustness in the regions close to the supports in the MIMP condition with a 70% reduction shown in Figure 9.
Regarding the deflections, the MIMP method, assuming 70% volume reduction, had the highest displacement value, with 4.5 mm, located near the middle of the top span. SIMP had a value of 4.46 mm, while RAMP generated a deflection of 3.57 mm, both also located in the central region of the beam.
Considering the maximum allowable deflection, the beams are within the requirements established by the current standard code [15].
Contrary to the RAMP model, there is a similarity between the SIMP and MIMP models with a 60% volume reduction. It is also possible to identify a geometry trend for the SIMP models with 70% and 60% volume reduction.
For a 40% volume reduction, the three methods have shown similar strategies and outcomes. The analyses initially removed material from the central region, followed by the areas close to the supports.
It is worth noting that reducing the volume efficiently increases the stiffness of the structural element. The results demonstrate that the deflections for the 60% and 40% volume reduction are within the allowable limits accepted by the Brazilian Standard Code [15], table 13.3, considering the sensorial acceptability in (span / 250).
The Figure 10 shows the SIMP result for a beam with 10m span considering 40% volume reduction. A similar geometric pattern is observed for the beam with a 3m span (see Figure 7).
The Figure 11 shows the SIMP and MIMP results for a beam with 60% volume reduction and 10 m span. In this case, different geometries were generated compared to the beam with 3m span (see Figure 7). The RAMP method did not show compatible results and processing was aborted due to fragile failure. There were no results in all the three methods considering a volume reduction of 70% and a beam span of 10m.
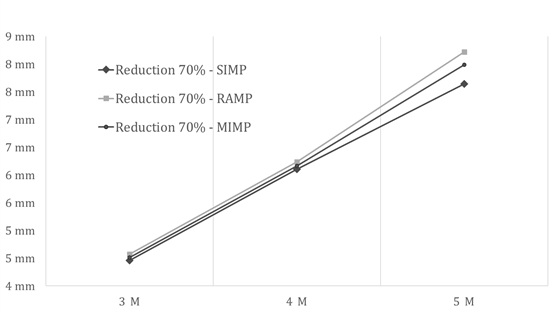
The Figure 12 shows the deflections of the beams according to SIMP, MIMP and RAMP methods, considering a 70% reduction in the initial volume and spans of 3m, 4m, 5m. It is possible to identify that the minimum deflections are obtained with the SIMP method, followed by MIMP and RAMP. An average variation of 5.34% and 3.09% was found, respectively, in relation to SIMP and RAMP. In this case, a linear variation in the deflection can be observed.
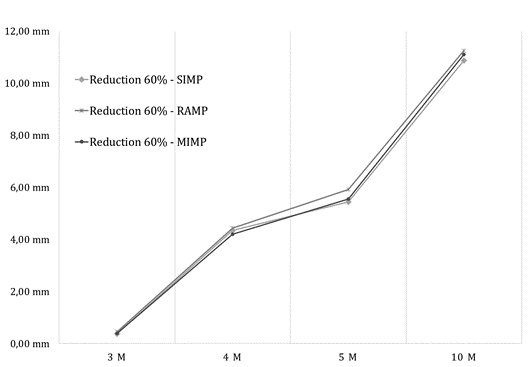
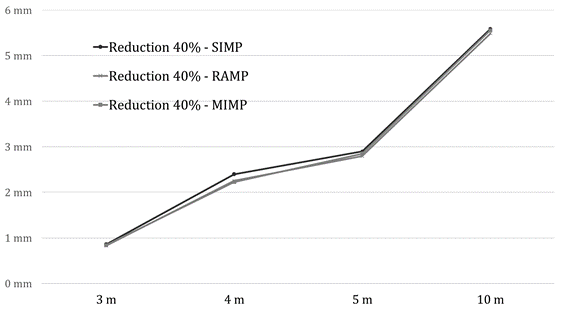
The analysis of Figure 12 allows us to verify that for a reduction of 70% of the initial volume, as shown in Figure 13, it can be seen that SIMP results led to greater deflections when compared to MIMP and RAMP, with an average variation of 3.98%. In turn, the MIMP results have lower deflections for spans up to 4m. For spans of more than 4m, the RAMP has the lowest deflection values. A similar behavior can be noticed for a 40% volume reduction, as shown in Figure 14. In these cases, there was a non-linear variation in the deflection.
In Tosca, the maximum percentage of volume reduction in rectangular beams was 70% according to the loads described in Table 1. This value is only representative for lengths ranging from 3 to 5m. For beams with spans between 5m and 10m, the maximum reduction volume was approximately 60%.
Considering the same geometry and loading in the Fusion software and fixing the maximum allowable deflection for a span of 3m, the analyses show that the optimum volume established was 52.71%. This software uses the genetic algorithm to find the optimal volume with acceptable deflection.
As shown in Figure 15, the software eliminates regions with lower stress concentrations. The top surface remained unchanged, as occurred in the analyses with Tosca.
For beams with 4m span, the optimum volume found was 50.85%, while, for 5m and 10m span, the optimum volumes were, respectively, 49.3% and 40.18%. The values are more conservative compared to the Topos results.
Finally, the use of the plugin Topos, available for Grasshopper, allows an analysis similar to that of Fusion. In this case, Galapagos (genetic algorithm) will search for the target function (minimum volume), adopting the SIMP method. The advantage of using Grasshopper is that you get a parametric object with rapid changing of the geometric properties and faster processing compared to Tosca.
The Figure 16 shows the geometry of the OT beam using Topos for a 5m span in which the initial volume was reduced by 65.7%. The regions in red indicate the absence of volume, while the white indicates the presence of material.
A reduction volume of 68.7% was obtained for a beam with a 3m span. For a 4m span, the reduction volume was 66.8%. Following the behavior of the previous processes, the reduction volume for the 10m span was 58.3%.
4. 3D non-linear finite element analysis of UHPFRC beam after topology optimization
A 3D non-linear finite element numerical analysis was performed in the commercial software Abaqus CAE. A 4-noded 3D stress (C3D8R: eight node linear brick, reduced integration, hourglass control) FE mesh was adopted considering a global size of approximately 40mm. Concrete constitutive laws are introduced in the Abaqus Concrete Damaged Plasticity (CDP) formulation. A detailed description of the model can be found in Buttignol et al [17]. For the Abaqus CDP parameters, it was adopted a dilation angle of 32º, eccentricity of 1, biaxial to uniaxial compressive stress equal to 1.12, K = 0.67 and viscosity parameter of 0.001.
A smeared crack approach was defined, assuming, for simplicity, the UHPFRC as a homogeneous material. The analysis considered a compressive strength of 140 MPa, maximum tensile strength of 18 MPa and Elastic Modulus of 40 GPa. Concrete stress-strain relation in compression was defined in terms of stress (σ) vs. plastic strain (εp), according to the plastic-damage model proposed by Lubliner et al. [18]. The analytical function is shown in Equation 3, where: a (Equation 4) and b are dimensionless constants; εp is the plastic strain; g is the plastic potential energy (Equation 5); fm is the peak stress; lc is the characteristic length of failure localization; G is a quantity in the form of energy/area that is related to the material properties. The damage values in compression (dc) are determined through the Equation 6.


Concrete constitutive law in tension is defined in terms of stress-crack opening displacement (COD) instead of stress-strain to avoid problems of mesh sensitivity and spurious energy dissipation. The COD is calculated taking into account the cohesive-fracture concept from Hillerborg et al. (1976) generalized through the characteristic length (w = lcs.ε) (Hordijk 1991, Bazant and Cedolin 2010). The constitutive models in compression and tension are shown in Figure 17. In this case, wmax = 4 mm anf ft0 = 18 MPa. These values were defined based on previous experimental DEWS (Double Edge Wedge Splitting) tests [19] carried out in the Laboratory of Structures and Materials at the University of Campinas.
Non-linear analyses were performed on the optimized beams in Tosca. The objective is to compare the maximum force applied to the beams prior and after the TO.
Before the numerical analysis, the optimized geometry was simplified by adopting constant a width and thickness to the diagonals and flanges. The edges were smoothened. The regions near the supports were maintained due to the maximum shear force acting in these areas These measures are justified to simplify the manufacturing of the non-conventional structural elements.
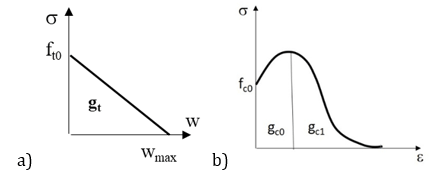
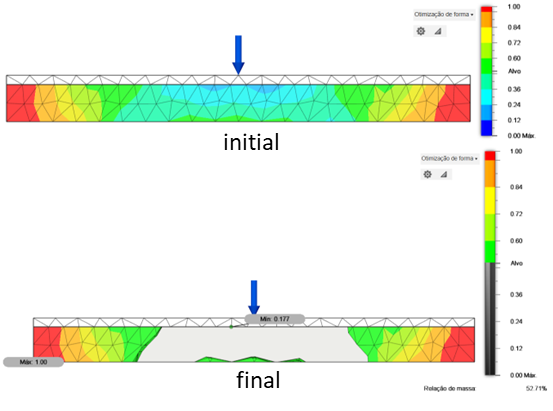
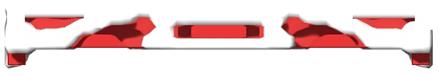
Figure 18 (Initial) shows the 3m beam with reduced volume after optimization using SIMP for a 70% volume reduction. This geometry was used as the basis for the Final Simplified version, considering the maintenance of component thickness and the rounding of vertices to account for stress concentrations at these points for the non-linear analysis. The same process was repeated for the other beams.
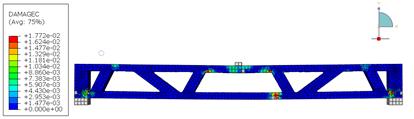
The results of the analyses at the maximum load, in terms of damage in compression and tension, are shown in Figures 19 and 20 for beams with spans, respectively, of 4m and 5m.
Figures 19a and 20a shows that the critical compression regions are located around the applied load (top flange) and at the connections between the diagonals and the flanges. The same pattern is observed in the tension damage (Figures 19b and 20b). This behavior is repeated for spans of 4m and 5m.
 (a)
(a)
 (b)
(b)
 (a)
(a)
 (b)
(b)
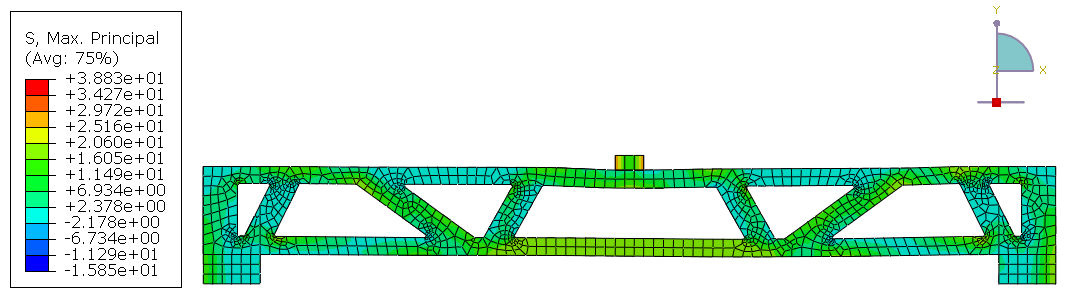
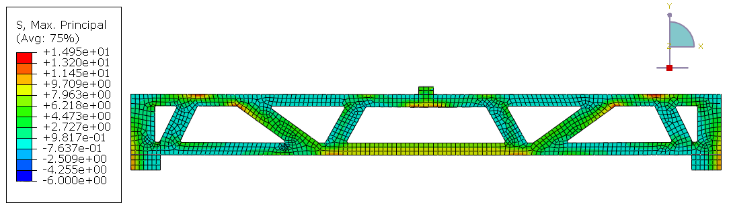
Figure 21 shows the maximum principal stresses in the beams with spans of the 3m and 5m. The analyses show that high tensile stresses are developed at the middle of the top and bottom flanges. The colors between yellow and green indicate tension (ranging from 2.4 to 21 MPa), while blue indicates compression (ranging from 2.2 to 16 MPa).
 (a)
(a)
 (b)
(b)
The maximum acting forces for the three cases investigated are shown in Table 2. Figure 22 shows the numerical non-linear results in terms of force (kN) vs. displacement (mm). In all cases, a ductile behavior can be observed. It is interesting noting that a change in the failure mode occurs when comparing the initial rectangular section with the optimized beam. In the former case, a flexural failure is expected with formation of several vertical cracks near the midspan. In the latter case, plastic hinges are developed at the connections between the flanges and the diagonals, guaranteeing a ductile behavior and a truss-like collapse.
Table 2: Maximum Static loading (in kN), deflection in Abaqus and final volume, according to the span.
|
Configuration |
Deflection SIMP Initial (mm) |
Maximum Loading (kN) |
Final Volume (m³) |
|
1 |
4,46 |
122 |
0,107 |
|
2 |
6,10 |
160 |
0,189 |
|
3 |
7,65 |
190 |
0,296 |
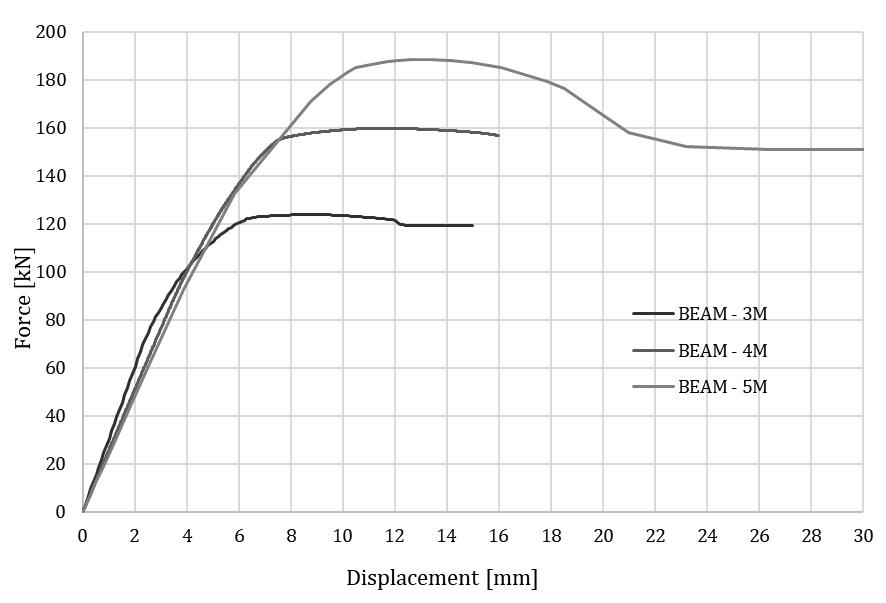
A comparison of the maximum loading between the rectangular and the optimized members demonstrated that the beam with a non-conventional shape was able to preserve the load bearing capacity. The maximum load of the rectangular members was calculated by means of a sectional analysis, as shown in Figure 23.
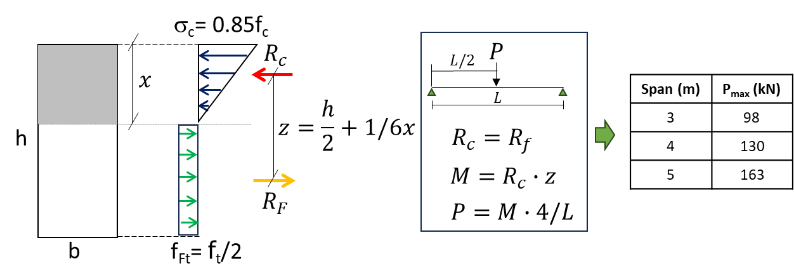
In Figure 23 the variable x represents the total height h of the cross-section, b is the width of the beam, x is the compressed height, Rc is the compressive resultant, Rf is the tensile resultant, z is the distance between Rc and Rf, L is the total length of the beam, M is the moment, and P is the critical force applied and resulting from the demands.
The optimized elements showed an increase in the load capacity with respect to the rectangular ones of 1.25, 1.23 and 1.16 for spans, respectively, of 3m, 4m and 5m.
5. Conclusion
The aim of OT for precast UHPFRC beams is to obtain a structural element that satisfies the minimum design requirements and also promotes the rational and sustainable use of materials. There are different mathematical methods for TO available, for example, SIMP, MIMP and RAMP. They are associated with various different softwares. This paper analyzed three different types of programs (Topos, Tosca and Fusion). The objective is to investigate the best solution for UHPFRC simply supported beams.
The analyses considered simply supported rectangular UHPFRC beams subjected to different static loads and spans between 3 and 10m. A comparison of the maximum deformation between the three methods (SIMP, MIMP and RAMP) using Tosca have shown a small difference between them, as well as a non-uniform behavior of the deflection.
It was observed that the 3D parametric models from Grasshopper's Algorithm-Aided Design (AAD), integrated with the Topos plugin, based on the SIMP model, and integrated with Galapagos (genetic algorithm) produced similar results compared to Tosca. The analyses resulted in similar geometries with a variation of 1.86% for a length of 3m, 4.57% for a length of 4m, 6.14% for a length of 5m and 2.83% for a length of 10m. In contrast, the analyses using Fusion resulted in more conservative reduction percentages compared to Topos and Tosca. The optimization time using Fusion was much shorter and more intuitive than the other softwares. Compared to Tosca, the results showed a variation of 24.7% for the length of 3m, 27.35% for the length of 4m, 29.57% for the length of 5m and 33% for the length of 10m. For the length of 4m, 6.14% for the length of 5m and 2.83% for the length of 10m.
The numerical non-linear analyses of the optimized beams demonstrated a change in the failure mode, from the flexural type for rectangular sections to a truss-like collapse for the optimized members with the formation of plastic hinges at the connections between the flanges and the diagonals. The optimized elements showed an increase in the load capacity with respect to the rectangular ones of 1.25, 1.23 and 1.16 for spans, respectively, of 3m, 4m and 5m. In these cases, there was a volume reduction of 40.55% compared to the initial rectangular section. For the 10m span, the volume reduction was 28.3%. The results demonstrate the feasibility of the described methodology to obtain non-conventional beam shapes satisfying the requirements of structural safety, dematerialization and sustainability.
6. Acknowledgements
The authors would like to gratefully acknowledge the financial support of this research by National Council for Scientific and Technological Development (CNPq), grant number 403517/2023-0 and “Fundo de Apoio ao Ensino, à Pesquisa e à Extensão” (Faepex), grant number 2474/23.
References
[1] XIE, Y. M; FELICETTI, P; TANG, J. Conceptual design of building structures subjected to wind load by using to topology optimization. Wind and Structures, v.18, p. 21-35, 2014.
View Article
[2] Lopez, R.; Beck, A. Optimization under uncertainties. In: Optimization of Structures and Components. Springer, 2013. Cap. X, pp. 117-138.
View Article
[3] ESCHENAUER, H. A; OLLOFF, N. Topology optimization of continuum structures: A review. Appl. Mech., v. 54, 2001.
View Article
[4] FIEBIG, S; AXMANN, J. K. Using a binary material model for stress constraints and nonlinearities up to crash in topology optimization. 10th World Congress on Structural and Multidisciplinary Optimization, Orlando, 2013
[5] BENDSOE, M. P. KIKUCHI, N., 1988, "Generating Optimal Topologies in Structural Design Using a Homogenization Method". Computer Methods in Applied Mechanics and Engineering, 71, pp. 197-224.
View Article
[6] ZHOU, M., ROZVANY, G.IN, 1991, "The COC Algorithm, Part II: Topological, Geometrical, and Generalized Shape Optimization", Computer Methods in Applied Mechanics and Engineering, 89, pp. 309-336.
View Article
[7] ROZVANY, G.I.N., Olhoff, N., Cheng, K., Taylor, J.E., 1982, "On the Solid Plate Paradox in Structural Optimization", Journal of Structural Mechanics, 10-1, 1- 32.
View Article
[8] BENDSØE, M., P., 1995, "Optimization of Structural Topology, Shape and Material", Springer-Verlag, New York.
View Article
[9] BENDSØE, M. P, SIGMUND, O., 1999, "Material, Interpolations Schemes in Topology Optimization", Archive of Applied Mechanics, vol. 69, pp. 635-654.
View Article
[10] STOLPE, M. SVANBERG, K. On the trajectories of penalization methods for topology optimization. Struct. Multidisc. Optim., v. 21, p. 128-139, 2001.
View Article
[11] KENNEDY, J.; Eberhart, R. (1995). Particle Swarm Optimization. Proceedings of IEEE International Conference on Neural Networks. IV. pp. 1942-1948. doi:10.1109/ICNN.1995.488968
View Article
[12] VALLE, Y. del; Ganesh K., 2008. Particle Swarm Optimization: Basic Concepts, Variants and Applications in Power Systems. IEEE Transactions on Evolutionary Computation. 12. ISSN 1089-778X
View Article
[13] TANG, J; XIE, Y. M; FELICETTI, P. Topology optimization of building structures considering wind loading. Mechanics of Advanced Materials and Structures, 2012.
View Article
[14] Brazilian Association of Technical Standards - ABNT (Associação Brasileira de Normas Técnicas), NBR 6120 - Loads for calculating frame structures buildings - Procedure. 2019 (in Portuguese).
[15] Brazilian Association of Technical Standards - ABNT (Associação Brasileira de Normas Técnicas), NBR 6118 - Design of structural concrete - Procedure. 2023 (in Portuguese).
[16] MONTAUTE, M.; OLIVEIRA, H.; BUTTIGNOL T. Comparative Study of Topologically Optimized Bridge Girders Considering Static and Cyclic Loads 2024.
View Article
[17] BUTTIGNOL, T. E. T.; GRANATO, E. C.; BITTENCOURT, T N; BITTENCOURT JR, L. A. G. . Experimental and numerical analyses of RC beams strengthened in compression with UHPFRC. Structural Engineering and Mechanics, v. 85, p. 511-529, 2023.
[18] LUBLINER, J.; OLIVER, J.; OLLER, S.; ONATE, E., 1989. A plastic-damage model for concrete. International Journal of solids and structures, Elsevier, v. 25, n. 3, p. 299-326.
View Article
[19] DI PRISCO, M.; FERRARA, L. AND LAMPERTI, M. G. L.: Double edge wedge splitting (DEWS): an indirect tension test to identify post-cracking behaviour of fibre reinforced cementitious composites. Materials and Structures, February 2013, pp. 1893-1918, 2013.
View Article
[1] XIE, Y. M; FELICETTI, P; TANG, J. Conceptual design of building structures subjected to wind load by using to topology optimization. Wind and Structures, v.18, p. 21-35, 2014. View Article
[2] Lopez, R.; Beck, A. Optimization under uncertainties. In: Optimization of Structures and Components. Springer, 2013. Cap. X, pp. 117-138. View Article
[3] ESCHENAUER, H. A; OLLOFF, N. Topology optimization of continuum structures: A review. Appl. Mech., v. 54, 2001. View Article
[4] FIEBIG, S; AXMANN, J. K. Using a binary material model for stress constraints and nonlinearities up to crash in topology optimization. 10th World Congress on Structural and Multidisciplinary Optimization, Orlando, 2013
[5] BENDSOE, M. P. KIKUCHI, N., 1988, "Generating Optimal Topologies in Structural Design Using a Homogenization Method". Computer Methods in Applied Mechanics and Engineering, 71, pp. 197-224. View Article
[6] ZHOU, M., ROZVANY, G.IN, 1991, "The COC Algorithm, Part II: Topological, Geometrical, and Generalized Shape Optimization", Computer Methods in Applied Mechanics and Engineering, 89, pp. 309-336. View Article
[7] ROZVANY, G.I.N., Olhoff, N., Cheng, K., Taylor, J.E., 1982, "On the Solid Plate Paradox in Structural Optimization", Journal of Structural Mechanics, 10-1, 1- 32. View Article
[8] BENDSØE, M., P., 1995, "Optimization of Structural Topology, Shape and Material", Springer-Verlag, New York. View Article
[9] BENDSØE, M. P, SIGMUND, O., 1999, "Material, Interpolations Schemes in Topology Optimization", Archive of Applied Mechanics, vol. 69, pp. 635-654. View Article
[10] STOLPE, M. SVANBERG, K. On the trajectories of penalization methods for topology optimization. Struct. Multidisc. Optim., v. 21, p. 128-139, 2001. View Article
[11] KENNEDY, J.; Eberhart, R. (1995). Particle Swarm Optimization. Proceedings of IEEE International Conference on Neural Networks. IV. pp. 1942-1948. doi:10.1109/ICNN.1995.488968 View Article
[12] VALLE, Y. del; Ganesh K., 2008. Particle Swarm Optimization: Basic Concepts, Variants and Applications in Power Systems. IEEE Transactions on Evolutionary Computation. 12. ISSN 1089-778X View Article
[13] TANG, J; XIE, Y. M; FELICETTI, P. Topology optimization of building structures considering wind loading. Mechanics of Advanced Materials and Structures, 2012. View Article
[14] Brazilian Association of Technical Standards - ABNT (Associação Brasileira de Normas Técnicas), NBR 6120 - Loads for calculating frame structures buildings - Procedure. 2019 (in Portuguese).
[15] Brazilian Association of Technical Standards - ABNT (Associação Brasileira de Normas Técnicas), NBR 6118 - Design of structural concrete - Procedure. 2023 (in Portuguese).
[16] MONTAUTE, M.; OLIVEIRA, H.; BUTTIGNOL T. Comparative Study of Topologically Optimized Bridge Girders Considering Static and Cyclic Loads 2024. View Article
[17] BUTTIGNOL, T. E. T.; GRANATO, E. C.; BITTENCOURT, T N; BITTENCOURT JR, L. A. G. . Experimental and numerical analyses of RC beams strengthened in compression with UHPFRC. Structural Engineering and Mechanics, v. 85, p. 511-529, 2023.
[18] LUBLINER, J.; OLIVER, J.; OLLER, S.; ONATE, E., 1989. A plastic-damage model for concrete. International Journal of solids and structures, Elsevier, v. 25, n. 3, p. 299-326. View Article
[19] DI PRISCO, M.; FERRARA, L. AND LAMPERTI, M. G. L.: Double edge wedge splitting (DEWS): an indirect tension test to identify post-cracking behaviour of fibre reinforced cementitious composites. Materials and Structures, February 2013, pp. 1893-1918, 2013. View Article