International Journal of Civil Infrastructure (IJCI)
ISSN: 2563-8084

Volume 7 - Year 2024- Pages 104-111
DOI: 10.11159/ijci.2024.011
Evaluation of Flexural Performance of Slab Bridges in the Pacific Northwest Region Subjected to Long-Duration Earthquake Events
Shaymaa Obayes1, Monique Head1
1University of Delaware, Department of Civil and Environmental Engineering
127 The Green, 301 DuPont Hall, Newark, DE, USA 19716
shko@udel.edu; head@udel.edu
Abstract - While previous studies have explored bridge vulnerabilities, there is a notable gap in assessing the susceptibility of existing bridges, particularly slab bridges, to long-duration earthquakes in seismically active regions. This study uniquely quantifies and evaluates the impact of a moment magnitude (MW) 9.0 earthquake, characterized by its long duration, on the incipient collapse risk of slab bridges in the Pacific Northwest (PNW) region of the United States. The assessment includes potential flexural failures in slab bridge columns and the associated collapse risk. A slab bridge is modeled in OpenSees for case studies to determine vulnerability and incipient collapse risk through fragility analyses and a risk-targeted approach in accordance with the 2023 AASHTO Guide Specifications for LRFD Seismic Bridge Design. The study emphasizes the consequences of outdated seismic design standards, particularly for slab bridges constructed before the 1990s. Moreover, the findings reveal that long-duration earthquakes significantly increase the collapse risk of aging slab bridges built before the 1990s.
Keywords: Slab bridge, Pacific Northwest, Long-duration, Fragility analyses, Risk-targeted.
© Copyright 2024 Authors - This is an Open Access article published under the Creative Commons Attribution License terms. Unrestricted use, distribution, and reproduction in any medium are permitted, provided the original work is properly cited.
Date Received: 2024-06-03
Date Revised: 2024-07-11
Date Accepted: 2024-07-30
Date Published: 2024-08-08
1. Introduction
The Pacific Northwest (PNW) region lies within the Cascadia Subduction Zone (CSZ), and is characterized by producing the world's most powerful Long-duration earthquakes with magnitudes exceeding MW 8.5 [1, 2]. Consequently, during such seismic events, bridges in this region, particularly those designed before the 1990s, face a higher risk of damage. This damage can occur through flexure, shear, or a combination of flexural-shear behavior, depending on the reinforcement details. The majority of the interstate highway systems in the PNW region which include both Washington and Oregon states were built in the mid to late 1960s. These bridges were built according to less stringent seismic design standards than those in place today, making them particularly vulnerable to the next significant earthquake or tsunami. Consequently, the focus of this study is to evaluate the flexural assessment and the risk of collapse for slab bridges built before the 1990s in the PNW using fragility curves and risk-targeted approach in accordance with the 2023 AASHTO Guide Specifications for LRFD Seismic Bridge Design. The next megathrust earthquake has the potential to significantly disrupt communities and destroy infrastructure, including many bridges along the PNW.
Since 2015, researchers from the University of Washington have been studying the effects of a magnitude nine (MW 9.0) earthquake along the Cascadia fault and exploring ways to mitigate the risks through the MW 9.0 Project (https://sites.uw.edu/pnet/m9-simulations/about-m9-simulations/) [3]. This study will utilize the MW 9.0 simulated ground motions characteristic of the PNW region.
2. Research Objective
The primary objective of this study is to quantify the flexural failure and collapse risk of slab bridges typical in the PNW region during long-duration earthquakes using fragility analysis. Additionally, the study aims to assess the impact of location on the incipient collapse risk of slab bridges in the PNW, whether they are situated within or outside the basin, according to the latest site classification definitions outlined in AASHTO, 2023 [4]. The investigation includes analyzing the effects of outdated seismic design standards, particularly focusing on column displacement ductility, on the structural capacity of slab bridge columns. Furthermore, the study employs the new risk-targeted approach from the 2023 AASHTO Guide Specifications for LRFD Seismic Bridge Design [5] to evaluate the collapse risk for existing slab bridges. The updated 2023 version of the AASHTO LRFD Bridge Design Specifications has transitioned to a risk-targeted approach rather than a uniform seismic hazard approach, which represents a significant shift in evaluating and mitigating seismic risks for bridge design.
3. Bridge Inventory in the Pacific Northwest (PNW) Region
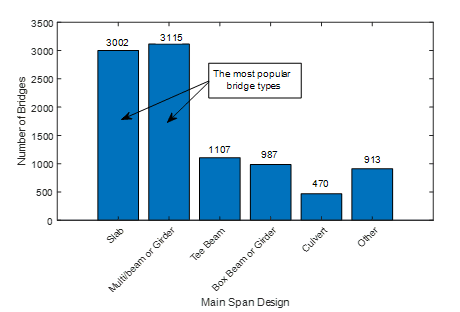
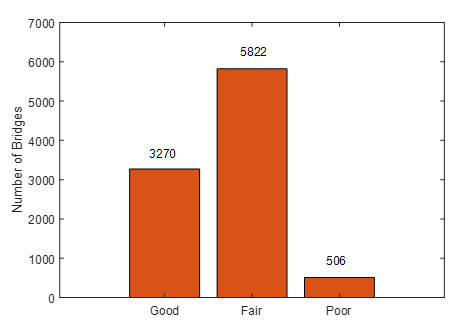
In this study, the bridges in Washington and Oregon states were considered to represent the PNW region. These two states have close to 9600 bridges with varying ages, and construction styles. Figure 1 illustrates the categorization of bridges in the PNW region according to the design of their main span, as per the FHWA National Bridge Inventory [6-8]. It was discovered that over 32% of the bridges are slab, with 97% of them built utilizing the concrete construction style. Furthermore, figure 2 indicates that 66% of the bridges in the PNW region are rated in fair to poor condition.
4. Methodology
The methodology begins with the careful selection of ground motions representative of the Pacific Northwest (PNW) region, crucial for simulating realistic earthquake scenarios. The OpenSees framework is utilized to accurately simulate the structural response under seismic loading, incorporating the complexities of slab bridge configurations and material properties. Fragility analysis is then conducted to assess the flexural performance of the slab bridge, considering the site conditions as per the latest AASHTO site classification definitions, 2023. Finally, the study employs a risk assessment approach based on the 2023 AASHTO Guide Specifications for LRFD Seismic Bridge Design, focusing on evaluating the collapse risk of existing slab bridges under long-duration earthquake effects.
4. 1. Selection of ground motions for the PNW region
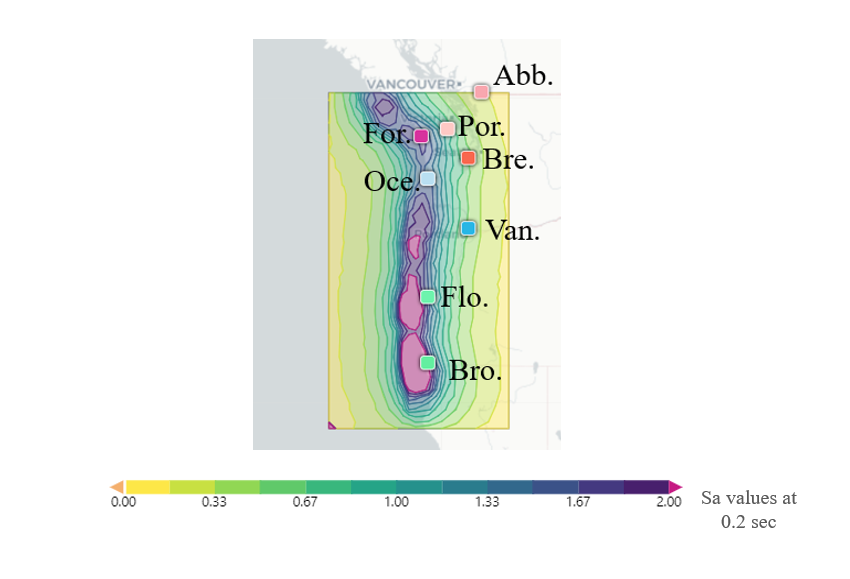
This study aims to investigate the previously mentioned objective under the long-duration earthquake. Because there is a limited number of long-duration records available in the PNW region, simulated ground motions of MW 9.0 earthquakes in the PNW region are utilized for this purpose. Eight representative locations across the PNW region were identified and listed in Table 1, depicted in figure 3. The locations are classified into two groups: coastal and inland, based on their proximity to the fault, Z2.5 values (representing the depth to a shear-wave velocity of 2500 m/s), and numerical intensity measure (IM) that describe their content. For each location, 30 different earthquake rupture scenarios were selected, resulting in a total of 240 simulated ground motions across the eight locations. The coastal areas include Brooking, Florence, Ocean Shores, and Forks, while the inland regions consist of Abbotsford, Vancouver, Bremerton, and Port Angeles, Figure 3. These classifications are roughly aligned with those utilized by Kortum et al., 2022 [9, 10]. The peak ground accelerations (PGAs) for the simulated ground motions range from 0.14 to 1.84 g. Ground motion data for the eight locations were sourced from the nearest monitoring station to each city, with the station IDs provided in table 1, column 1.
Table1. Representative locations across the PNW region selected for the study.
|
Station Name |
City Name |
PGA (g) |
Category |
|
D00414 |
Abbotsford |
0.14 |
Inland Outside of Basin |
|
C03853 |
Vancouver |
0.43 |
Inland Outside of Basin |
|
A11120 |
Bremerton |
0.49 |
Inland Deep Basin |
|
Y0FRE |
Florence |
0.99 |
Coastal Outside of Basin |
|
B01192 |
Forks |
1.07 |
Coastal Outside of Basin |
|
B01052 |
Ocean Shores |
1.29 |
Coastal Outside of Basin |
|
Z0XANG |
Port Angeles |
1.55 |
Inland Shallow Basin |
|
Z0XCRC |
Brookings |
1.84 |
Coastal Outside of Basin |
4. 2. OpenSees model development
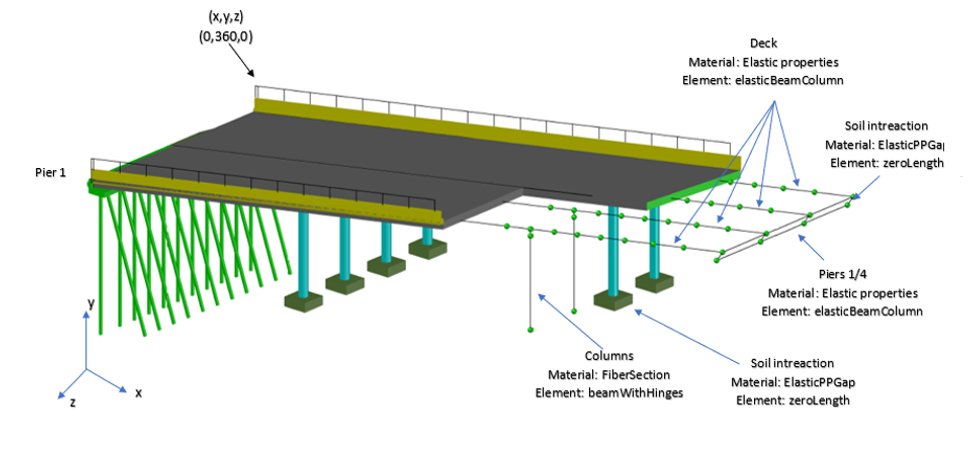
A three-span slab bridge in the PNW region was modeled using the OpenSees software [12] to assess the flexural behavior of its reinforced concrete (RC) columns. Various element types were utilized during the modeling process to accommodate the nonlinearities within the bridge components. The superstructure consists of an RC deck slab with spans of 56 ft, 69.5 ft, and 59.5 ft, respectively. At each end span, there are four integral columns positioned at 56 ft and 125 ft. Figure 4 illustrates the materials and element types utilized in the OpenSees model for the bridge components. For the columns, Concrete04 was utilized to model the uniaxial core concrete material, accounting for degraded linear unloading/reloading stiffness. Concrete01 was used to model the cover concrete (2 in), with this material type considering zero tensile strength. The reinforcement was modeled using a uniaxial hysteretic material available in the OpenSees library.
4.2.1. Model verification
To confirm the proper use of concrete and hysteretic materials, a pushover analysis of a circular reinforced concrete column, based on Dusicka and Lopez [13] using a nonlinear OpenSees model was conducted. The OpenSees column model matched the experimental column, using materials identical to the slab bridge column. The experimental column had concrete strength of 4,700 psi and Grade 40 steel with yield stress fy = 40 ksi and tensile strength fu = 60 ksi, with a span-to-depth ratio of 5.3. The modulus of elasticity was calculated using ACI 318-19 standards. The confined concrete model for 4,700 psi was used to determine the compressive strength of both confined and unconfined concrete. The comparison aligns well with test data, indicating the nonlinear OpenSees column model accurately represents actual behavior. Thus, the OpenSees model is suitable for simulating the bridge columns in this study.
4. 3. Fragility analysis for flexural assessment
A seismic demand model and damage states capacity need to be conducted in order to develop the fragility analysis, where the seismic demand model could be quantified by developing the Probabilistic Seismic Demand Model (PSDM). PSDM characterizes how earthquakes may affect a structure by relating an Intensity Measure (IM) to an Engineering Demand Parameter (EDP). The IM used for flexural assessment is PGA, while the EDP is represented by the column displacement ductility. The damage states capacity (DSs) outlines the probable damage incurred by structures at the demand level experienced during an earthquake. Four damage states, slight, moderate, significant, and complete damage are considered, comparable to those found in HAZUS-MH [14]. In the analysis, the column demand from Nonlinear Time History (NLTH) analysis and the IM data from ground motions are subjected to a regression analysis to determine the parameters of the PSDM. The column displacement ductility is the EDP considered for the flexural assessment and is defined as follows:

where μmax is the maximum displacement and μyield is the displacement when the vertical reinforcements reach the steel yield strength at the first time; which is the displacement of the column at first yield.
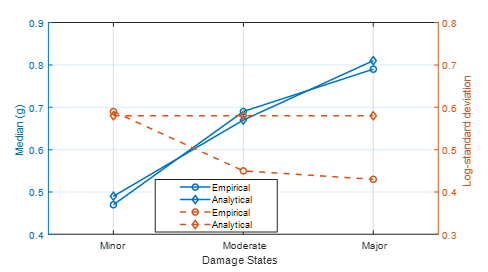
4.3.1. Analytical fragility curves validation.
To validate the analytical fragility curves, they should be compared to empirical fragility curves derived from actual bridge damage data from past earthquake ground motions like Northridge, Kobe, and Loma Prieta. The demand of the bridge model under the effect of Kobe earthquake will be compared to empirical fragility curves derived from actual bridge damage data from Kobe in this study.
Shinozuka et al. [15] developed empirical fragility curves using bridge damage data from the 1995 Kobe earthquake. The curves were based on damage records created by the Hanshin Expressway Public Corporation, utilizing statistics reported by HEPC engineers after the earthquake.
The empirical fragility curves were modeled using two-parameter lognormal distribution functions, defined by their median and log-standard deviation using 770 columns with similar geometry. The intensity measure (IM) was the PGA values recorded at each column location during the Kobe earthquake and the corresponding damage for each PGA. The authors considered three damage states (major, moderate, and minor) and three fragility curves, Table 2.
Table 2. Median and log standard deviation for the three empirical fragility curves [15].
|
Damage state |
Median (g) |
Log-standard deviation |
|
Minor |
0.47 |
0.59 |
|
Moderate |
0.69 |
0.45 |
|
Major |
0.79 |
0.43 |
This study uses Kobe 1995 earthquake data from the NGA-West2 databases and the Pacific Earthquake Engineering Research Center (PEER) to compute analytical fragility curves for the slab bridge. Assuming the capacity limit states follow the definition of HAZUS [16, 17], the medians and standard deviation of the slab bridge is presented in Table 3. Figure 5 compares the predicted analytical fragility curve with empirical data from the Kobe 1995 earthquake. The slab bridge column shows generally good agreement between predicted and observed fragility, although minor differences may be attributed to variations in column reinforcement details.
Table 3. Median and log-standard deviation using analytical fragility method using Kobe 1995 earthquakes data.
|
Damage state |
Median (g) |
Log-standard deviation |
|
Minor |
0.49 |
0.58 |
|
Moderate |
0.67 |
0.58 |
|
Major |
0.81 |
0.58 |
4.3.2. Sources of uncertainty in seismic bridge assessment
Various sources contribute to uncertainties in this study, encompassing modeling assumptions, variability in ground motion, complexities in nonlinear analysis, challenges in parameter estimation, and regional variations. To mitigate these uncertainties, rigorous validation of analytical models was conducted to reduce discrepancies between predicted and observed behaviors. Moreover, efforts were made to address complexities in the analytical methods, ensuring comprehensive consideration of model intricacies. The study utilized a diverse array of ground motion records, encompassing a wide range of potential rupture scenarios, to enhance confidence and minimize uncertainties associated with ground motion selection.
4.4. Risk assessment approach
Seismic hazard analysis is the process of predicting strong motion for specific sites to design a safe structure. The risk of collapse is a function of the overlap between the developing fragility curve which is a response damage function of a structure and the hazard curve which is the likelihood of observing ground motions of different intensities at the site being exceeded in a time frame (AASHTO, 2023a). In this study, the individual effect of MW 9.0 simulated ground motions using AASHTO Guide Specifications for LRFD Seismic Bridge Design (2023a) approach on calculating the collapse risk is discussed and compared to specification limit per AASHTO Guide Specifications for LRFD Seismic Bridge Design (2023) and AASHTO LRFD Bridge Design Specifications (2020). The design target ground motions for AASHTO Guide Specifications for LRFD Seismic Bridge Design (2023a) is 1.5% in 75 years, but 7% in 75 years for AASHTO LRFD Bridge Design Specifications (2020). In the PNW region, the risk of collapse is calculated and assessed using fragility curves derived from an extensive Nonlinear Time History (NLTH) analysis for the slab bridge and a recently updated 2018 seismic hazard map. Fragility curves for the DS4, representing complete damage, for slab bridges in both inland and coastal locations, considering the seismic activity level in the PNW region. Spectral displacement at short periods (0.2 sec) is used to assess the risk posed by seismic loads from simulated ground motions of MW 9.0 earthquakes. For inland sites, the hazard curve for Port Angeles is utilized, whereas Ocean Shores is chosen for coastal locations, as both cities experience a higher annual frequency of exceedance.
5. Results
The study examines flexural failure in existing slab bridges located in the state of Washington within the PNW region, particularly under long-duration earthquakes. Fragility curves are created using the Intensity Measure (IM) of PGA and the Engineering Demand Parameter (EDP) of column displacement ductility for a selected slab bridge in the PNW region built before the 1990s. The analyses aim to demonstrate the impacts of older bridge designs and their seismic vulnerability, particularly when evaluating column displacement ductility in columns with low confinement. This assessment is then compared with the current specification limit by AASHTO Guide Specifications for LRFD Seismic Bridge Design (2023), which adopts a risk-targeted approach.
5.1. Flexural Assessment Results
Fragility curve analysis is utilized to assess the flexural failure of the slab bridge column. A total of 240 ground motion records were generated and paired with the analytical model, resulting in 240 model outcomes. For each ground motion, a complete nonlinear time-history analysis, capturing the maximum demand on the bridge. Subsequently, the bridge demands were correlated with the PGA and spectral acceleration (Sa) of the ground motion responsible for the demand.
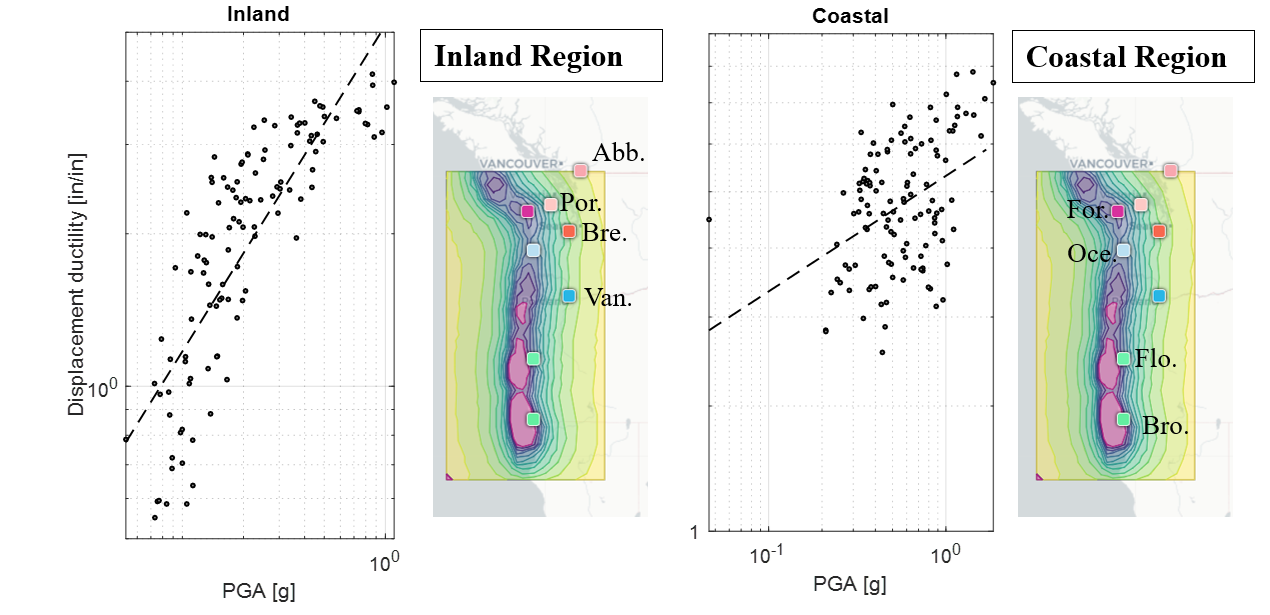
5.1.1. Fragility as a function of peak ground acceleration
Given that the columns of the bridges were anticipated to be the primary failure source, the column demand was then plotted against the PGA of the ground motion. These datasets are subjected to regression analysis to estimate the parameters of the PSDM. Figure 6 illustrates the PSDM, depicting the correlation between PGA and displacement ductility of slab bridge columns in both inland and coastal cities. Notably, there is a considerable difference in column demand between inland and coastal cities, with a higher demand observed in bridge columns located in coastal cities. This disparity is anticipated due to the closer proximity of coastal cities to active faults, resulting in higher PGAs (approximately exceeding 1g).
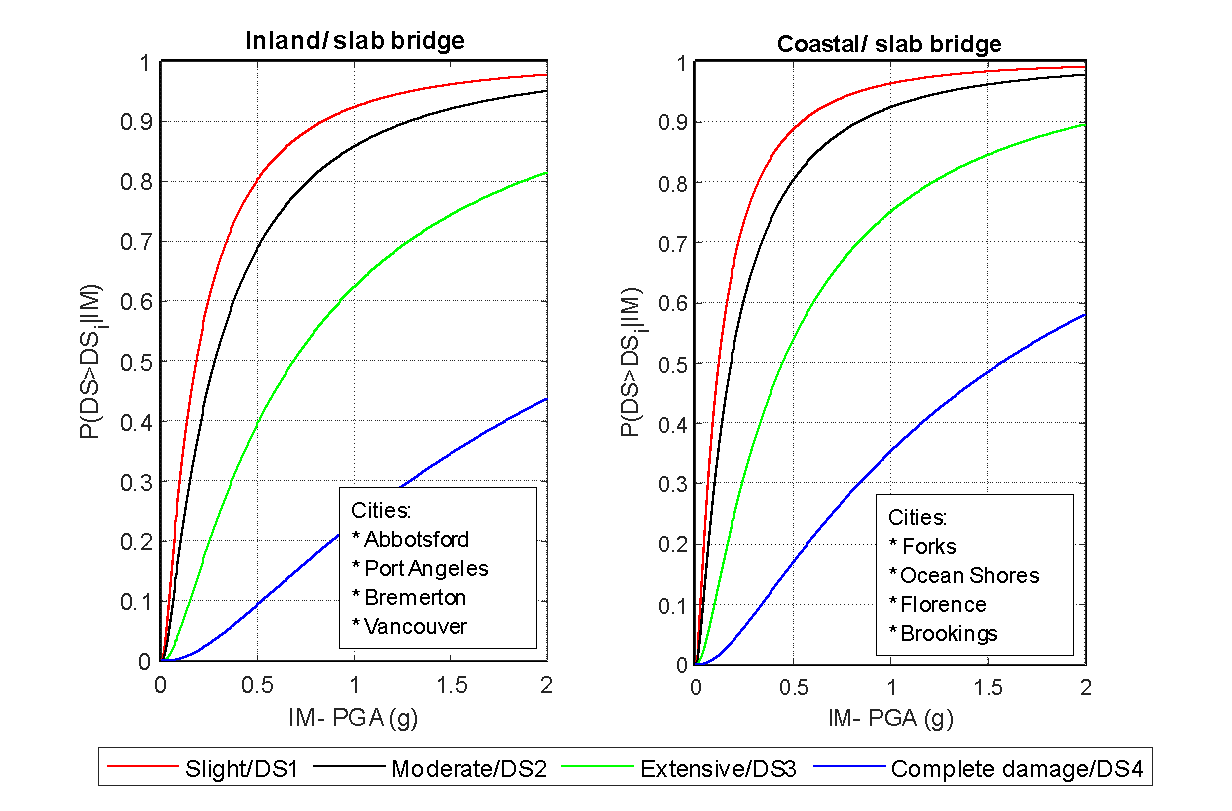
Fragility curves for slab bridges under seismic loads are plotted to evaluate their vulnerability to earthquake- induced damage. Figure 7 shows these fragility curves for the slab bridge for the four limit states relative to PGA. Notably, there are significant variations in the fragility curves between the two groups of sites, influenced in part by their proximity to active faults. The fragility curves illustrate how a slab bridge might respond if it were located in various cities subjected to specific ground motions. Based on these curves, it is evident that if slab bridges were located near coastal cities, they would ideally experience higher demands due to the specific ground motions in those areas.
The implementation began with the creation of blocks corresponding to geometry configuration, material characterisation and specification; stresses; load regions and displacement boundary conditions. The 3D parametric model is shown in Figure 2, in which it is possible to see the isometric, side and top views of the element created, as well as the loads acting on the top face of the beam.
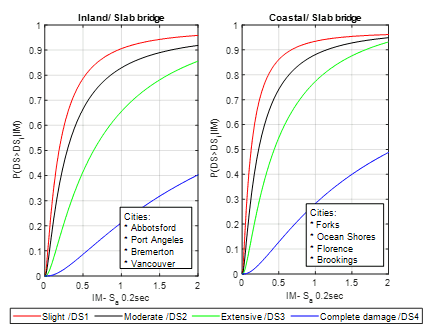
5.1.2. Fragility as a function of spectral acceleration and displacement
The fragility curves for the slab bridge model were developed using Sa (spectral acceleration) and Sd (spectral displacement) at a period of 0.2 seconds as intensity measures (IM) in both coastal and inland cities. The choice of Sa at 0.2 seconds as the IM was based on its relevance in capturing the seismic response characteristics critical to slab bridges. For each simulated MW 9.0 ground motion scenario, the study computed the maximum spectral acceleration and spectral displacement for the three orthogonal components (horizontal N-S, horizontal E-W, and vertical). These values were used as IMs, while the corresponding displacement ductility ratios were considered as engineering demand parameters (EDP) to construct the fragility curves.
Figure 8, included in the study, displays the resulting fragility curves for both coastal and inland cities. Each set of curves was derived from analyzing 120 distinct ground motion scenarios, providing insights into the probabilistic damage potential of slab bridges under varying seismic intensities.
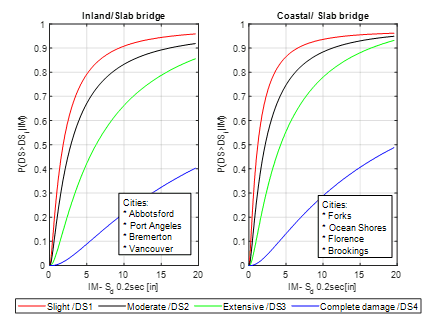
In addition, fragility curves specific to the slab bridge were developed by employing spectral displacement (Sd) at a period of 0.2 seconds as the intensity measure (IM). This approach allowed for distinct assessments tailored to both coastal and inland cities. Similar to the Sa analysis, 120 different ground motions were utilized to capture a wide range of potential seismic scenarios for each location. The resulting fragility curves, depicted in Figure 9, illustrate the likelihood of structural damage or failure for slab bridges in coastal and inland settings. In coastal cities, where ground motion characteristics can vary from inland cities due to coastal proximity and differing soil conditions, fragility curves based on Sd and Sa at 0.2 seconds illustrate varying probabilities of failure across different damage states compared to inland cities. Furthermore, the fragility curves exhibited notable variations between locations due to the differing spectral acceleration and displacement characteristics at each site. Consequently, fragility curves for coastal cities may indicate higher probabilities of surpassing damage thresholds compared to inland cities at equivalent levels of Sa and Sd at 0.2 seconds.
5.2. Seismic risk assessment results
In this section, the impact of MW 9.0 simulated ground motions on calculating the targeted collapse risk for the slab bridge is assessed. Following the methodology outlined in section 4.4, the 75-year probability of collapse for Port Angeles is determined to be 8.25%, whereas for Ocean Shores is 5.25% using MW 9.0 simulated ground motion for slab bridge evaluation. The collapse risk over 75 years for all inland regions was found to be higher than that of the coastal regions, and both risks significantly surpass the target 1.5% probability of collapse in 75 years proposed by the AASHTO Guide Specifications for LRFD Seismic Bridge Design, 2023 [5].
Additionally, as stated by AASHTO (2020), a 7% probability of exceedance in 75 years could lead to substantial damage and disruption to bridges, emphasizing the need for designing bridges with a low probability of collapse. In summary, the anticipated MW 9.0 ground motion in the future has the potential to cause significant damage and service disruptions, particularly for aging slab bridges in the PNW region [5]. The geographical location plays a crucial role in risk assessment; for instance, the Inland region exhibits a higher hazard curve compared to the coastal region, posing a greater risk to structures with limited seismic resilience, such as slab bridges.
6. Conclusion
This study involved modeling and evaluating existing slab bridges built prior to the 1990s located in the state of Washington within the PNW region under the effect of long-duration earthquakes through fragility analysis. Furthermore, the collapse risk for the slab bridge was assessed using MW 9.0 simulated ground motions following the approach outlined in the 2023 AASHTO Guide Specifications for LRFD Seismic Bridge Design. The bridges examined in the PNW region were built before the 1990s and thus lack the risk considerations incorporated in the current 2023 risk-targeted approaches. The ground motions utilized in this study accounted for site classifications and local site effects.
Insights obtained from the flexural assessment of these slab bridges provided crucial information about their performance under various ground motion scenarios. The updated risk-targeted methodology introduced in the AASHTO Guide Specifications for LRFD Seismic Bridge Design, 2023 was used to evaluate the vulnerability of older bridges constructed prior to the 1990s. The assessment revealed that MW 9.0 simulated ground motions, in particular, lead to increased damage and significantly heightened the risk in this area. Moreover, there were observable discrepancies in collapse risk across the different set versions, suggesting the varied effects of earthquake source mechanisms on different regions. The following conclusions were made from the analyses:
- Notably, fragility curves generated using PGA indicated notable regional differences, with coastal cities showing a higher probability of failure for slab bridges compared to inland cities in the PNW region.
- In coastal cities, seismic fragility curves based on Sd and Sa at 0.2 seconds show distinct probabilities of failure compared to inland cities, reflecting different ground motion characteristics and soil conditions.
These results suggest that slab bridges, a common bridge type in the PNW region built before the 1990s, would be more prone to column damage in the event of an anticipated MW 9.0 earthquake. This vulnerability arises from the fact that these older bridges were constructed under design codes that did not account for the seismic demands expected from such large magnitude earthquakes.
The simulated ground motions, which include the effects from the sedimentary basin characteristic of the region, provide a more accurate representation of the structural performance during long-duration earthquakes. These updated simulations reveal that the long-duration earthquakes can significantly increase the demands on the bridge columns, leading to a higher likelihood of damage or failure.
The fragility curves developed for these bridges estimate their vulnerability by showing the probability of damage as a function of PGA, Sa, and Sd. These curves indicate that the older slab bridges have a higher probability of experiencing severe damage or collapse, particularly due to their lack of modern seismic detailing.
The associated risks calculated from these analyses show that there is a substantial likelihood of significant damage to these older bridges, which could lead to disruptions in transportation networks, increased repair and replacement costs, and potential loss of life. In addition, utilizing updated seismic hazard maps provides a more accurate representation of the expected ground motions, which include these long-duration earthquake effects. This improved modeling leads to a better understanding of how these older bridges will perform under such conditions.
References
[1] PNSN. "Pacific Northwest Seismic Network (Cascadia Subduction Zone)," June 27, 2023;
View Article
[2] N. A. Marafi, M. O. Eberhard, J. W. Berman, E. A. Wirth, and A. D. Frankel, "Effects of deep basins on structural collapse during large subduction earthquakes," Earthquake spectra, vol. 33, no. 3, pp. 963-997, 2017.
View Article
[3] A. Frankel, E. Wirth, N. Marafi, J. Vidale, and W. Stephenson, "Broadband synthetic seismograms for magnitude 9 earthquakes on the Cascadia megathrust based on 3D simulations and stochastic synthetics, Part 1: Methodology and overall results," Bulletin of the Seismological Society of America, vol. 108, no. 5A, pp. 2347-2369, 2018.
View Article
[4] AASHTO. "AASHTO-2023 Web Services," NSHMP Static Data Services (usgs.gov).
[5] AASHTO, "AASHTO Guide specification for LRFD Seismic Bridge Design ", American Association of State Highway and Transportation Officials, 2023.
[6] FHWA, Recording and coding guide for the structure inventory and appraisal of the nation's bridges, Washington, D.C: U.S. Dept. of Transportation, Federal Highway Administration, 1995.
[7] FHWA. "Datasets between 1983 and 2018, National Bridge Inventory, Washington, DC,".
View Article
[8] NBI. "National Bridge Inventory, Federal Highway Administration. U.S. Department of Transportation."
[9] L. N. Kortum Z., Rezaeian S., "Gridded earthquake ground motions for the 2023 AASHTO Design Specifications," 2022.
[10] K.-J. Liu, "Impacts of Cascadia Subduction Zone M9 Earthquakes on Bridges in Washington State," ProQuest Dissertations Publishing, 2022.
[11] M. D. Visualization.
View Article
[12] S. Mazzoni, F. McKenna, M. H. Scott, G. Fenves, and B. Jeremic, "OpenSees command language manual. Pacific Earthquake Engineering Research Center," University of California, Berkeley, 2007.
[13] P. Dusicka, and A. Lopez, Impact of Cascadia Subduction Zone Earthquake on the Seismic Evaluation Criteria of Bridges, 2016.
[14] HAZUS, "Hazus Earthquake Model Technical Manual (Hazus 5.1), Federal Emergency Management Agency (FEMA)," FEMA Washington, DC, 2022.
[15] M. Shinozuka, M. Q. Feng, J. Lee, and T. Naganuma, "Statistical analysis of fragility curves," Journal of engineering mechanics, vol. 126, no. 12, pp. 1224-1231, 2000.
View Article
[16] P. Dusicka, and J. Roberts, "Bridge damage models for seismic risk assessment of Oregon Highway Network," 2011.
View Article
[17] H. Hwang, J. B. Liu, and Y.-H. Chiu, "Seismic fragility analysis of highway bridges," 2001.
[1] PNSN. "Pacific Northwest Seismic Network (Cascadia Subduction Zone)," June 27, 2023; View Article
[2] N. A. Marafi, M. O. Eberhard, J. W. Berman, E. A. Wirth, and A. D. Frankel, "Effects of deep basins on structural collapse during large subduction earthquakes," Earthquake spectra, vol. 33, no. 3, pp. 963-997, 2017. View Article
[3] A. Frankel, E. Wirth, N. Marafi, J. Vidale, and W. Stephenson, "Broadband synthetic seismograms for magnitude 9 earthquakes on the Cascadia megathrust based on 3D simulations and stochastic synthetics, Part 1: Methodology and overall results," Bulletin of the Seismological Society of America, vol. 108, no. 5A, pp. 2347-2369, 2018. View Article
[4] AASHTO. "AASHTO-2023 Web Services," NSHMP Static Data Services (usgs.gov).
[5] AASHTO, "AASHTO Guide specification for LRFD Seismic Bridge Design ", American Association of State Highway and Transportation Officials, 2023.
[6] FHWA, Recording and coding guide for the structure inventory and appraisal of the nation's bridges, Washington, D.C: U.S. Dept. of Transportation, Federal Highway Administration, 1995.
[7] FHWA. "Datasets between 1983 and 2018, National Bridge Inventory, Washington, DC,". View Article
[8] NBI. "National Bridge Inventory, Federal Highway Administration. U.S. Department of Transportation."
[9] L. N. Kortum Z., Rezaeian S., "Gridded earthquake ground motions for the 2023 AASHTO Design Specifications," 2022.
[10] K.-J. Liu, "Impacts of Cascadia Subduction Zone M9 Earthquakes on Bridges in Washington State," ProQuest Dissertations Publishing, 2022.
[11] M. D. Visualization. View Article
[12] S. Mazzoni, F. McKenna, M. H. Scott, G. Fenves, and B. Jeremic, "OpenSees command language manual. Pacific Earthquake Engineering Research Center," University of California, Berkeley, 2007.
[13] P. Dusicka, and A. Lopez, Impact of Cascadia Subduction Zone Earthquake on the Seismic Evaluation Criteria of Bridges, 2016.
[14] HAZUS, "Hazus Earthquake Model Technical Manual (Hazus 5.1), Federal Emergency Management Agency (FEMA)," FEMA Washington, DC, 2022.
[15] M. Shinozuka, M. Q. Feng, J. Lee, and T. Naganuma, "Statistical analysis of fragility curves," Journal of engineering mechanics, vol. 126, no. 12, pp. 1224-1231, 2000. View Article
[16] P. Dusicka, and J. Roberts, "Bridge damage models for seismic risk assessment of Oregon Highway Network," 2011. View Article
[17] H. Hwang, J. B. Liu, and Y.-H. Chiu, "Seismic fragility analysis of highway bridges," 2001.