International Journal of Civil Infrastructure (IJCI)
ISSN: 2563-8084

Volume 7 - Year 2024- Pages 112-125
DOI: 10.11159/ijci.2024.012
Evaluating In-Span Hinge Connections: Empirical Methods and Strut-and-Tie Analysis
Shaymaa Obayes1, Monique Head1
1University of Delaware, Department of Civil and Environmental Engineering
127 The Green, 301 DuPont Hall, Newark, DE, USA 19711
shko@udel.edu; head@udel.edu
Abstract - Shiplap hinge joints (SHJs) can alter the intended load paths and affect the structural performance of various bridge components, including the deck and piers. This issue is especially significant for older bridges with SHJs designed using traditional methods, which may not meet the minimum reinforcing, anchorage, and development length requirements specified in the AASHTO LRFD Bridge Design Specifications. The detailed finite element (FE) models are employed to examine load paths, mechanical contributions, and effective stress along rebar. It aims to compare the ultimate capacity and associated failure mechanisms of beam ledges with SHJs as predicted by both empirical and strut-and-tie methods. The analyses, conducted according to current AASHTO LRFD standards, illustrate the consequences of older bridge designs and their associated failure mechanisms when assessing beam ledges with SHJs. Additionally, the study offers insights into applying strut-and-tie methods for evaluating existing bridges with in-span hinge connections and properly accounting for development lengths using the strut-and-tie method compared to the empirical method.
Keywords: Shiplap hinge joints (SHJ), Strut-and-tie method, Empirical method.
© Copyright 2024 Authors - This is an Open Access article published under the Creative Commons Attribution License terms. Unrestricted use, distribution, and reproduction in any medium are permitted, provided the original work is properly cited.
Date Received: 2024-02-09
Date Revised: 2024-07-11
Date Accepted: 2024-07-28
Date Published: 2024-08-08
1. Introduction
Multi-span reinforced concrete box-girder bridges have in-span hinges and are known as multiple-frame bridges [1]. These bridges are also referred to as "beams/slabs" with a drop-in span and the joint is referred to as a “shiplap hinge joint” (SHJ). In this study, the behavior of SHJ is examined using two methods, empirical and strut-and-tie, in order to demonstrate how each method may be used during the structural design process. The De Concorde overpass structure in Laval, Québec is an example of bridge designed with SHJs and sudden collapse occurred due to the thick cantilever slabs' lack of shear reinforcement, incorrect installation of the top bars, and the poor quality of the concrete [2]. This collapse raised concerns about evaluating other bridges with designed SHJs, since safety and efficiency are important design targets that utilize different analysis methods yet often result in different performance levels. Consequently, a proper method should be used to evaluate the safety of existing bridges with similar details, age, and period of construction. In doing so, practitioners need to determine which approach is more accurate and best suited to the actual design situation when evaluating existing bridges with beam ledges and comparing the estimated capacity of the using either empirical or strut-and-tie methods.
Limited studies to date have focused on the comparison between evaluation results obtained from strut and tie (STM) method and empirical method outlined in the AASHTO LRFD Bridge Design Specification (BDS). Such a comparison can illustrate the differences in the information provided by each method. This paper presents the results of a case study that investigates two analysis methods (STM and empirical) to provide engineers with tools to evaluate existing complex concrete elements with confidence. Moreover, in terms of the new design, the owners need design methodology options for capacity assessment as appropriate. For this purpose, SHJs are being analyzed using both empirical and strut-and-tie methods, where additional nonlinear analyses are carried out to compare important parameters such as load path, failure mechanisms, and strength of common SHJ. Empirical and strut-and-tie procedures have been adopted from AASHTO LRFD Bridge Design Specifications [3].
1.1. Background
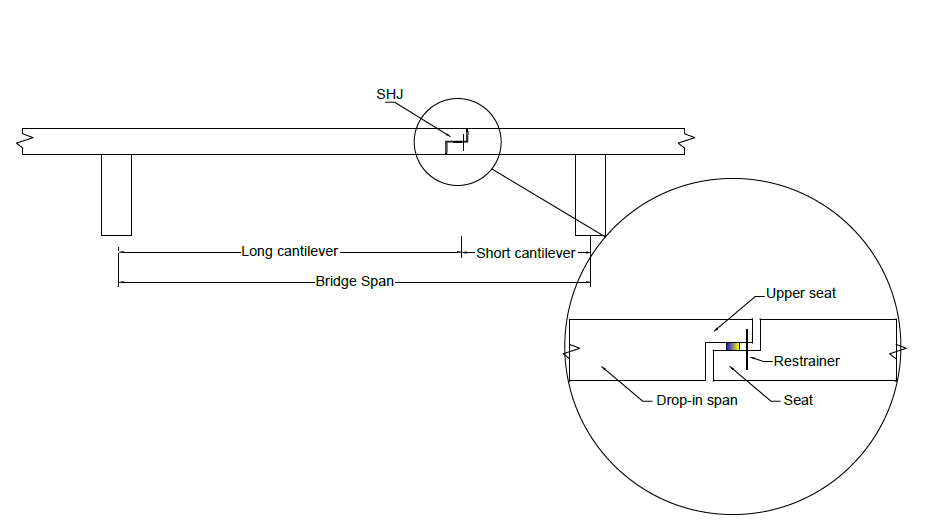
A typical section of a drop in-span and SHJ is illustrated in Figure 1. It consists of a seat, upper seat, bearing, and in some cases vertical restrainers to minimize movement of the hinges. Commonly, bearing pads are distributed in the transverse direction of the seat and are aligned with the axes of the webs of the box girder of the adjacent frame to transfer the concentrated load from the box girder to the seat. Bearing pads are often centered in the seat width or can sometimes be eccentric. This irregular geometry causes a unique distribution of stress through the section, which is unlike the fundamental principle of stress distribution following the Bernoulli rule.
1.2. Design Challenges of SHJ
SHJs are pivotal elements of the overall structural system for in-span bridges, and their behavior is one primary concern due to bringing irregularity to the span section. SHJs are beneficial for tolerating longitudinal expansion and contraction caused by creep, shrinkage, and temperature gradient. In addition, the drop-in span can be placed and constructed quickly over a road or railway, requiring shorter construction time [4]. However, there are potential disadvantages of using SHJs and bearings at the ends of the drop-in spans; the joints tend to leak, which promote corrosion of the steel reinforcement within the SHJ, which were thoroughly studied using strut-and-tie method in reference [4]. In addition, the effect of leaking is exacerbated on multi-span reinforced concrete girder bridges that have in-span hinges when de-icing salts are used. Moreover, there are very high tensile and shear stresses concentrated at the lower seat of the SHJ, where the structural depth is relatively small. Accordingly, a diagonal tension crack can spread quickly, causing failure with little or no warning [5]. Irregular geometry, discontinuity of the ledge (i.e., SHJ), and concentrated load from adjacent girders on the bearing beget unique loading conditions on the ledges. As such, understanding the load path is important when analyzing the structural behavior of SHJ. The concentrated loads from the adjacent bridge girders are transferred to the seat of the SHJ through the bearing pads; the hanger reinforcement transfers the load to the top tension cord and eventually to the columns supported at the end of the short cantilever slab. Therefore, any variations of the vertical load through the SHJ section may cause considerable influence on the global behavior of other parts of the bridge such as the deck and piers.
Forces through the entire section of the SHJs should not exceed the design forces of the joint. If there is not ample capacity of the SHJ to withstand the high shear stress and presence of the concentrated load, then finding space for additional reinforcement in the SHJ may prove to be difficult. Also, this might lead to a high possibility of inconsistent placement of steel reinforcing steel in the as-built structure compared to its intended design layout. Mainly, the concrete should have enough compression strength to withstand the compression load. Likewise, the reinforcing steel bars within the SHJ region should prevent failure due to shear friction between the seat and the slab. This can be achieved by providing horizontal bars concentrated near each bearing pad. These horizontal bars also increase the seat bending capacity about the longitudinal axis of the frame and prevent the flexural failure of the ledge. Diagonal and vertical bars at the seat are used to prevent hanger reinforcement failure mechanisms by transferring a load path up to the compression region.
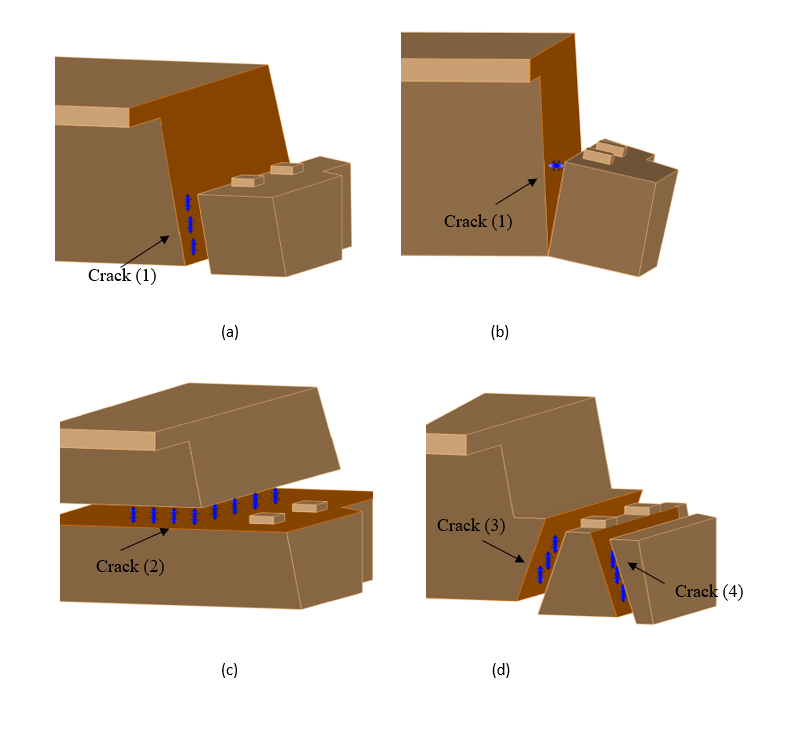
When each of these reinforcement requirements is underestimated, one of the ledge failure mechanisms shown in Figure 2 is highly expected to occur. Therefore, there is a need to address the joint and bearing details at the ends of the drop-in spans to mitigate overestimation or underestimation of the capacity, as well as failure mechanisms using methods that better reflect the actual structural behavior of the SHJ. This research will investigate the ability of the strut-and-tie method in capturing the structural response of reinforced concrete bridges with SHJ and comparing it to the traditional empirical design method to illustrate the potential application of each technique when evaluating existing bridges.
2. Methodology
2.1. Empirical Method
An in-span hinge can be designed according to the beam ledge provisions outlined in AASHTO LRFD [3]. These provisions identify four potential failure mechanisms: shear failure and horizontal forces, flexure failure, tension failure mechanisms or failure in hanging the load up, punching shear failure due to concentrated loads, and bearing failure. Figure 2 illustrates the potential failure mechanisms considered in this research. Each of these failure mechanisms must be examined independently.
2.2. Strut-and-Tie Method
Strut-and-tie method provisions have been included in the AASHTO LRFD specifications since 1994 [6]. It is a lower-bound design and based on a lower bound theorem, which states that the structure will not collapse or will only be at the point of collapse if an equilibrium distribution of stress can be found that balances the applied load and is everywhere below yield or at yield [7]. Accordingly, the results of the capacity analysis obtained from the strut-and-tie method should be conservative as long as equilibrium and failure criteria are satisfied [7,8]. Additionally, sufficient reinforcement anchorage should be provided. The complex flow of the stress through structural components can be simplified into a truss model such that yield strengths do not exceed 517 MPa and normal weight concrete compressive strengths are up to 103.4 MPa [3]. From the truss analogy model that can represent any concrete element disturbed by a load or geometric discontinuity, the load patterns can be expressed as triangulated models in which the load transfers to the support through truss elements. However, this method has been a source of confusion for design practitioners [8] because there might be more than one solution for a particular problem.
Strut-and-tie method can provide a solution for non-standard element problems with discontinuity. The discontinuity is either due to a concentrated load or abrupt change of the geometry, or both; and for all cases, higher shear stress will be developed in such regions. Identifying the D-boundaries region's is the first step in the strut-and-tie approach. Based on Saint Venant’s principle, the boundaries of the D-regions lie within one cross-sectional dimension, the component depth of the geometric or load discontinuity [9, 10]. For the strut-and- tie modeling, the external forces acting on the boundary of the D- region should be determined as a concentrated force applied at the nodes. Then, the load path method can be used to trace the flow of the forces through the region. The identified load paths are used to determine the location of truss elements. Additional struts and ties might be added to ensure equilibrium of forces [7, 9]. A strut and tie model (STM) consists of compression struts that represent concrete stress, tension ties that represent one or more layers of tension reinforcement, and nodes that link struts and ties together.
The strut is the element in the STM that resists the parallel or fan-shaped compression field. The idealization of the strut is highly dependent on the nodal zone strength, bearing length, or the inclination in a section [3]. The internal lateral spread of the applied compression force on the nodes of the STM causes tensile stresses transverse to diagonal strut elements. These tensile stresses reduce the efficiency of the concrete around the strut. Therefore, crack control reinforcement is placed to mitigate the appearance of diagonal cracks within the member. In addition, the efficiency of the concrete is reduced by the strut efficiency factor, v [3, 10]. The strut efficiency factor, v, of the interior strut is highly affected by the layout of the distributed crack control reinforcement. For instance, AASHTO [3] recommends the use of an efficiency factor of 0.45 when crack control reinforcement is not provided. However, ACI 318 code [11] specifies the v to be 0.51 when there is transverse reinforcement provided for the bottle strut where the width of the compressed concrete can spread laterally at mid-length. Different researchers have investigated the strut efficiency factor such as MacGregor (1997)[12], in this research it is suggested that the efficiency factor should be based on Equation 1 for the struts without transverse reinforcement, where f’c is the concrete strength in MPa units.
According to AASHTO LRFD Bridge Design Specifications [3], concrete crushing in the nodal zones may be to blame for the structure's failure since the stresses in a STM concentrate in these important zones and the geometry of the nodal regions may indeed be directly related to the capacity of a truss model. Hence, there is no need to evaluate compression further in the strut because the compressive stress will be at its highest value at a node. Omitted in AASHTO [3], this check was required in previous AASHTO editions.
42.3. Anchorage of Ties
For the concrete to resist the compressive forces and the rebar to resist the tensile force in a section of the structure, an adequate bond should be provided to allow force transfer between the two materials. In addition, to allow ties to utilize their full capacity, the reinforcing bars must be correctly anchored, where the anchorage check and the development length for the tension ties are a crucial feature of nodal zones. The anchorage length of a tie can be measured from the point when the resultant tension tie force enters the extended nodal zone [4].
The tension force should be transferred to the node regions of the truss. Therefore, the anchorage of ties must be checked to achieve the resistance assumed by the STM and yield will occur. Several factors that can affect the compressive bond anchorage properties between the concrete and steel such as the strength of the concrete, the diameter steel bar, cover of the concrete, and embedment length. However, it was found that the surrounding concrete cover thickness has a greater impact on compressive bond strength than the steel bar's diameter [13].
A limit to the tie capacity should be applied if an insufficient development length is provided [4]. Based on previous research, there are two approaches to reduce the tie capacity to account for unsatisfactory anchorage of ties: 1) a simplified approach and, 2) rigorous approach. A simplified approach consists of multiplying the tension ties by a reduction factor λ. This is a simple approach but does not accurately satisfy the requirements of a lower bound method [14]. Another approach, deemed as a rigorous approach, consists of having the forces in the bars to not exceed F_{tie} specified in Equation 2 [14].

where la is the ratio of the actual provided anchorage length of the bar to the full anchorage length, α is the residual bond strength factor, β is the bar type coefficient, and γmb is a partial safety factor equal [4].
3. Case Study: Numerical Investigation
3.1. Bridge Details
The SHJ for a midwestern United States bridge has been analyzed based on the empirical method and the strut-and-tie method implemented in AASHTO LRFD [3]. The bridge consists of six cast-in-place girders with the main span consisting of reinforced concrete box girders. The bridge was built in 1972 as two separate structures for the northbound and southbound directions with 4 lanes and was opened to traffic in 1973.
3.2. General Data and Layout of the Bridge
The main span type of the bridge is a curved box girder reinforcement concrete. The total number of spans is 11 with a main span length of 29.8 m and total length of 283.7 m. The deck material is cast-in-place (CIP) concrete, and the wearing surface consists of latex modified concrete, which was installed in 2001 with a depth of 0.048 m. Load reactions from adjacent frame are calculated on a critical neoprene pad at the joint using QConBridge [15]. The dead load, including the weight of the girder, slab, asphalt, barrier, and steel bridge rail, was calculated as longitudinal distributed loads for each girder, and the highest load was picked since there is different length for each girder. Shear and moment distribution factors were calculated based on AASHTO. The multiple presence factor and centrifugal forces due to the curvature of the bridge were also added. The dynamic load allowance for the truck load was 33% using HL-93 notional loading. The unit weight of the reinforced concrete is assumed to be 22.7 kN/m3 since the concrete strength is 27.5 MPa, which is less than 34.4 MPa [3]. The Strength 1 [3] load combination governed, giving a value of 907 kN at the bearing pad.
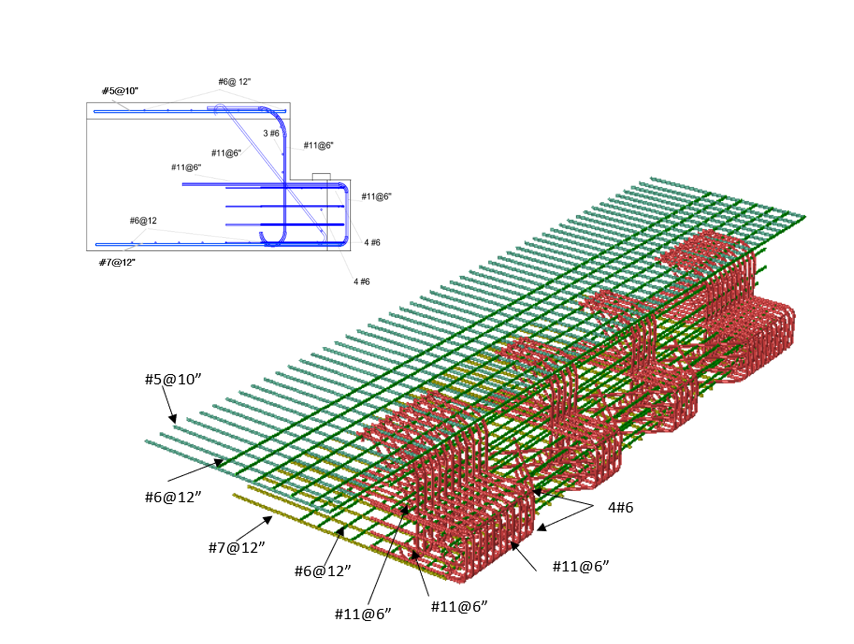
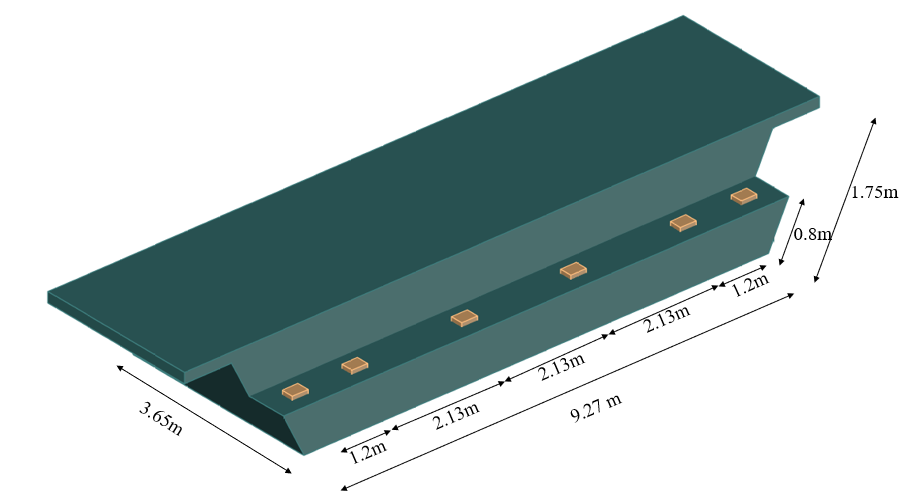
The reinforcing layout of the SHJ is introduced in Figure 3, which is also used for the nonlinear finite element analysis which will be described later. The joint supports six girders from the adjacent structure and, in turn, is supported by two circular columns with 1.22 m diameters at a distance of 3.0 m from the centerline of the bearing bed. The seat depth is 0.8 m and slab depth is 1.75 m. Figure 4 illustrates the dimensions of ledges of the joint with the position of the bearing bed. The bridge was designed according to AASHTO (1969) [16]. However, the analysis was carried out based on AASHTO [3] to demonstrate the consequences of the older designs and shortcomings with meeting existing bridge design specifications.
4. Results
4.1. Empirical Method Calculation
The calculations for the different failure mechanisms using the empirical method were conducted to determine the loadings and capacity of the bridge ledge. These calculations utilized the section geometry, a concrete strength of 27.5 MPa, and a steel reinforcement strength of 413 MPa. By applying these material properties and geometric parameters, the structural performance under various potential failure scenarios was assessed.
The empirical method involves evaluating multiple failure mechanisms (aforementioned) to identify the most critical one. Each mechanism's capacity was calculated based on empirical formulas implemented in AASHTO [3]. The lowest estimated strength among these failure mechanisms was considered as the governing capacity of the ledge, ensuring a conservative and safe design approach.
Table 1 provides a comprehensive summary of the capacities for each potential failure mechanism as determined by the empirical method [23]. This table allows for a clear comparison of the different capacities, highlighting the lowest of the estimated capacities for SHJ.
It is particularly noteworthy that, for the SHJ, the failure mechanism with the lowest estimated capacity was identified as punching shear. Punching shear is a localized failure mechanism that occurs when a concentrated load causes the load-bearing element to punch through the seat of the joint.
However, when using a physics-based model, a different failure mechanism was identified, as it will be described in section 6. The physics model, which considers a more detailed and realistic simulation of the structural behavior, revealed a different critical failure mode. This discrepancy highlights the differences in the assumptions and simplifications inherent in the two approaches. The empirical formulas derived from experimental data and historical performance, where the ABAQUS model utilizes advanced numerical methods, such as finite element analysis (FEA), to simulate the structural behavior under applied load. In addition, ABAQUS model may consider more complex interactions between materials, detailed stress distribution, and local effects that are not captured in the empirical method. This could lead to identifying a different critical failure mechanism, such as punching shear, shear fraction, or another mechanism.
Table 1. Capacity of joint 8SB using empirical method.
|
Failure mechanism |
Capacity (kN) |
|
Bearing |
2286 |
|
Shear Fraction (Crack 1) |
4826 |
|
Nominal Interface Shear (Crack 1) |
4492 |
|
Punching |
1993$ |
|
Hanger Reinforcement |
2998 |
$ Note: Controlling failure mechanism
4.2. Strut-and-Tie Method Calculation
The strut-and-tie method was carried out to determine the loadings and capacity on a typical 1.22m wide strip of the cantilever, corresponding to the width that governs the failure mechanisms using the empirical method, which approximately corresponds to the width of one box girder. The boundaries of the D-regions of the cantilever slab of the joint are determined based on Saint Venant's principle. The factored concentrated applied load that has been used for the empirical method is also used for the strut-and-tie method. For simplicity of analysis, the applied concentrated load on the bearing bed from the adjacent structure's girder has been divided into two applied loads. These represent the portions of the girder load carried by two two-dimensional strut-and-tie models, Model 1 and Model 2, shown in Figure 5 [7]. The dashed lines represent compressive struts, and the solid lines represent the tension tie. When the strut-and-tie method (STM) is used for the assessment, the layout and the orientation of the reinforcement govern the locations of the ties within the STM. The anchorage and the development length conditions of the reinforcement govern the location of the nodes. The ties were aligned with the layout of the reinforcement, and the width is twice the distance between the extreme tension fiber and the reinforcement bars’ centroid. The intersection of the vertical bar close to the edge with the centroid of the strut is determined to be the location of the Node C. Node E is determined as the intersection between Node F and Node A. Other ties and struts are connected to complete the stress flow with angles larger than 25 degrees, as required by AASHTO strut-and-tie method provision. In Figure 6, the validity of the STMs for the joint was checked using stress trajectories obtained from 3D nonlinear finite element analysis using ABAQUS software, which will be described later. Finally, the forces of the completed model are calculated using truss static analysis to compare with maximum capacities of the struts and ties. The forces acting on each of the boundaries of the D-region for the two models are equilibrated by the load path defined by the models. The struts, ties, and nodes have been labeled for references.
Tables 2 and 3 show the member forces for the struts and ties. The upper and lower chords resist the boundary bending moment with equal but opposite forces computed to satisfy the equilibrium. Once the forces in all components of STMs have been calculated, the individual members' permissible stresses must be validated and should not exceed the developed stresses due to applied load [4]. Using the equations described previously, the strength of the ledge has been determined. The concrete does not contain crack control reinforcement (grid reinforcement in both directions) that controls the width of cracks developing at the middle of the bottle-shape strut, subsequently resulting in a lower efficiency factor of 0.45 which was utilized according to AASHTO. In addition to controlling the width of cracks, the grid reinforcement helps to redistribute internal stresses as required, which, in turn, allows for the minimum ductility for the strut to be ensured.
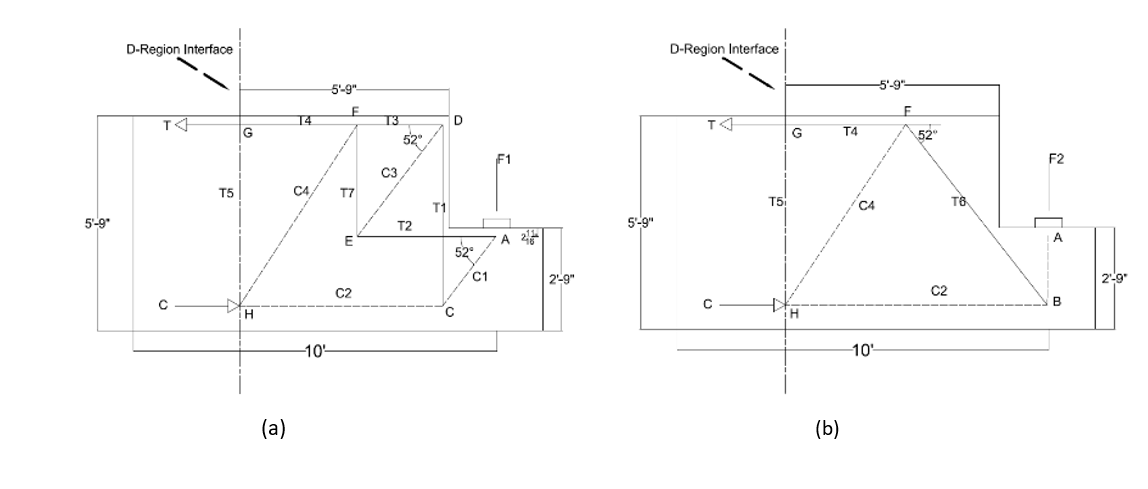
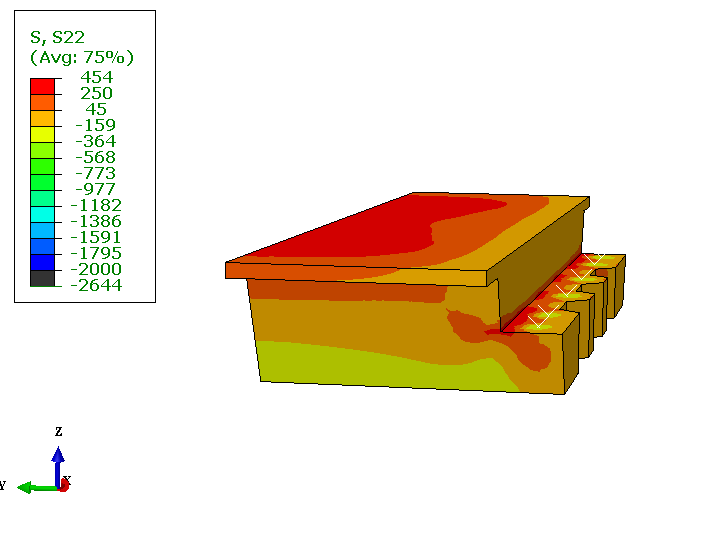
Table 2. Strut member forces.
|
Strut Member |
Model 1 (kN) |
Model 2 (kN) |
Total (kN) |
|
C1 |
583 |
0 |
583 |
|
C2 |
365 |
356 |
721 |
|
C3 |
560 |
0 |
560 |
|
C4 |
543 |
547 |
1090 |
Table 3. Tie member forces.
|
Tie Member |
Model 1 (kN) |
Model 2 (kN) |
Total (kN) |
|
T1 |
454 |
a |
454 |
|
T2 |
365 |
a |
365 |
|
T3 |
351 |
a |
351 |
|
T4 |
658 |
658 |
1316 |
|
T6 |
a |
578 |
578 |
|
T7 |
454 |
a |
454 |
a Note: Tie does not exist in the model.
4.3. Anchorage of Tie and Development Length
Although it was determined that the area of the U-shaped hanger bars, and the diagonal bars was sufficient, the anchorage details of this reinforcement need to be checked. The anchorage length of the #11 transverse bars needs to be checked at nodes A, E, and F in tension and node B and C in compression. Figure 7 shows the available development length for all nodes. According to AASHTO, the available length (lb) to be anchorage should be greater than the required development length specified in Equation 5.10.8.2.1c AASHTO LRFD (2020). Based on the chosen geometry of Node A, the available length is 0.508m. The basic required development length in tension is calculated to be 2.56 m. For Tie 2, the required amount of reinforcement surpasses the amount of reinforcement provided, and by applying the modification factors following the simple approach, the modified tension length is therefore calculated to be 0.21 m. There is enough development length supplied at Node A. Available length of the reinforcement that exits the extended nodal zone of Node E is checked and it was found to be adequate. For Node F, two checks for the development length are required for the straight and the 180-degree hooks. The straight development length for the Node F was less than what is required, so the capacity of the tie should be modified by 0.506 reduction factor. For the standard hooks that are used is 180-degree bend, check will be following ACI 318-14 and CRSI's Manual of Standard Practice (AASHTO). Regarding the standard hooks in tension, the development will be determined as the basic development length of a standard hook in tension. In the compression, hooks are not considered effective in developing bars [3, 11], subsequently, hooks in Node B and Node C, may not be effective in developing bars. The straight development length in compression in Node B and C were found to be adequate.
Table 4 provides a detailed explanation of how the controlling failure mechanism was determined based on the elements and nodes of the model. The analysis included several critical checks to ensure an accurate assessment of the bridge SHJ capacity and potential failure mechanism. The checks include:
- Bearing and Resistance Checks: The resistance of the node faces at both the slab and the ledge were evaluated. Each node face was analyzed for its ability to withstand the applied loads, considering the material properties and geometric configurations. These checks are crucial to ensure that the nodes can adequately transfer loads without experiencing excessive deformation or failure.
- Strength Verification of Model Ties: The strength of the ties in both models was thoroughly examined. Ties play a critical role in transferring tensile forces within the SHJ, and their adequacy is essential for maintaining overall stability. The assessment considered the material properties of the reinforcements and the specific load conditions they were subjected to in the model.
- Development Length: It was found that the development length at Node F was less than the required length. Due to the insufficient development length, it was necessary to reduce the capacity of the tie connected to Node F. This reduction directly influenced the overall capacity of the joint, making it a critical factor in the determination of the controlling failure mechanism.
In summary, Node F was identified as a critical point in the model due to the insufficient development length of the reinforcement. This insufficiency necessitated a reduction in the capacity of the corresponding tie, which led to a decrease in the overall joint capacity. The controlling failure mechanism was thus governed by the reduced capacity of the tie at Node F, highlighting the importance of ensuring adequate development lengths in design to prevent such limitations.
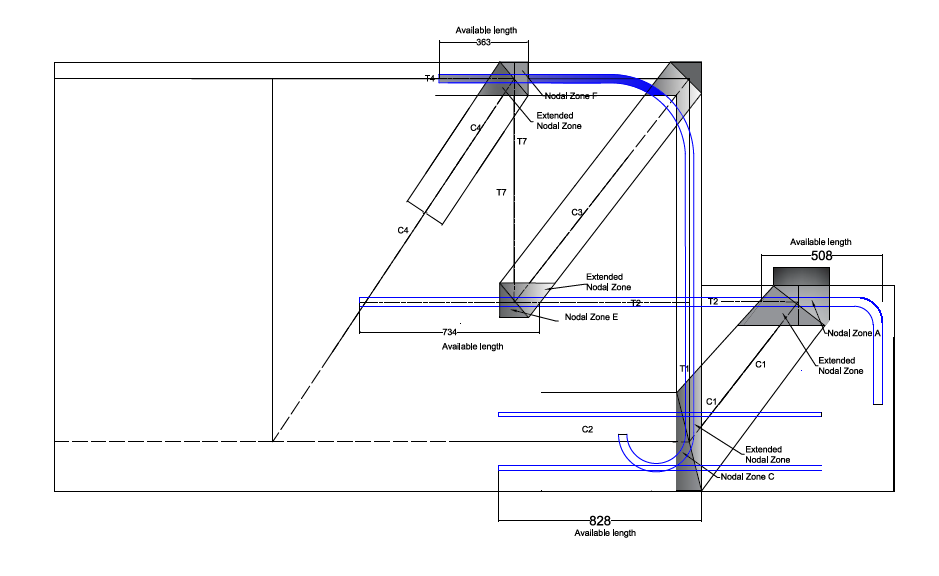
Table 4. Capacity of joint 8SB using AASHTO STM.
|
Failure mechanism |
Capacity (kN) |
|
Bearing |
4840 |
|
Resistance of the node face at the slab |
2148 |
|
Resistance of the node face at the ledge |
2909 |
|
Strength of Ties |
1517& |
& Note: Controlling failure mechanism
5. Nonlinear Finite Element Analysis Using Abaqus Software
To investigate the performance of the ledge beam, a nonlinear finite element using a commercial software ABAQUS has been used. The node type used to model the concrete is an eight-node solid 3D continuum element with incompatible modes and linear bricks (C3D8I); this element has three translational degrees of freedom at each corner node. The reinforcement bars are modeled using two, node linear, three-dimensional truss elements (T3D2). The rebars elements are embedded in the concrete using an ABAQUS constraint function called “Embedded Region”, which allows for a full bond between concrete and reinforcement. The embedment feature in ABAQUS allows both the embedded elements nodes (rebar) and host elements nodes (concrete) to have the same translational degrees of freedom. Because of the way the longitudinal column reinforcement is ended within the slab (i.e., straight bar anchorage), the columns are expected to behave as fixed supports, and the back face of the model is restraining from the movement in longitudinal direction to simulate the continuous of the span. The load is applied as displacement control on a reference point constraint to act as a rigid body with pinned node connections to simulate the bearing bed. The material behavior of the concrete follows the concrete damage plasticity model (CDP), which is suitable for both nonlinear compressive and tensile behavior [17]. The compressive behavior of the concrete is modeled using the modified Hognestad stress-strain formulation [18] as shown in Equation 3. The degradation of elastic stiffness is identified using two damage variables varying from zero to one for the full damage, dc for the compression damage and dt for the tension damage; dc and dt can be obtained using Equations 4 and 5, respectively.
As stated in Table 5, some properties to make a real simulation were defined from the literature for constructing the CDP model in ABAQUS, where Dilation angle is the angle of internal friction of the material, Fco/Fbo is the ratio of biaxial compressive strength to uniaxial compressive strength, K is the ratio of second stress invariant on the tensile meridian to that of the compressive meridian, and the viscosity parameter is the visco-plastic regularization of the concrete [17, 19-21]. The material behavior of the reinforcing steel is modeled as an elastic-perfectly plastic material hardening; considering the reinforcement in size and distribution in the SHJ. The average aspect ratio for the FE model was 1.25.
Table 5. Properties for constructing the CDP model in ABAQUS.
|
Dilation angle |
31° |
|
Eccentricity |
0.1 |
|
Fco /Fbo |
1.16 |
|
Kratio |
0.67 |
|
Viscosity parameter |
0.0001 |
5.1. Model Verification
In order to verify the proper usage of concrete and steel material types, embedment approach, and mesh size, two simple verification tests were used. The first verification test was performed by making a fixed-fixed support beam model of a reinforced concrete beam and subjecting it to a concentrated force at the middle using displacement control. The element types, material, and concrete-steel bond were identical to the SHJ model. The maximum load that the beam carries from the ABAQUS model was determined to be 142 kN, and from the hand calculation using the standard analytical technique was determined to be 135 kN. Comparing the two estimates of the maximum load capacity shows a 5% difference between the finite element and numerical methods. Based on this comparison, it is simple to argue that the ABAQUS model accurately captures the behavior of the beam, and that the comparable efforts to simulate the SHJ of the bridge should also result in accurate models.
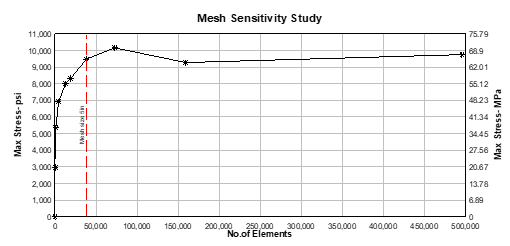
The mesh size selection in a finite element simulation affects both the cost and the accuracy of the calculations. An analysis of the mesh sensitivity was performed by developing a curve between the maximum obtained stress and the number of elements as shown in Figure 8. It can be observed from Figure 8 that the simulated maximum stress for the mesh size of 0.12 m are similar to those with a mesh size of less than 0.12 m. Accordingly, the mesh size of 0.12 m was used in the simulations.
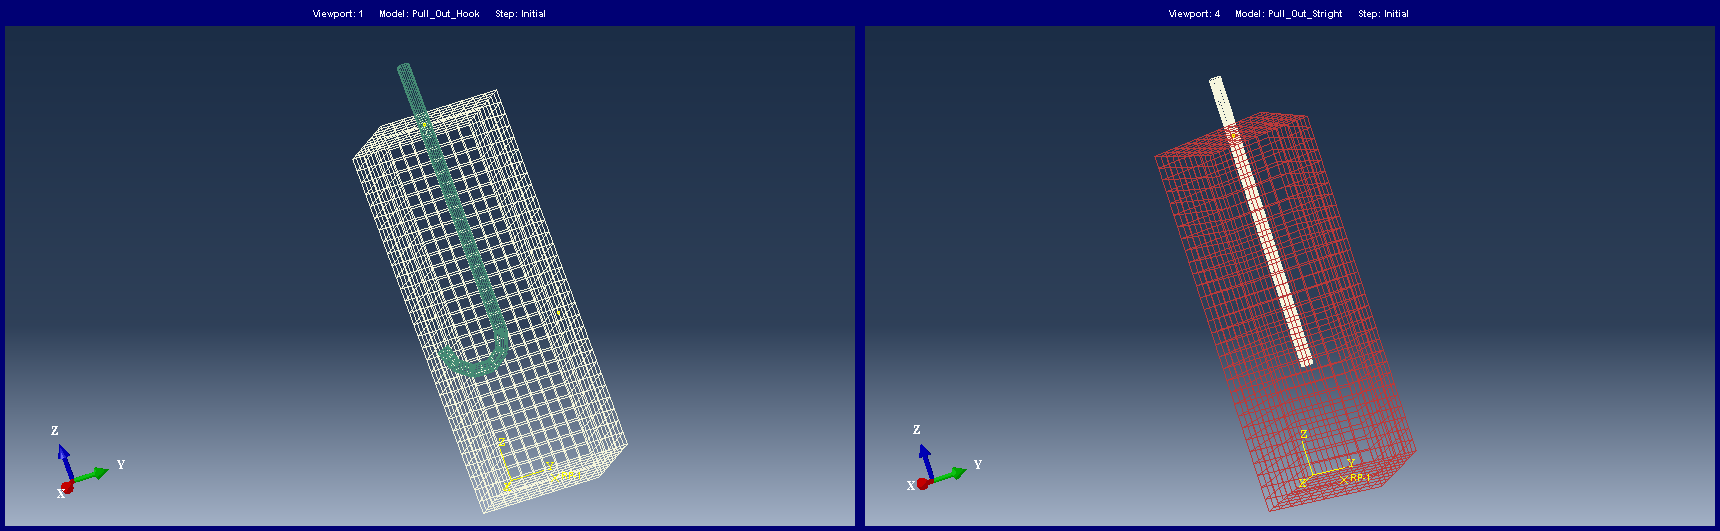
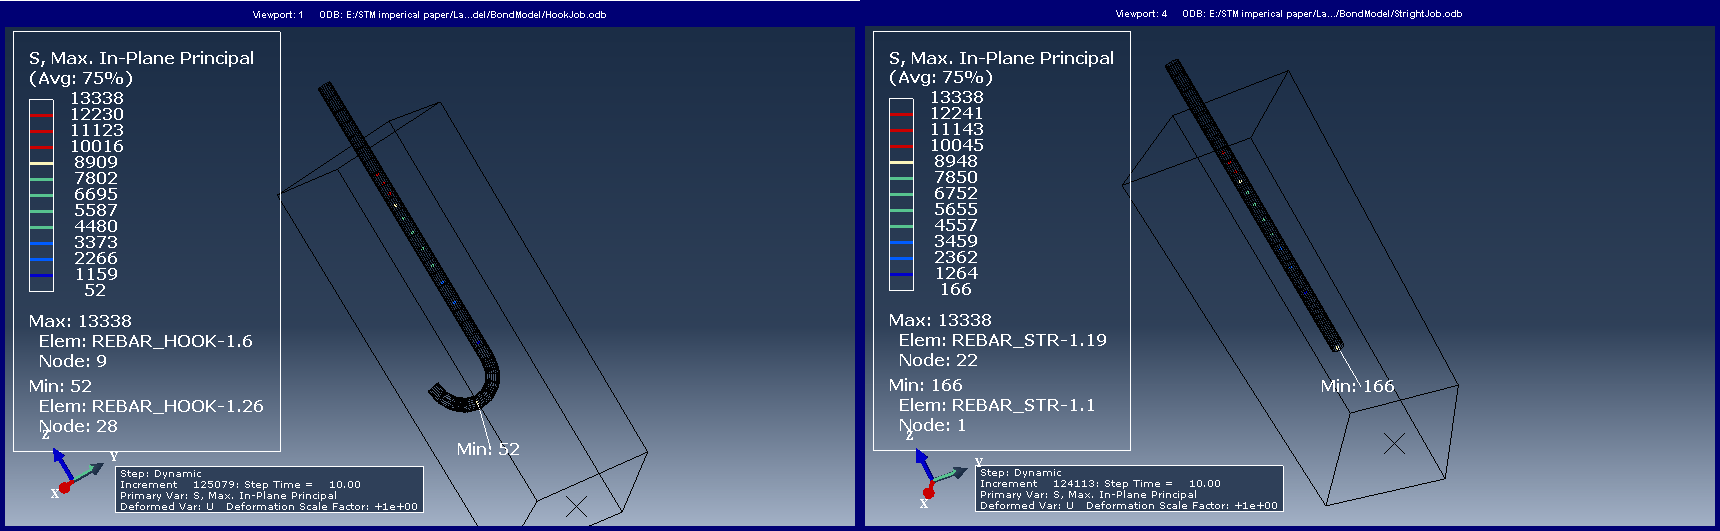
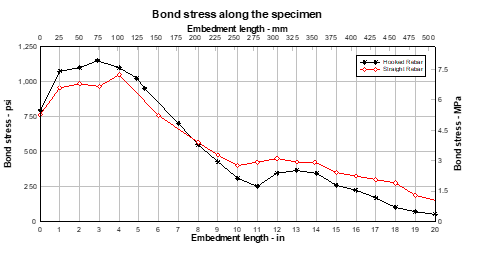
To study the simulation bond and failure between steel bar and concrete in ABAQUS, two numerical reinforced concrete models for the pull-out test were created using a nonlinear analysis. These models were created with headed rebar and hooked rebar subjected to an axial load, as shown in Figure 9. It can be seen that the force in the rebar decreases over its length towards the end of the rebar in the concrete cube (Figure 10), and the stress acting on the outer interface of steel to the surrounding concrete occurs gradually as it would be expected over a development length, rather than all at once at the embedded end of the rebar (Figure 11). In addition, the embedment length was equal for the headed and hooked rebar, since the required development length for the hooked rebar is less than what is required for the headed, resulting in the bond stress at the end of the hooked rebar being less than what came from the headed.
6. Nonlinear Analyses Results
First, girder loads were applied on the bearing bed (i.e. girder load that was used for the empirical and strut-and-tie analyses) to compare the stress trajectories with the two proposed STMs. Figure 6 presents the stress trajectories due to concentrated force of 907 kN at each bearing bed. Then, displacement load control was used to calculate the collapse load and find the capacity of the section, where the displacements increased with time at the locations of the bearing load until failure occurred. The failure load indicated from the finite element results is 3114 kN, while the maximum capacity from the empirical and strut and tie methods are 1993 kN and 1517 kN, respectively at the ledge. The failure mechanism is assumed by CDP to be either tensile cracks or compressive crushing, which are the dominant failure for the concrete under low confining pressure [22]. Since the SHJ location for the bridge is under low confining pressure, it will behave in a brittle manner and, as expected, the cracking under tension and crushing under compression were the main failure mechanisms. The concrete reached its maximum strength capacity before the bars reached their yield. The cracks initiated at the ledge to slab interface which indicated that shear friction failure was governed (Crack 1) and it was not governed by the yield stress of the reinforcement. Figure 12 shows the failure mechanism according to the FEA [23].
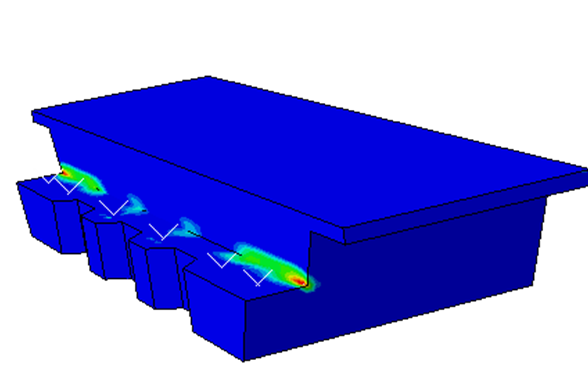
Since there is principal compressive stress due to the bearing bed loads and the principal tensile stress at the interface reaches the tensile strength of concrete, a crack is initiated parallel with the direction of the principal compressive stress, which was expected since the interface is considered to be the highest shear stress region (Figure 12). Diagonal failure or shear failure is the term for the sort of failure brought on by these cracks, which typically occurs in an extremely brittle and sudden manner [24]. In addition, SHJs were expected to experience diagonal tension failure which was the governing failure mechanism due to the limited number of stirrups. However, the SHJ has a sufficient longitudinal reinforcement ratio at the seat, which led to forming a compression zone. Therefore, shear cracks can start from previous flexural cracks with ease, but they cannot pass through the compression zone which is also the case in the FE model. Moreover, in the ABAQUS finite element model, the section force due to applied load at shear friction plane was approximately 2891 kN when the force section at the punching plane reached approximately 2002 kN (controlling failure mechanism using empirical method). This indicated that the controlling failure is not punching shear and no yielding at the reinforcement, where the hanger reinforcement only reached 16% of its yield strength at the failure.
Table 6 presents a comparison of the failure mechanisms determined by three different methods: the empirical method, the strut-and-tie method (STM), and finite element analysis (FEA). This comparison highlights the strengths and limitations of each approach in predicting the structural capacity and potential failure mechanisms. The failure load estimated by the empirical method was found to be lower than those predicted by both the strut-and-tie method and the finite element analysis. This conservative approach ensures safety but may not fully capture complex interactions within the structure. For the STM, the resistance of the node face controlled the capacity of the ledge at two critical points: Node E for the slab and Node A for the ledge. This method explicitly models the load paths and critical regions within the structure. The failure load predicted by the STM was closer to the results obtained from the FEA, suggesting a more accurate representation of the structural behavior compared to the empirical method. The failure load predicted by the FEA was higher than those estimated by both the empirical method and the STM. This method likely captures more nuanced aspects of the structural performance, leading to a higher estimated capacity.
In the STM, the capacity of the ledge was primarily controlled by the resistance of the node faces at Node E (for the slab) and Node A (for the ledge). These nodes are critical points where load transfer occurs, and their resistance significantly impacts the overall capacity. In addition, the estimated failure loads from the STM were closer to the FEA results, indicating that the STM provides a reasonably accurate representation of the structural behavior. However, both the empirical method and the STM predicted lower capacities compared to the FEA. The empirical method's conservative nature results in lower capacity estimates, providing a safety margin but potentially underestimating the actual structural capacity. The STM offers a more refined approach, while the FEA provides the most detailed and potentially accurate predictions.
In summary, the empirical method provides conservative estimates that ensure safety but may not capture complex structural interactions, while the strut-and-tie method offers a more detailed representation of load paths and critical regions, resulting in predictions closer to the FEA results. Finally, the finite element analysis might deliver the most detailed and accurate predictions by simulating the full complexity of the structural behavior. This comparison underscores the importance of using multiple methods to assess structural capacity and failure mechanisms. While the empirical method provides a quick and conservative estimate, the STM and FEA offer more detailed insights that can lead to a better understanding and optimization of structural performance.
Table 6. Comparative analysis using various methods.
|
Method |
Capacity (kN) |
Predicted failure mechanism |
|
Strut-and-tie method |
1517 |
Strength of Ties |
|
Empirical method |
1993 |
Punching Shear |
|
ABAQUS nonlinear analysis |
3114 |
Shear Friction |
7. Discussion
In this study, two design and evaluation methods, empirical and strut-and-tie, were compared to a physics-based ABAQUS model to characterize the predicted failure mechanisms. All the equations of the different failure mechanisms per the empirical method are explicitly stated in AASHTO (2020) to estimate the capacity of the seat of SHJ and are easier to use with a good level of confidence. In addition, experience related to predicting the stresses’ flow through the section when using strut and tie method is not required. On the other hand, the strut-and-tie method requires different steps that must be completed before starting the analysis. One example would be knowing the stresses’ trajectories, which requires engineering judgment and experience about the reinforcement concrete behavior to develop the truss model. In addition, the strut-and-tie method is an iteration method that can produce different results for different models. However, iterations can help in the optimization of the design and utilize the maximum section capacity. The hanger reinforcement for the empirical method must be added to the shear reinforcement required on the slab supported by the reactions, which might overestimate the reinforcement required. The strut-and-tie method can directly estimate the reinforcement required for transferring the compression load to the tension chord at the top of the slab and the reinforcement to resist shear stresses in the slab. As a result, the strut-and-tie method might suggest itself to be more economical than the empirical method.
Regarding the development length, it is required to be calculated and checked for both methods, however, in both methods the critical sections are different. For the empirical method, the first critical section is located at the interface of the shear transfer on both sides. The other critical section identified from the empirical method is determined by the punching shear failure, where the critical section is located around the bearing bed at a distance equal to the distance from top of ledge to compression reinforcement. For the strut-and-tie method, the development length can be determined based on the location of the nodal zone and the extended nodal zone. All ties are required to be properly anchored for all appropriate nodes of the truss model. Bearing capacity must be checked when using the strut-and-tie method and the empirical method.
8. Conclusions and Future Research Needs
Both the empirical design approach and the strut-and-tie were used to estimate the capacities of the SHJ. The numerical results were compared to the computational FE model using ABAQUS software to predict the failure mechanism. The following conclusions can be made based on the failure mechanisms and capacity estimations resulting from the comparison of the empirical method, strut-and-tie method, and FE analyses:
- Failure mechanisms:
- Analyses were conducted to evaluate the structural capacity of the SHJ and identify the controlling failure mechanism using different approaches: strut-and-tie method (STM), empirical method, and FE analysis. The failure mechanisms were identified based on the strength capacity of the ledge, and a comparison of results and their corresponding controlling failure mechanisms were as follows: strength of ties (strut-and-tie method), punching shear (empirical method), and shear friction (FE analysis).
- The governing failure mechanism was the punching shear mode for the empirical method and strength of the tension ties in the upper portion of the seated region from the strut-and-tie method (STM). Based on the FE analysis, strains indicating cracking of concrete were observed on the interface between the seat and the slab, which refers to the ledge failure mechanism, and called shear friction. Hence, shear friction failure is likely to be a governing ledge failure mechanism. For the bridge evaluated in this study, the prediction of the governing failure mechanism from the empirical method occurred at a lower strength capacity estimate (1993kN) than the results obtained from FE analysis (3114kN).
- As expected, the strut-and-tie method provided the lowest estimate of the strength capacity of the ledge (1517kN) due to the assumed yield strength of steel. The strut-and-tie method is a lower-bound design and based on lower bound theorem, which states that the structure will not collapse or will only be at the point of collapse if an equilibrium distribution of stress can be found that balances the applied load and is everywhere below yield or at yield.
- Strength capacity:
- From the strut-and-tie method, the strength capacity of the ledge was controlled by the strength of the hanger tie, which was identified as the controlling failure mechanism and not shear friction as observed in the FE analysis. Experimental testing can be conducted in the future to verify structural behavior and failure mechanisms predicted by the two methods and FE analysis.
- The section force due to applied load at the shear friction plane in the FE model was approximately 2891 kN, which was larger than the 1993 kN section force along the punching (shear) plane as predicted by the empirical method. Consequently, punching shear was not the governing failure mechanism revealed by the FE model.
- From the FE model, it was verified that the hanger reinforcement only reached 16% of its yield strength at failure and that the controlling failure was not due to yielding of the reinforcement.
- Comparing the strength capacity of the ledge from physics-based ABAQUS finite element (FE) model to the estimated capacity from the two methods revealed that the estimated strength capacity of the SHJs using the strut-and-tie method was less than both empirical and FE methods. This may suggest to practitioners and researchers that while requiring a bit more insight, there may be benefits to using the strut-and-tie method to provide efficient estimates (from a lower-bound solution perspective) when evaluating the existing structural capacity of SHJs. The results of the ABAQUS model indicate its performance under the given conditions, assumptions about material properties of concrete and steel, boundary conditions, and interaction modeling, including bond-slip behavior and their potential effects on the results.
- The identification of different failure mechanisms using different approaches underscores the importance of using multiple approaches to assess structural performance. The empirical method provides a quick and conservative estimate based on simplified assumptions, while the strut-and-tie method and physics model offers a more detailed and realistic analysis. By comparing the results from these methods, engineers can gain a comprehensive understanding of the structural behavior and ensure that all potential failure mechanisms are considered. However, the empirical method is useful for initial design and quick assessments but may not capture all detailed interactions and local effects. Both the strut-and-tie method and FEA provide deeper insights into structural behavior and can identify failure mechanisms that empirical methods might miss, but may require more computational resources and detailed input data.
References
[1] Abbasi, M. and M.A. Moustafa. The effect of in-span hinges on the seismic behavior of multiple-frame reinforced concrete box girder bridge. in Proceedings of the Istanbul Bridge Conference. 2016.
[2] Mitchell, D., Marchand, J., Croteau, P., and Cook, W., Concorde overpass collapse: structural aspects. Journal of performance of constructed facilities, 2011. 25(6): p. 545-553.
View Article
[3] AASHTO, AASHTO LRFD Bridge Design Specifications. 2020.
[4] Desnerck, P., J.M. Lees, and C.T. Morley, Strut-and-tie models for deteriorated reinforced concrete half-joints. Engineering Structures, 2018. 161: p. 41-54.
View Article
[5] Huang, P.-C., Dapped-end strengthening of precast prestressed concrete double tee beams with FRP composites. 2000.
[6] AASHTO, AASHTO LRFD bridge design specifications. 1994, American Association of State Highway and Transportation Officials: Washington, D.C.
[7] El-Metwally, S. and W.-F. Chen, Structural concrete: strut-and-tie models for unified design. 2017: CRC Press.
View Article
[8] Williams, C., D. Deschenes, and O. Bayrak, Strut-and-tie model design examples for bridges. 2012.
[9] Schlaich, J., K. Schäfer, and M. Jennewein, Toward a consistent design of structural concrete. PCI journal, 1987. 32(3): p. 74-150.
View Article
[10] 445.2., A.c., Strut-and-Tie Method Guidelines for ACI 318-19-Guide. 2021, American Concrete Institute: Farmington Hills, MI, USA.
[11] Committee, A. Building code requirements for structural concrete:(ACI 318-14) and commentary (ACI 318R-14). 2014. American Concrete Institute.
[12] Wight, J.K., Reinforced concrete: mechanics and design. (No Title), 2016.
[13] Li, H.-t., A.J. Deeks, and X.-z. Su, Experimental study on compressive bond anchorage properties of 500 MPa steel bars in concrete. Journal of Structural Engineering, 2013. 139(12): p. 04013005.
View Article
[14] Clark, L., IAN53 half-joint assessment advice-ULS assessment of halfjoints. Highways Agency, 2010.
[15] WADOT, Washington State Department of Transportation. 2005.
[16] AASHTO, AASHTO LRFD bridge design specifications. 1969, American Association of State Highway and Transportation Officials: Washington, D.C.
[17] Madandoust, R., M. Kazemi, and S. Yousefi Moghadam, Analytical study on tensile strength of concrete. Revista Romana de Materiale, 2017. 2(2).
[18] Hognestad, E., Study of combined bending and axial load in reinforced concrete members. University of Illinois. Engineering Experiment Station. Bulletin; no. 399, 1951.
[19] Barth, K.E. and H. Wu, Efficient nonlinear finite element modeling of slab on steel stringer bridges. Finite elements in analysis and design, 2006. 42(14-15): p. 1304-1313.
View Article
[20] Nguyen, H.T. and S.E. Kim, Finite element modeling of push-out tests for large stud shear connectors. Journal of Constructional Steel Research, 2009. 65(10-11): p. 1909-1920.
View Article
[21] Lee, J. and G.L. Fenves, Plastic-damage model for cyclic loading of concrete structures. Journal of engineering mechanics, 1998. 124(8): p. 892-900.
View Article
[22] Chaudhari, S. and M. Chakrabarti, Modeling of concrete for nonlinear analysis using finite element code ABAQUS. International Journal of Computer Applications, 2012. 44(7): p. 14-18.
View Article
[23] Obayes, S.K. and M. Head. Structural Evaluation of Ledges in Shiplap Hinge Joints. in Structures Congress 2023.
View Article
[24] Sharma, R., Review on shear behaviour of reinforced concrete beam without transverse reinforcement. Raju Int. J. Eng. Res. Appl, 2014. 4(4): p. 1-6.
[1] Abbasi, M. and M.A. Moustafa. The effect of in-span hinges on the seismic behavior of multiple-frame reinforced concrete box girder bridge. in Proceedings of the Istanbul Bridge Conference. 2016.
[2] Mitchell, D., Marchand, J., Croteau, P., and Cook, W., Concorde overpass collapse: structural aspects. Journal of performance of constructed facilities, 2011. 25(6): p. 545-553. View Article
[3] AASHTO, AASHTO LRFD Bridge Design Specifications. 2020.
[4] Desnerck, P., J.M. Lees, and C.T. Morley, Strut-and-tie models for deteriorated reinforced concrete half-joints. Engineering Structures, 2018. 161: p. 41-54. View Article
[5] Huang, P.-C., Dapped-end strengthening of precast prestressed concrete double tee beams with FRP composites. 2000.
[6] AASHTO, AASHTO LRFD bridge design specifications. 1994, American Association of State Highway and Transportation Officials: Washington, D.C.
[7] El-Metwally, S. and W.-F. Chen, Structural concrete: strut-and-tie models for unified design. 2017: CRC Press. View Article
[8] Williams, C., D. Deschenes, and O. Bayrak, Strut-and-tie model design examples for bridges. 2012.
[9] Schlaich, J., K. Schäfer, and M. Jennewein, Toward a consistent design of structural concrete. PCI journal, 1987. 32(3): p. 74-150. View Article
[10] 445.2., A.c., Strut-and-Tie Method Guidelines for ACI 318-19-Guide. 2021, American Concrete Institute: Farmington Hills, MI, USA.
[11] Committee, A. Building code requirements for structural concrete:(ACI 318-14) and commentary (ACI 318R-14). 2014. American Concrete Institute.
[12] Wight, J.K., Reinforced concrete: mechanics and design. (No Title), 2016.
[13] Li, H.-t., A.J. Deeks, and X.-z. Su, Experimental study on compressive bond anchorage properties of 500 MPa steel bars in concrete. Journal of Structural Engineering, 2013. 139(12): p. 04013005. View Article
[14] Clark, L., IAN53 half-joint assessment advice-ULS assessment of halfjoints. Highways Agency, 2010.
[15] WADOT, Washington State Department of Transportation. 2005.
[16] AASHTO, AASHTO LRFD bridge design specifications. 1969, American Association of State Highway and Transportation Officials: Washington, D.C.
[17] Madandoust, R., M. Kazemi, and S. Yousefi Moghadam, Analytical study on tensile strength of concrete. Revista Romana de Materiale, 2017. 2(2).
[18] Hognestad, E., Study of combined bending and axial load in reinforced concrete members. University of Illinois. Engineering Experiment Station. Bulletin; no. 399, 1951.
[19] Barth, K.E. and H. Wu, Efficient nonlinear finite element modeling of slab on steel stringer bridges. Finite elements in analysis and design, 2006. 42(14-15): p. 1304-1313. View Article
[20] Nguyen, H.T. and S.E. Kim, Finite element modeling of push-out tests for large stud shear connectors. Journal of Constructional Steel Research, 2009. 65(10-11): p. 1909-1920. View Article
[21] Lee, J. and G.L. Fenves, Plastic-damage model for cyclic loading of concrete structures. Journal of engineering mechanics, 1998. 124(8): p. 892-900. View Article
[22] Chaudhari, S. and M. Chakrabarti, Modeling of concrete for nonlinear analysis using finite element code ABAQUS. International Journal of Computer Applications, 2012. 44(7): p. 14-18. View Article
[23] Obayes, S.K. and M. Head. Structural Evaluation of Ledges in Shiplap Hinge Joints. in Structures Congress 2023. View Article
[24] Sharma, R., Review on shear behaviour of reinforced concrete beam without transverse reinforcement. Raju Int. J. Eng. Res. Appl, 2014. 4(4): p. 1-6.