International Journal of Civil Infrastructure (IJCI)
ISSN: 2563-8084

Volume 8 - Year 2025- Pages 18-27
DOI: 10.11159/ijci.2025.003
Assessment of Traffic Noise Level: A Case Study of a Residential Neighbourhood
Jamal Almatawah 1, Hamad Matar2
1,2 Collage of Technological Studies-Civil Engineering Department /PAAET
1,2 Block 1- Jamal Abdul Nasser Street, Shuwaikh Educational, Kuwait 70001
ja.almatawah@paaet.edu.kw; hb.matar@paaet.edu.kw
Abstract - The World Health Organization (WHO) has classified ambient noise as hazardous pollution that has negative psychological and physiological consequences on human health. Motorized vehicles are a major cause of noise pollution. It is a global phenomenon that has developed to become a major source of concern for the general public and governments alike. The purpose of this research is to look at traffic noise levels during peak and off-peak hours, as well as contributing elements like traffic volume, heavy-vehicle speed, and meteorological parameters like temperature, humidity, and wind speed, in a specific residential neighbourhood in Kuwait. This study focused on three types of roadways: expressways, main arterial routes, and collector streets. Other causes of noise were also investigated. All measurements were taken simultaneously. The findings revealed that traffic noise levels on all the identified types of roads exceeded the permitted limit. The average equivalent noise levels (LAeq) on the expressway, major arterial road, and collector street were 74.2 dB(A), 70.47 dB(A), and 60.84 dB(A), respectively. Furthermore, a positive correlation coefficient was found between traffic noise and traffic volume, as well as traffic noise and the 85th percentile speed. However, there was no significant relationship in metrological parameters. Abnormal vehicle noise caused by inadequate maintenance or user-enhanced exhaust noise was identified as one of the most significant variables influencing total traffic noise measurements.
Keywords: Traffic noise, Kuwait, Noise pollution, Environmental noise.
© Copyright 2025 Authors - This is an Open Access article published under the Creative Commons Attribution License terms. Unrestricted use, distribution, and reproduction in any medium are permitted, provided the original work is properly cited.
Date Received: 2024-05-21
Date Revised: 2024-12-22
Date Accepted: 2025-02-10
Date Published: 2025-03-03
1. Introduction
Traffic noise pollution is becoming a global issue in most cities, causing tremendous concern among both the general public and cities in developed and developing countries [1 - 2]. The World Health Organization (WHO) has classified ambient noise as hazardous pollution that has a negative psychological and physiological impact on human health [3]. Traffic noise pollution is widespread, and in recent decades, it has risen to the point where it has become a serious worry for the public and legislators [4 - 5]. Several studies and investigations have been conducted to measure the influence of transportation on noise levels [6- 9]. Airports are also known to be a major source of noise pollution, and the effect of airport noise on health and the environment has become a concern [10 - 13].
In recent decades, the industrialized world has explored road and air traffic noise, as well as potential solutions and laws that might be used to minimize noise levels in cities [14 - 16]. However, there has been little study in this field in poor nations [17 - 19]. Kuwait is a growing country that has seen tremendous growth in not just its socioeconomic aspects, but also in the number of automobiles and road networks, both of which have led to increased noise levels in Kuwait [20]. Although necessary, the expansion of roadways has contributed to the country's perceived noise levels, and traffic noise remains one of the most pressing issues in Kuwait [21 - 22].
Traffic noise is becoming an increasingly serious problem as the urban environment expands and develops, as traffic levels increase [23]. While there is presently no limit to the amount of noise that may be emitted by an existing highway, it is common for designers to offset the impact of the increased noise when new routes are built. Within the UK, if the increase in noise exceeds specific limitations, the Department of Transport may give compensation and insulation to the property owner [24]. The level of change in noise is based on site-specific criteria, with each development being analyzed individually to determine if the described criteria have been met to justify remediation of the issue.
To lessen the impact of traffic noise, a variety of interventions can be used to meet the objectives of the relevant stakeholders [25 - 27]. Currently, airplane noise is not considered a statutory nuisance in the United Kingdom, and local governments lack the legal authority to act on it [28]. To restrict the degree of noise created by aviation, the International Civil Aviation Organization (ICAO) has established norms and guidelines to limit noise from civil air transport aircraft [29 - 30]. These criteria are in place in over 180 nations, including the whole EU, and all airplanes must pass inspections to ensure that they meet these standards. The application of these guidelines resulted in a maximum 75% reduction in noise levels [31]. In 2001, all ICAO member nations agreed to a four-step program to mitigate the effects of aviation traffic noise [32]. These methods included minimizing noise at the source, managing land use surrounding airports to ensure that unsuitable projects are not permitted, and implementing noise abatement operating procedures to assist decrease aircraft annoyance. Also included were operational limits to limit aircraft access to airports, such as nighttime flying restrictions and the gradual withdrawal of noisier aircraft. In the United Kingdom, certain airports run schemes that pay grants to homeowners who live in regions with the greatest noise levels to install additional noise-mitigating insulation in their houses. This effort is reliant on the relevant airport if one exists, and the criteria under which people must comply to get grant help.
Furthermore, traffic management plans are adopted to reduce road traffic noise by prohibiting heavy vehicles from accessing particular regions at certain times of day, as well as pedestrian zones [33]. However, such a step should be carefully considered to ensure that it does not affect the local economy. In addition to these steps, the prevalence of alternative fuel cars has increased worldwide. In many cases, these cars have reduced engine sizes, which reduces total traffic noise. As these cars evolve and gain popularity, there is a good chance that total traffic noise levels will decrease.
2. Objectives
- Investigate traffic noise levels and the elements influencing them, such as traffic volume, heavy vehicle speed, and other metrological issues.
- Check the traffic noise to ensure it is under the permissible limit.
- Reduce the knowledge gaps and limitations in prior research to have a better understanding of exposure to the urban population in Kuwait
3. location
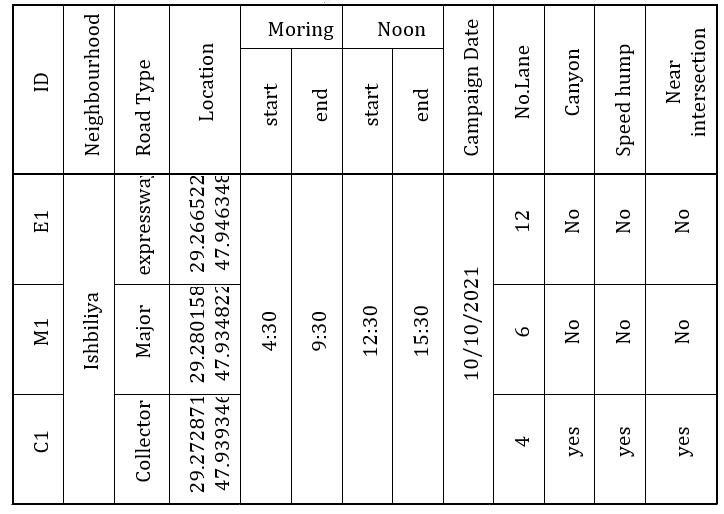
In this study, the site chosen to test for road traffic noise pollution in an urban setting was Ishbiliya, a residential area. The neighbourhood is located near Kuwait International Airport and has a variety of roadways. Table 1 shows three road types that were selected and monitored simultaneously: an expressway, a major arterial route, and a collector street. The 12-lane expressway has a speed restriction of 120 km/hr. The major arterial route has six lanes with a speed restriction of 80 km/hr. The four-lane collector roadway is near a roundabout with a speed hump in both directions, and the speed limit is 45 km/hr. Also, it is in a shallow street canyon, approximately parallel to the prevailing wind. The monitoring operation was carried out on the 10th of October 2021.
4.Material and Methods
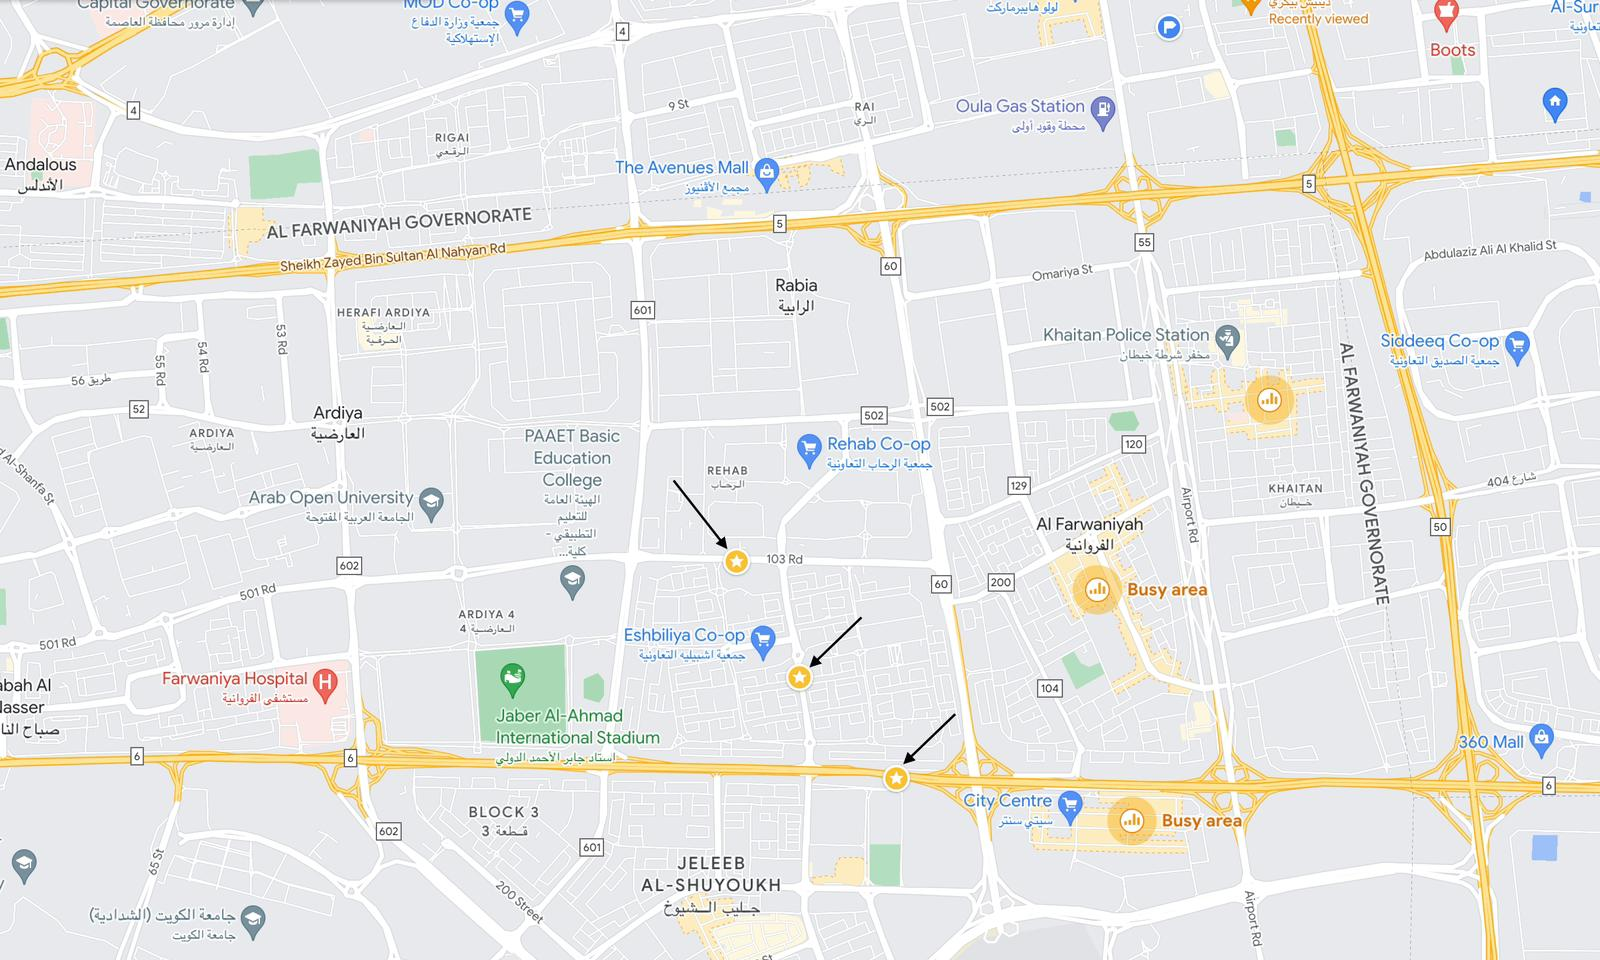
The monitoring was carried out by obtaining measurements at a set site near the collector street, the major road, and the expressway all at once shown in Figure 1. The monitoring activities were conducted to indicate the impacts of road traffic noise pollution.
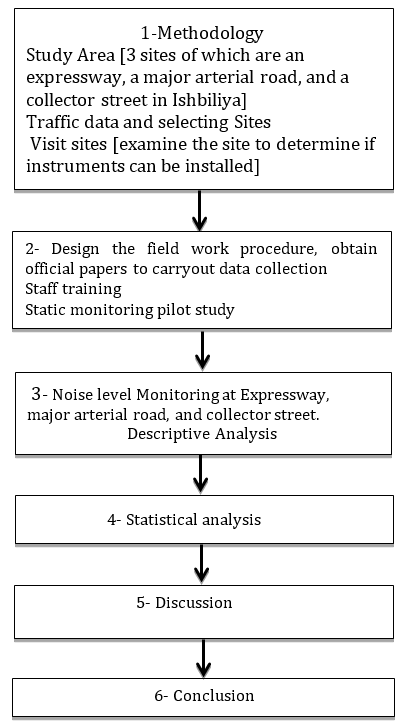
Figure 2 illustrates the technique, which involves many steps at selected sites. It focuses on outdoor noise levels and the events that affect them. The first stage entailed deciding on a research area and developing a data-gathering protocol. The investigation was conducted using statistical software (SPSS-27) to identify the key parameters impacting noise levels. A descriptive statistical analysis was carried out with other analyses.
4.1. Equipment
The monitoring instruments were chosen based on reliability and precision. The Bruel & Kjaer outdoor sound level meter 2250-L was the primary instrument utilized in this investigation to assess noise levels. Given the limited budget, this instrument was chosen for its accuracy and longevity. The Bruel & Kjaer outdoor sound level meter 2250-L is a compact and user-friendly instrument that detects noise levels ranging from 21.5 dBA to 140.8 dBA [34]. The Spack Solutions Countcam 2 camera was utilized to film road traffic [35], which was then analyzed for the road traffic count. The Decatur Genesis GHD-KPH from Decatur Electronics was used to randomly monitor vehicle speed at each site. The selected equipment has a speed detection range of 20 to 337 km/h [36]. The Ambient Weather WM-5 Handheld Weather Meter was used to record windspeed, temperature, and relative humidity [37].
4.2. Data Handling and Analysis
All logged data was downloaded using the appropriate program. The data were presented in Microsoft Excel format and merged into a master file with time as a benchmarking variable. All data were recorded at one-minute intervals. The noise levels were shown over time. The distribution of noise levels across all sites was determined using a 1-minute period and a 1 dB(A) bin. The noise level distribution for each trial was determined at 1 dB(A) at 1-minute intervals and recorded in a separate CSV file. Descriptive analysis was performed on this data using Excel and SPSS-27 software programs. The Pearson correlation coefficient was then calculated. The value of the Pearson correlation coefficient was then computed. The multiple regression method was carried out to find significant predictors of traffic noise. The significant variables were selected to have a 95% level of significance, and the p-value used was < 0.05.
5. Results
5.1. Traffic Noise
The noise levels dB(A) of the first campaign were measured simultaneously for the three different road types. The monitoring campaign consisted of data collected from three microenvironments within a residential neighbourhood during three periods in a single day. The three microenvironments were an expressway, a major road, and a collector street located within the Ishbiliya residential neighbourhood. The descriptive statistics are presented in Table 2. Total noise levels varied between 51.4 and 84.4 dB(A). The means and medians of this campaign ranged from 56.6 to 75.1 dB(A) and 63.9 to 75.1 dB(A), respectively. However, the noise range levels at the major road and the collector street were slightly greater than the levels at the expressway.

The mean traffic noise levels during the morning off-peak, morning-peak, and afternoon-peak periods at the expressway, the major road, and the collector street were recorded as (73.7, 75.1, 74.1), (65.8, 72, 73.6), and (56.6, 61.6, 64.3) dB(A), respectively. The traffic noise levels varied between 66.4 to 76 dB(A), 73.3 to 78.3, and 71.3 to 77.5 during the morning off-peak, morning-peak, and afternoon-peak periods at the expressway, respectively. The variation of traffic noise levels at the major road during the off-peak, morning-peak, and afternoon-peak periods were 56.8 to 71.2, 63.2 to 77.1, and 68.5 to 84.5 dB(A), respectively. During the morning off-peak, morning peak, and afternoon-peak periods, the range of traffic noise levels varied between 51.4 to 62.4, 55 to 72.3, and 59.6 to 78.1 dB(A) at collector street, respectively. At the expressway, the mean traffic noise levels were greater than the mean for the major road and the collector street in all three periods.
The first stage was to identify the event of noise instances during the first campaign to begin to understand the temporal variation of measured noise concerning activities such as abnormal vehicle noise. Poor maintenance or user-enhanced exhaust noise could be the cause of the abnormal vehicle noise. Table 5 presents the traffic noise and other sources of noise for the expressway, the major road, and the collector street. The abnormal vehicle noise, airplane, and police siren events are associated with high traffic noise levels on the expressway with values exceeding 75 dB(A). Also, the abnormal vehicle noise event exceeds 75 dB(A) on the major road. Indeed, the high traffic noise levels occurred during a mosque audio event that reached 75.967 dB(A) on the collector street due to the instrument being located less than 40 m from the mosque. Most of the abnormal vehicle noise events are associated with high traffic noise events at the expressway and major road. It was established that some of the spikes in traffic noise levels are associated with specific activity events.
Table 5 illustrates several high noise levels that exceeded 75 dB(A) and were caused by abnormal vehicle noise, airplane, and police siren events. Moreover, other high noise levels that took place were associated with a specific event and caused by a mosque audio event. High noise events that occurred at the three sites were higher than the noise generated by only vehicular traffic. At the collector street, there was an increase in noise level which was linked to a mosque audio event. Also, nearby construction noise was identified which caused an increase in noise levels reaching 74.2 dB(A) at the major road.
The location of the three sites is shown in Figure 1. Table 2 presents a summary of the traffic noise levels at the three sites during the monitoring campaign. The three duration averages of the noise levels at the monitoring sites can be compared with the noise limit regulations stipulated in the State of Kuwait.
The results show that the traffic noise level was over the allowable limit at the expressway (min 66.4 dB(A), max 78.3 dB(A). The average noise level (average LAeq) at off-peak hours was 73.7 dB(A), 75.1 dB(A) for the morning peak, and 74.1 dB(A) for the afternoon peak. The maximum allowable limit for external noise is 55 dB(A) for daytime and 60-62 dB(A) for evenings (Table 3). There is no significant difference in peak and off-peak hours, although the volume of traffic was less in the off-peak hours. This is due to the abundance of vehicles at off-peak hours, or in our case, at 5:00 to 6:30 AM. The quantity of heavy vehicles at off-peak hours is due to local laws not allowing heavy trucks to use the expressway during peak hours.
The results show that the traffic noise levels are over the allowable limit at the major road (min 56.8 dB(A), max 84.5 dB(A)) with the average noise level at off-peak hours at 65.8 dB(A) and 72 dB(A) for the morning peak, 73.6, dB(A) during the afternoon peak hours. It appeared from the results that there is no significant difference between the peak and off-peak hours, although they are all over the allowable limit.
The results show that the traffic noise level is also over the allowable limit in the collector street (min 51.4 dB(A) max 78.1 dB(A)). The average noise level at off-peak hours was 56.7 dB(A) (only 1.7 dB(A) more than allowable limits), 61.6 dB(A) for the morning peak, and 64.3 dB(A) for the afternoon peak hours.
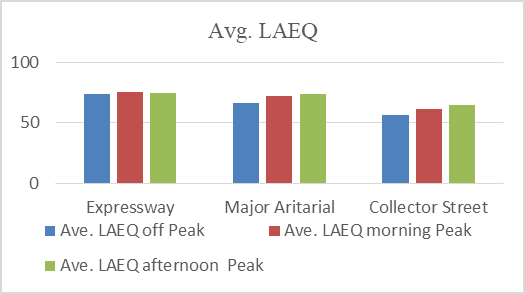
It was noted that the traffic noise level in the expressway is higher than the major road, and the major road is higher than the collector street (see Figure 3). Also, there was more traffic volume associated with a higher traffic noise level, which shows a positive correlation. Similar findings have been reported in studies from other regions, emphasizing the impact of heavy vehicles on urban noise levels [38]
Table 3: Type of the maximum allowable limit for external noise [39]
|
Type of area exposed to external noise |
Maximum Noise Level LAeq dB(A) |
||
|
Day time |
Evening Time |
Nighttime |
|
|
Typical Residential Areas |
55 |
55 |
50 |
|
Urban Residential Areas |
55 |
60 |
62 |
|
Residential areas with commercial activities |
65 |
56 |
55 |
|
Industrial and commercial areas |
70 |
70 |
65 |
5.2 Correlation analysis
A positive correlation coefficient was found, showing higher traffic volume associated with higher average traffic noise levels. The Pearson correlation coefficients are (r=0.346; p< 0.01), (r=0.632; p< 0.01), and (r=0.685; p< 0.01), for the expressway, major arterial road, and collector street, respectively. It was noted that the correlation coefficient between the traffic noise and traffic volume is much stronger in the major arterial road and collector street than the correlation coefficient for the expressway.
The road width on the expressway, consisting of six lanes in each direction, the combination of noise sources, the variety of vehicles, and varying speeds on these roads may be reasons why the relationship between noise levels on the expressway and traffic volume is weaker compared to the major road and the collector street. Additionally, intermittent stops due to traffic congestion on the expressway could affect the relationship between noise levels and traffic volume. Abnormal vehicle noise from poor maintenance or user-enhanced exhaust systems occasionally occurs on the expressway at low traffic volumes, which also affects the relationship between traffic noise readings and traffic volume. Moreover, higher traffic volumes on the expressway can lead to stop-and-go conditions (near-zero speed), which, in turn, can reduce traffic noise readings.
5.2.1 Traffic noise and spot speed (85th percentile) and the standard deviation of the spot speed
A positive correlation coefficient was found with a higher 85th percentile of speed associated with higher average traffic noise levels. The Pearson correlation coefficient is (r=0.903; p< 0.01). It should be taken into consideration that the variation in speed could cause more traffic noise due to throttling (or sudden acceleration and deceleration of vehicles). Speed acceleration and deceleration contributed to noise consistent with global studies highlighting traffic flow dynamics as key noise determinants [21- 27]. Thus, the results showed that a higher standard deviation in speed was associated with higher average traffic noise levels (r=0.926; p< 0.01) as shown in Table 4.
In some cases, higher speeds indicate less traffic congestion, leading to reduced noise levels compared to lower speeds with higher traffic volumes. Additionally, speed variation often reflects unstable traffic flow, which can result from driver behaviour, such as failing to adhere to speed limits or engaging in illegal overtaking. Similar findings have been reported in urban noise studies, where speed variability due to driver behavior significantly influenced noise levels [40].
Table 4: Spot speed study
|
Date |
Time |
number of minutes |
number of speed shots |
S.D. |
mean s peed |
85th Speed |
mean LAEQ |
total traffic |
Traffic per minute |
Heavy vehicle % |
|
Expressway |
Morning |
|
||||||||
|
10/10/2021 |
5:09 - 6:29 |
81 |
567 |
18.2 |
89.13 |
108.64 |
74.84 |
17027 |
210.21 |
26.19 |
|
10/10/2021 |
6:30 - 7:26 |
57 |
410 |
17.067 |
91.11 |
109.86 |
75.18 |
18895 |
331.49 |
14.41 |
|
10/10/2021 |
7:35- 9:06 |
67 |
469 |
17.029 |
89.86 |
107.87 |
75.02 |
20064 |
299.46 |
14.29 |
|
Expressway |
Afternoon |
|||||||||
|
10/10/2021 |
1:01- 2:00 |
60 |
420 |
17.64 |
82.76 |
100.75 |
74.31 |
22238 |
353.70 |
11.48 |
|
10/10/2021 |
2:01- 3:08 |
68 |
477 |
15.17 |
82.71 |
97.30 |
73.82 |
23102 |
334.81 |
16.06 |
|
Major Arterial |
Morning |
|||||||||
|
10/10/2021 |
5:00-6:29 |
90 |
343 |
10.851 |
51.63 |
63.11 |
66.67 |
781 |
8.68 |
12.38 |
|
10/10/2021 |
6:30-7:59 |
90 |
521 |
16.604 |
59.72 |
74.20 |
73.52 |
4192 |
46.58 |
2.88 |
|
10/10/2021 |
8:00-9:08 |
69 |
369 |
15.974 |
57.3 |
73.96 |
71.05 |
1850 |
26.81 |
3.85 |
|
Major Arterial |
Afternoon |
|||||||||
|
10/10/2021 |
12:50-1:49 |
60 |
335 |
12.781 |
58.42 |
70.53 |
73.87 |
3088 |
51.47 |
3.32 |
|
10/10/2021 |
1:50-3:15 |
86 |
525 |
11.814 |
60.63 |
72.30 |
73.21 |
3510 |
40.81 |
4.26 |
|
Collector Street |
Morning |
|||||||||
|
10/10/2021 |
5:00-6:29 |
90 |
329 |
4.28 |
27.39 |
31.54 |
57.21 |
360 |
4.00 |
3.58 |
|
10/10/2021 |
6:30-7:59 |
88 |
630 |
4.255 |
28.7 |
32.66 |
62.28 |
1641 |
18.65 |
2.62 |
|
10/10/2021 |
8:00-9:09 |
70 |
484 |
4.23 |
28.84 |
30.68 |
62.18 |
933 |
13.33 |
4.61 |
|
Collector Street |
Afternoon |
|||||||||
|
10/10/2021 |
1:01-2:00 |
60 |
420 |
4.824 |
28.43 |
32.79 |
64.35 |
1343 |
22.38 |
4.54 |
|
10/10/2021 |
2:01-3:11 |
71 |
490 |
5.394 |
28.4 |
33.65 |
64 |
1269 |
17.87 |
3.39 |
Table 5: Activities events with noise instant in Ishbiliya
|
Road Type |
Number of Events |
Type of Noise (Activities) |
Ave. LAEQ |
Total Number of Events |
|
Expressway |
189 |
Traffic only |
74.376 |
411 |
|
67 |
Abnormal vehicle noise |
75.035 |
||
|
140 |
Horn |
74.672 |
||
|
10 |
Airplane |
75.18 |
||
|
5 |
Police siren |
75.08 |
||
|
Major |
244 |
Traffic only |
70.434 |
416
|
|
114 |
Abnormal vehicle noise |
75.732 |
||
|
10 |
Horn |
74.37 |
||
|
6 |
Airplane |
73.783 |
||
|
26 |
Construction work |
74.192 |
||
|
16 |
Throttle/acceleration |
74.975 |
||
|
0 |
Police siren |
NA |
||
|
Collector |
248 |
Traffic only |
60.688 |
391 |
|
40 |
Abnormal vehicle noise |
62.59 |
||
|
36 |
Horn |
62.868 |
||
|
20 |
Airplane |
65.186 |
||
|
0 |
construction work |
NA |
||
|
0 |
Police patrol |
NA |
||
|
3 |
Mosque audio |
75.967 |
||
|
44 |
Throttle/acceleration |
63.567 |
5.3 The effect of other sources of noise on the traffic noise level readings
Many other sources of noise were recognized to affect the noise level readings. Some of these sources are part of traffic noise, such as throttle/acceleration, abnormal vehicle noise due to poor maintenance, user-enhanced exhaust noise, police/ambulance/fire truck sirens, and horn noise. These noise levels were measured per minute in addition to traffic volume. The frequency of these noise sources was dependent on the location selected and the type of road.
Other sources of noise not due to traffic, such as airplane noise, construction work, mosque audio, and audible voices of people, were also monitored. However, the frequency of these other sources was not significant. These factors were discovered during the first trial for the three selected locations in this study.
Table 5 shows that in the Ishbiliya expressway, the average abnormal vehicle noise due to poor maintenance or user-enhanced exhaust noise caused the highest noise level ((Laeq)=75.035) when airplane noise and police sirens were excluded but were not much different than normal traffic ((LAeq)= 74.376 dB(A)). However, on the major road, the difference was almost 5 dB(A), (LAeq)= 75.732 dB(A) for abnormal vehicle noise, and (LAeq)= 70.434 dB(A) for normal traffic. At the Ishbiliya collector road, the highest abnormal noise came from throttle/acceleration noise. Unexpected construction work was identified at the Ishbiliya major road, causing a rise in noise level to almost 74.2 dB(A).
6. Discussion
The results indicate that traffic noise exceeds the permitted levels, particularly on the expressway as shown in Table 3. The overall correlation study reveals a positive link between traffic volume and traffic noise levels. Interestingly, there is no substantial difference in noise levels between peak and off-peak hours, despite lower traffic volumes during the latter. This can be attributed to the presence of heavy trucks on the expressway during off-peak hours, specifically between 5:00 and 6:30 AM as indicated in Table 4. During peak afternoon hours, increased traffic volume resulted in stop-and-go traffic, which lowered traffic noise levels as shown in Table 4. Additionally, aberrant vehicle noise, caused by inadequate maintenance or user-enhanced exhaust noise, was observed in low traffic volumes. A positive relationship was also found between traffic noise and the 85th percentile speed.
Variations in speed may generate additional traffic noise due to rapid acceleration and deceleration of vehicles. Speed fluctuations indicate unstable traffic flow, often resulting from driver behavior such as failing to adhere to speed limits or engaging in unlawful overtaking.
Regarding meteorological parameters, the findings show no substantial association between traffic noise and temperature, humidity, or wind speed. However, various additional noise sources, such as sirens from emergency vehicles, horn sounds, throttling/ acceleration, and construction activities, contribute to higher overall traffic noise levels. The most common noise source was aberrant vehicle noise due to inadequate maintenance or user-enhanced exhaust noise.
7. Conclusion
In summary, the study highlights that traffic noise levels are significantly influenced by traffic volume, vehicle maintenance, and driver behavior. The presence of heavy trucks during off-peak hours and stop-and-go traffic during peak hours are notable contributors to traffic noise variations. While meteorological parameters do not show a substantial association with traffic noise, additional noise sources such as emergency vehicle sirens and construction activities play a role in elevating overall noise levels. Addressing vehicle maintenance issues and implementing measures to manage traffic flow and construction activities could help mitigate traffic noise levels.
Acknowledgment
This work is supported by the Public Authority for Applied Education and Training, Kuwait (Grant No. TS-16-03)
References
[1] L. T. Silva and J. F. G. Mendes, 'City Noise-Air: An environmental quality index for cities', Sustain Cities Soc, vol. 4, pp. 1-11, 2012, doi: https://doi.org/10.1016/j.scs.2012.03.001.
View Article
[2] A.-M. O. Mohamed, E. K. Paleologos, and F. M. Howari, 'Chapter 19 - Noise pollution and its impact on human health and the environment', in Pollution Assessment for Sustainable Practices in Applied Sciences and Engineering, A.-M. O. Mohamed, E. K. Paleologos, and F. M. Howari, Eds., Butterworth-Heinemann, 2021, pp. 975-1026. doi: https://doi.org/10.1016/B978-0-12-809582-9.00019-0.
View Article
[3] B. Berglund, T. Lindvall, and D. H. Schwela, 'New Who Guidelines for Community Noise', Noise & Vibration Worldwide, vol. 31, no. 4, pp. 24-29, Apr. 2000, doi: 10.1260/0957456001497535.
View Article
[4] L. Goines and L. Hagler, 'Noise pollution: a modem plague', South Med J, vol. 100, no. 3, pp. 287-294, 2007.
View Article
[5] R. T. Buxton et al., 'Noise pollution is pervasive in U.S. protected areas', Science (1979), vol. 356, no. 6337, pp. 531-533, May 2017, doi: 10.1126/science.aah4783.
View Article
[6] C. Iglesias-Merchan, R. Laborda-Somolinos, S. González-Ávila, and R. Elena-Rosselló, 'Spatio-temporal changes of road traffic noise pollution at ecoregional scale', Environmental Pollution, vol. 286, p. 117291, 2021, doi: https://doi.org/10.1016/j.envpol.2021.117291.
View Article
[7] S. K. Tiwari, L. A. Kumaraswamidhas, and N. Garg, 'Strategies and Implications of Noise Pollution Monitoring, Modelling, and Mitigation in Urban Cities', in Handbook of Metrology and Applications, D. K. Aswal, S. Yadav, T. Takatsuji, P. Rachakonda, and H. Kumar, Eds., Singapore: Springer Nature Singapore, 2023, pp. 1571-1593. doi: 10.1007/978-981-99-2074-7_86.
View Article
[8] J. M. B. Morillas, G. R. Gozalo, D. M. González, P. A. Moraga, and R. Vílchez-Gómez, 'Noise Pollution and Urban Planning', Curr Pollut Rep, vol. 4, no. 3, pp. 208-219, 2018, doi: 10.1007/s40726-018-0095-7.
View Article
[9] S. Aminzadegan, M. Shahriari, F. Mehranfar, and B. Abramović, 'Factors affecting the emission of pollutants in different types of transportation: A literature review', Energy Reports, vol. 8, pp. 2508-2529, 2022, doi: https://doi.org/10.1016/j.egyr.2022.01.161.
View Article
[10] F. Dobruszkes et al., 'Multiple-airport systems: The (re)development of older airports in view of noise pollution issues', Transp Policy (Oxf), vol. 114, pp. 298-311, 2021, doi: https://doi.org/10.1016/j.tranpol.2021.10.013.
View Article
[11] B. Athirah and M. S. Nurul Shahida, 'Aircraft Noise Exposure and Effects on the Health of Nearby Residents: A Review', in Human-Centered Technology for a Better Tomorrow, M. H. A. Hassan, Z. Ahmad (a) Manap, M. Z. Baharom, N. H. Johari, U. K. Jamaludin, M. H. Jalil, I. Mat Sahat, and M. N. Omar, Eds., Singapore: Springer Singapore, 2022, pp. 361-378.
View Article
[12] W. Hemmat, A. M. Hesam, and H. Atifnigar, 'Exploring Noise Pollution, Causes, Effects, and Mitigation Strategies: A Review Paper', European Journal of Theoretical and Applied Sciences, vol. 1, no. 5, pp. 995-1005, Sep. 2023, doi: 10.59324/ejtas.2023.1(5).86.
View Article
[13] A. A. Faiyetole and J. T. Sivowaku, 'The effects of aircraft noise on psychosocial health', J Transp Health, vol. 22, p. 101230, 2021, doi: https://doi.org/10.1016/j.jth.2021.101230.
View Article
[14] Z. U. R. Farooqi et al., 'Types, sources, socioeconomic impacts, and control strategies of environmental noise: a review', Environmental Science and Pollution Research, vol. 29, no. 54, pp. 81087-81111, 2022, doi: 10.1007/s11356-022-23328-7.
View Article
[15] F. Ibili, E. K. Adanu, C. A. Adams, S. A. Andam-Akorful, S. S. Turay, and S. A. Ajayi, 'Traffic noise models and noise guidelines: A review', Noise & Vibration Worldwide, vol. 53, no. 1-2, pp. 65-79, Nov. 2021, doi: 10.1177/09574565211052693.
View Article
[16] F. Ekici, G. Orhan, Ö. Gümüş, and A. B. Bahce, 'A policy on the externality problem and solution suggestions in air transportation: The environment and sustainability', Energy, vol. 258, p. 124827, 2022, doi: https://doi.org/10.1016/j.energy.2022.124827.
View Article
[17] E. Murphy and E. A. King, Environmental noise pollution: Noise mapping, public health, and policy. Elsevier, 2022.
View Article
[18] M. A. Zambrano-Monserrate and M. A. Ruano, 'Does environmental noise affect housing rental prices in developing countries? Evidence from Ecuador', Land use policy, vol. 87, p. 104059, 2019, doi: https://doi.org/10.1016/j.landusepol.2019.104059.
View Article
[19] S. Abalansa, B. El Mahrad, J. Icely, and A. Newton, 'Electronic waste, an environmental problem exported to developing countries: The GOOD, the BAD and the UGLY', Sustainability, vol. 13, no. 9, p. 5302, 2021.
View Article
[20] M. M. M. Alsahli and M. Al-Harbi, 'Environmental justice in Kuwait metropolitan area: a spatial analysis of land-use impact on environmental quality variability', Local Environ, vol. 28, no. 1, pp. 80-98, 2023.
View Article
[21] S. AlKheder and R. Almutairi, 'Roadway traffic noise modelling in the hot hyper-arid Arabian Gulf region using adaptive neuro-fuzzy interference system', Transp Res D Transp Environ, vol. 97, p. 102917, 2021.
View Article
[22] S. AlKheder, 'The effect of traffic at speed bumps in residential areas on noise and air pollution', Environmental Science and Pollution Research, vol. 30, no. 33, pp. 80945-80962, 2023.
View Article
[23] D. Montes González, J. M. Barrigón Morillas, and G. Rey-Gozalo, 'Effects of noise on pedestrians in urban environments where road traffic is the main source of sound', Science of The Total Environment, vol. 857, p. 159406, 2023, doi: https://doi.org/10.1016/j.scitotenv.2022.159406.
View Article
[24] D. of Transport, 'Calculation of road traffic noise', 1988, HMSO London.
[25] H. Khreis et al., 'The health impacts of traffic-related exposures in urban areas: Understanding real effects, underlying driving forces and co-producing future directions', J Transp Health, vol. 3, no. 3, pp. 249-267, 2016, doi: https://doi.org/10.1016/j.jth.2016.07.002.
View Article
[26] M. J. Nieuwenhuijsen, H. Khreis, E. Verlinghieri, N. Mueller, and D. Rojas-Rueda, 'Participatory quantitative health impact assessment of urban and transport planning in cities: A review and research needs', Environ Int, vol. 103, pp. 61-72, 2017, doi: https://doi.org/10.1016/j.envint.2017.03.022.
View Article
[27] P. Jennings and R. Cain, 'A framework for improving urban soundscapes', Applied Acoustics, vol. 74, no. 2, pp. 293-299, 2013, doi: https://doi.org/10.1016/j.apacoust.2011.12.003.
View Article
[28] Department for Transport, 'Air Navigation Guidance: Guidance on airspace & noise management and environmental objectives', London, 2017.
[29] D. Mackenzie, ICAO: A history of the international civil aviation organization. University of Toronto Press, 2010.
View Article
[30] T. A. Rolf, 'International Aircraft Noise Certification', J. Air L. & Com., vol. 65, p. 383, 1999.
[31] S. Khardi, 'Reduction of commercial aircraft noise emission around airports. A new environmental challenge', European Transport Research Review, vol. 1, no. 4, pp. 175-184, 2009.
View Article
[32] International Civil Aviation Organization (ICAO), 'Aircraft Noise'. Accessed: Nov. 18, 2022. [Online]. Available:
View Article
[33] L. C. Den Boer and A. Schroten, 'Traffic noise reduction in Europe', CE delft, vol. 14, pp. 2057-2068, 2007.
[34] Bruel & Kjaer, 'Sound and Vibration Instrument Hire and Calibration B&K 2250 BZ 7222 Sound Analysis Specifications', Gracey & Associates. Accessed: Jul. 24, 2023. [Online]. Available:
View Article
[35] Spack Solutions, 'Count CAM2 Video Recording System Product Manual'. Accessed: Jul. 24, 2023. [Online]. Available:
View Article
[36] Decatur Electronics, 'GHDTM ScoutTM User's Manual', 25/08/2010. Accessed: Jul. 24, 2023. [Online]. Available:
View Article
[37] Ambient Weather, 'WM-5 Manual'. Accessed: Jul. 24, 2023. [Online]. Available:
View Article
[38] M. Basner et al., 'Auditory and non-auditory effects of noise on health', The lancet, vol. 383, no. 9925, pp. 1325-1332, 2014.
View Article
[39] Kuwait Today, 'Decision No. 8/2017', Kuwait Today. Accessed: Jan. 01, 2023. [Online]. Available:
View Article
[40] Fields, J. M., & Walker, J. G. 'Noise and traffic flow characteristics', Journal of Sound and Vibration, 84(4), PP. 529-538, 1982.
[1] L. T. Silva and J. F. G. Mendes, 'City Noise-Air: An environmental quality index for cities', Sustain Cities Soc, vol. 4, pp. 1-11, 2012, doi: https://doi.org/10.1016/j.scs.2012.03.001. View Article
[2] A.-M. O. Mohamed, E. K. Paleologos, and F. M. Howari, 'Chapter 19 - Noise pollution and its impact on human health and the environment', in Pollution Assessment for Sustainable Practices in Applied Sciences and Engineering, A.-M. O. Mohamed, E. K. Paleologos, and F. M. Howari, Eds., Butterworth-Heinemann, 2021, pp. 975-1026. doi: https://doi.org/10.1016/B978-0-12-809582-9.00019-0. View Article
[3] B. Berglund, T. Lindvall, and D. H. Schwela, 'New Who Guidelines for Community Noise', Noise & Vibration Worldwide, vol. 31, no. 4, pp. 24-29, Apr. 2000, doi: 10.1260/0957456001497535. View Article
[4] L. Goines and L. Hagler, 'Noise pollution: a modem plague', South Med J, vol. 100, no. 3, pp. 287-294, 2007. View Article
[5] R. T. Buxton et al., 'Noise pollution is pervasive in U.S. protected areas', Science (1979), vol. 356, no. 6337, pp. 531-533, May 2017, doi: 10.1126/science.aah4783. View Article
[6] C. Iglesias-Merchan, R. Laborda-Somolinos, S. González-Ávila, and R. Elena-Rosselló, 'Spatio-temporal changes of road traffic noise pollution at ecoregional scale', Environmental Pollution, vol. 286, p. 117291, 2021, doi: https://doi.org/10.1016/j.envpol.2021.117291. View Article
[7] S. K. Tiwari, L. A. Kumaraswamidhas, and N. Garg, 'Strategies and Implications of Noise Pollution Monitoring, Modelling, and Mitigation in Urban Cities', in Handbook of Metrology and Applications, D. K. Aswal, S. Yadav, T. Takatsuji, P. Rachakonda, and H. Kumar, Eds., Singapore: Springer Nature Singapore, 2023, pp. 1571-1593. doi: 10.1007/978-981-99-2074-7_86. View Article
[8] J. M. B. Morillas, G. R. Gozalo, D. M. González, P. A. Moraga, and R. Vílchez-Gómez, 'Noise Pollution and Urban Planning', Curr Pollut Rep, vol. 4, no. 3, pp. 208-219, 2018, doi: 10.1007/s40726-018-0095-7. View Article
[9] S. Aminzadegan, M. Shahriari, F. Mehranfar, and B. Abramović, 'Factors affecting the emission of pollutants in different types of transportation: A literature review', Energy Reports, vol. 8, pp. 2508-2529, 2022, doi: https://doi.org/10.1016/j.egyr.2022.01.161. View Article
[10] F. Dobruszkes et al., 'Multiple-airport systems: The (re)development of older airports in view of noise pollution issues', Transp Policy (Oxf), vol. 114, pp. 298-311, 2021, doi: https://doi.org/10.1016/j.tranpol.2021.10.013. View Article
[11] B. Athirah and M. S. Nurul Shahida, 'Aircraft Noise Exposure and Effects on the Health of Nearby Residents: A Review', in Human-Centered Technology for a Better Tomorrow, M. H. A. Hassan, Z. Ahmad (a) Manap, M. Z. Baharom, N. H. Johari, U. K. Jamaludin, M. H. Jalil, I. Mat Sahat, and M. N. Omar, Eds., Singapore: Springer Singapore, 2022, pp. 361-378. View Article
[12] W. Hemmat, A. M. Hesam, and H. Atifnigar, 'Exploring Noise Pollution, Causes, Effects, and Mitigation Strategies: A Review Paper', European Journal of Theoretical and Applied Sciences, vol. 1, no. 5, pp. 995-1005, Sep. 2023, doi: 10.59324/ejtas.2023.1(5).86. View Article
[13] A. A. Faiyetole and J. T. Sivowaku, 'The effects of aircraft noise on psychosocial health', J Transp Health, vol. 22, p. 101230, 2021, doi: https://doi.org/10.1016/j.jth.2021.101230. View Article
[14] Z. U. R. Farooqi et al., 'Types, sources, socioeconomic impacts, and control strategies of environmental noise: a review', Environmental Science and Pollution Research, vol. 29, no. 54, pp. 81087-81111, 2022, doi: 10.1007/s11356-022-23328-7. View Article
[15] F. Ibili, E. K. Adanu, C. A. Adams, S. A. Andam-Akorful, S. S. Turay, and S. A. Ajayi, 'Traffic noise models and noise guidelines: A review', Noise & Vibration Worldwide, vol. 53, no. 1-2, pp. 65-79, Nov. 2021, doi: 10.1177/09574565211052693. View Article
[16] F. Ekici, G. Orhan, Ö. Gümüş, and A. B. Bahce, 'A policy on the externality problem and solution suggestions in air transportation: The environment and sustainability', Energy, vol. 258, p. 124827, 2022, doi: https://doi.org/10.1016/j.energy.2022.124827. View Article
[17] E. Murphy and E. A. King, Environmental noise pollution: Noise mapping, public health, and policy. Elsevier, 2022. View Article
[18] M. A. Zambrano-Monserrate and M. A. Ruano, 'Does environmental noise affect housing rental prices in developing countries? Evidence from Ecuador', Land use policy, vol. 87, p. 104059, 2019, doi: https://doi.org/10.1016/j.landusepol.2019.104059. View Article
[19] S. Abalansa, B. El Mahrad, J. Icely, and A. Newton, 'Electronic waste, an environmental problem exported to developing countries: The GOOD, the BAD and the UGLY', Sustainability, vol. 13, no. 9, p. 5302, 2021. View Article
[20] M. M. M. Alsahli and M. Al-Harbi, 'Environmental justice in Kuwait metropolitan area: a spatial analysis of land-use impact on environmental quality variability', Local Environ, vol. 28, no. 1, pp. 80-98, 2023. View Article
[21] S. AlKheder and R. Almutairi, 'Roadway traffic noise modelling in the hot hyper-arid Arabian Gulf region using adaptive neuro-fuzzy interference system', Transp Res D Transp Environ, vol. 97, p. 102917, 2021. View Article
[22] S. AlKheder, 'The effect of traffic at speed bumps in residential areas on noise and air pollution', Environmental Science and Pollution Research, vol. 30, no. 33, pp. 80945-80962, 2023. View Article
[23] D. Montes González, J. M. Barrigón Morillas, and G. Rey-Gozalo, 'Effects of noise on pedestrians in urban environments where road traffic is the main source of sound', Science of The Total Environment, vol. 857, p. 159406, 2023, doi: https://doi.org/10.1016/j.scitotenv.2022.159406. View Article
[24] D. of Transport, 'Calculation of road traffic noise', 1988, HMSO London.
[25] H. Khreis et al., 'The health impacts of traffic-related exposures in urban areas: Understanding real effects, underlying driving forces and co-producing future directions', J Transp Health, vol. 3, no. 3, pp. 249-267, 2016, doi: https://doi.org/10.1016/j.jth.2016.07.002. View Article
[26] M. J. Nieuwenhuijsen, H. Khreis, E. Verlinghieri, N. Mueller, and D. Rojas-Rueda, 'Participatory quantitative health impact assessment of urban and transport planning in cities: A review and research needs', Environ Int, vol. 103, pp. 61-72, 2017, doi: https://doi.org/10.1016/j.envint.2017.03.022. View Article
[27] P. Jennings and R. Cain, 'A framework for improving urban soundscapes', Applied Acoustics, vol. 74, no. 2, pp. 293-299, 2013, doi: https://doi.org/10.1016/j.apacoust.2011.12.003. View Article
[28] Department for Transport, 'Air Navigation Guidance: Guidance on airspace & noise management and environmental objectives', London, 2017.
[29] D. Mackenzie, ICAO: A history of the international civil aviation organization. University of Toronto Press, 2010. View Article
[30] T. A. Rolf, 'International Aircraft Noise Certification', J. Air L. & Com., vol. 65, p. 383, 1999.
[31] S. Khardi, 'Reduction of commercial aircraft noise emission around airports. A new environmental challenge', European Transport Research Review, vol. 1, no. 4, pp. 175-184, 2009. View Article
[32] International Civil Aviation Organization (ICAO), 'Aircraft Noise'. Accessed: Nov. 18, 2022. [Online]. Available: View Article
[33] L. C. Den Boer and A. Schroten, 'Traffic noise reduction in Europe', CE delft, vol. 14, pp. 2057-2068, 2007.
[34] Bruel & Kjaer, 'Sound and Vibration Instrument Hire and Calibration B&K 2250 BZ 7222 Sound Analysis Specifications', Gracey & Associates. Accessed: Jul. 24, 2023. [Online]. Available: View Article
[35] Spack Solutions, 'Count CAM2 Video Recording System Product Manual'. Accessed: Jul. 24, 2023. [Online]. Available: View Article
[36] Decatur Electronics, 'GHDTM ScoutTM User's Manual', 25/08/2010. Accessed: Jul. 24, 2023. [Online]. Available: View Article
[37] Ambient Weather, 'WM-5 Manual'. Accessed: Jul. 24, 2023. [Online]. Available: View Article
[38] M. Basner et al., 'Auditory and non-auditory effects of noise on health', The lancet, vol. 383, no. 9925, pp. 1325-1332, 2014. View Article
[39] Kuwait Today, 'Decision No. 8/2017', Kuwait Today. Accessed: Jan. 01, 2023. [Online]. Available: View Article
[40] Fields, J. M., & Walker, J. G. 'Noise and traffic flow characteristics', Journal of Sound and Vibration, 84(4), PP. 529-538, 1982.