International Journal of Civil Infrastructure (IJCI)
ISSN: 2563-8084

Volume 8 - Year 2025- Pages 163-173
DOI: 10.11159/ijci.2025.017
Adaptive Traffic Lights with Selective Use of Detectors for Reducing Congestion at Urban Intersections
Erwin Romero Canchanya1, Brayan Frank Torres Quiñonez1, Aldo Rafael Bravo Lizano1
1Universidad Peruana de Ciencias Aplicadas
Prolongación Primavera 2390, Santiago de Surco 15023, Lima, Peru
u20201b194@upc.edu.pe ; u20201b409@upc.edu.pe
2 Universidad Peruana de Ciencias Aplicadas
Prolongación Primavera 2390, Santiago de Surco 15023, Lima, Peru
aldo.bravo@upc.pe
Abstract - Population growth and the increasing demand for urban mobility have led to a rise in the number of vehicles and traffic congestion in cities such as Lima, particularly at intersections in the Surco district. This situation not only causes delays but also poses risks to pedestrian safety. The current static traffic light synchronization does not adapt to variable traffic conditions, resulting in time losses and high economic costs.
This study addresses the design and simulation of an adaptive traffic light system for an intersection, using VISSIM software and strategically positioning detectors in the most critical lanes. The main objective is to improve congestion indicators such as delays, queue lengths, and the level of service. The contributions include data collection of the current situation, simulation and validation of this scenario, programming of adaptive traffic lights in VisVAP, and a comparative analysis of results. The findings show considerable improvements, such as a reduction in delays between 19.0% and 23.0%, a 42.3% decrease in queue lengths, and an improvement in service levels to categories A and B, effectively eliminating the lowest service levels.
Keywords: Adaptive Traffic Lights, Traffic Congestion, Road Management, Selective Detectors, Traffic Flow.
© Copyright 2025 Authors - This is an Open Access article published under the Creative Commons Attribution License terms. Unrestricted use, distribution, and reproduction in any medium are permitted, provided the original work is properly cited.
Date Received: 2025-01-14
Date Revised: 2025-09-02
Date Accepted: 2025-09-27
Date Published: 2025-10-21
1. Introduction
Traffic congestion at urban intersections represents a universal challenge in contemporary cities, with direct effects on transportation efficiency, air quality, and user experience. In Latin America, Lima stands out as the city with the highest time lost per driver due to traffic, reaching approximately 157 hours annually [1], which translates into significant economic losses and increased pollutant emissions. This problem is exacerbated at intersections operating with fixed-cycle traffic light systems, which lack the flexibility to dynamically respond to variations in traffic flow.
In this context, adaptive traffic signals have emerged as an innovative solution that enables real-time traffic regulation. These systems, through the use of advanced algorithms and reinforcement learning, such as those proposed in [2], adjust green and red light times based on information collected by flow detectors, effectively reducing both waiting times and traffic conflicts. For example, the use of techniques such as the Dueling Double Deep Q Network (D3QN) framework has shown an 18% reduction in waiting time and a 16% decrease in traffic conflicts [2]. Moreover, strategies like the “Green Advisory” have proven effective in reducing reaction times and improving traffic flow efficiency, achieving up to 15% improvement in travel time under high demand conditions [3].
The implementation of these systems, however, faces significant challenges, particularly in contexts of high traffic demand and limited resources. Research has explored various approaches, including reinforcement learning and macroscopic and microscopic simulations (SUMO, VISSIM, AIMSUN) to model complex traffic behavior, achieving reductions of up to 13.7% in total travel time under severe congestion conditions [4]. On the other hand, integrated solutions have been proposed, such as the use of variable lanes combined with signal control, resulting in a 25% reduction in average delay and a 60% increase in traffic flow [5].
In terms of efficiency, models such as the Dynamic and Intelligent Traffic Light Control System (DITLCS), which applies deep learning and fuzzy systems, have shown significant reductions in queue lengths and waiting times, with overall performance improvements of up to 68% [6]. Furthermore, the importance of analyzing key metrics such as delay and fluctuations in queue length has been highlighted, identifying limitations in traditional traffic signal control strategies [7].
This study proposes reducing traffic congestion by placing detectors only on the most congested lane of an intersection, thus improving traffic control without the need for additional sensors. Based on evidence from previous research, this strategy seeks to optimize the available resources, validated in a specific scenario. The results obtained could be applicable to other growing cities, offering an efficient and sustainable solution for traffic management.
2. Methodology and contribution
2. 1. Methodology
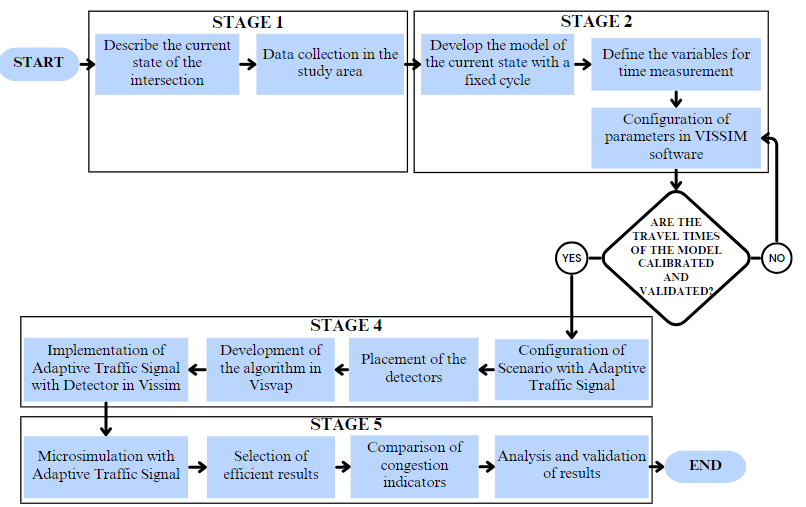
This section presents the adaptive traffic light implementation plan, which aims to reduce traffic congestion through the strategic placement of detectors at an intersection. In particular, the development of this plan is set out in detail in this part of the article. It first starts with describing the current state, followed by data collection and model development. This process includes the modeling of the current situation, which must be calibrated and validated to reflect reality, thus allowing results to be obtained on traffic congestion indicators through simulations. Once the evaluation of the current state is completed, the adaptive traffic light is implemented, starting with the configuration of the new phases of the traffic light and the placement of the detectors in the lanes of the avenues, then the development of the adaptive algorithm. Finally, the files of the current state are integrated with the algorithm to perform a simulation that generates new results to be analyzed.
To facilitate understanding, this procedure has been structured in 4 stages with a total of 13 steps, represented in a flowchart illustrated in Figure 1, designed to achieve the specific objectives of the study.
- Describe the current state by collecting field information at the study intersection.
- Model current behavior by using VISSIM software, at an intersection.
- Design the Adaptive Traffic Light Cycle and algorithm for the model.
- Simulate the proposed solution of the adaptive traffic light in the VISSIM Software.
- Analyze the results of the current situation with the implementation of the proposed solution.
It can be seen in Figure 1 that one of the most important parts is calibration and validation, since these represent the reality of the situation at the intersection. In addition, validation is essential because, subsequently, the analysis of the results of the parameters designed for the intersection in VISSIM will be carried out.
2. 2. Contribution
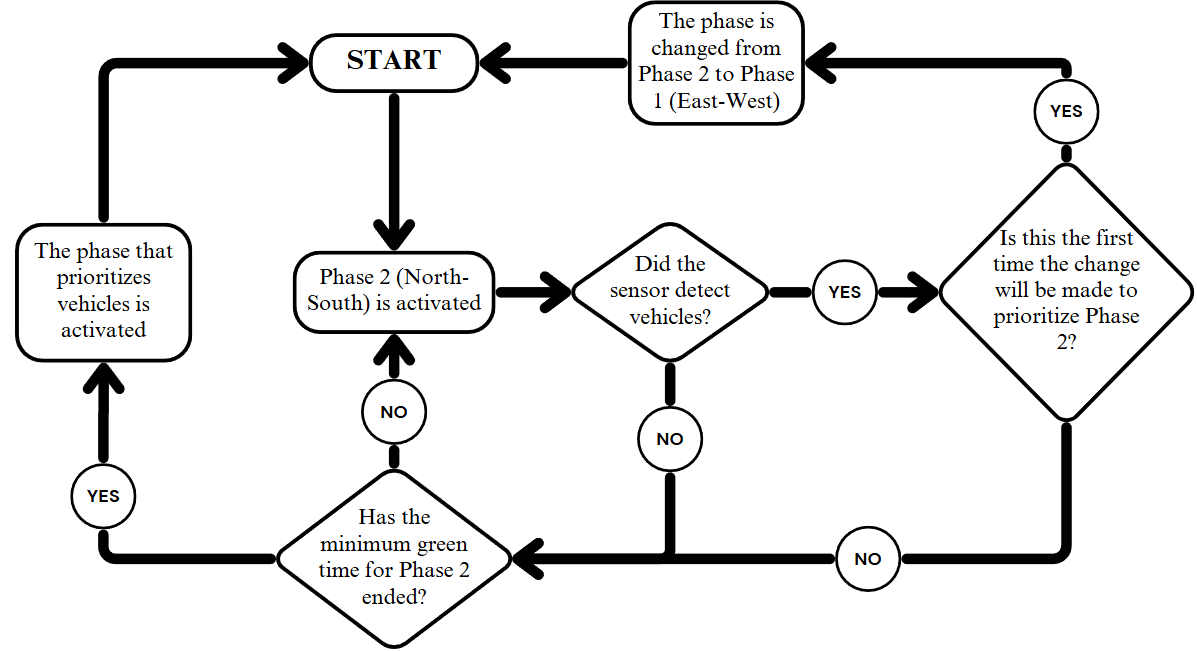
This article presents a novel strategy for mitigating traffic congestion by decreasing the need to install detectors at all access points at an intersection. The strategy consists of the selective placement of detectors, placing them exclusively on the road with the highest traffic flow, that is, in the most congested direction. This strategic location allows the traffic control system to function optimally without requiring additional sensors at each entrance.
To explain the arrangement of the detectors in the design of the traffic light, a flow diagram was developed, as shown in Figure 2, which facilitates the understanding of the behavior generated by the activation of the detectors located in the accesses with the highest level of congestion.
3. Equations
This section presents a formal description of the main elements to determine the minimum number of runs required in the simulation of vehicular traffic, using microsimulation tools in VISSIM. In this case, the analysis was developed for a period of 1 hour.
Analysis of runs in 1 hour: A confidence level of 95% and a significance level of 0.05 were established.

To calculate the minimum number of runs required shown in Table 1, the following formula is used:

Where:
N=number of runs obtained
e=margin of error
S=standard deviation
t∝/2= value of the "t" student distribution
Table 1. Minimum number of runs required
|
Section |
N (runs) |
|
CAMINOS DEL INCA SOUTH-NORTH (SECTION 1) |
15 |
|
BENAVIDES EAST-WEST (SECTION 2) |
15 |
4. Materials and Tools
Various materials were used for the collection of field data such as: High resolution camera, manual counters (pencil and paper) and a 50-meter tape measure and colored chalk
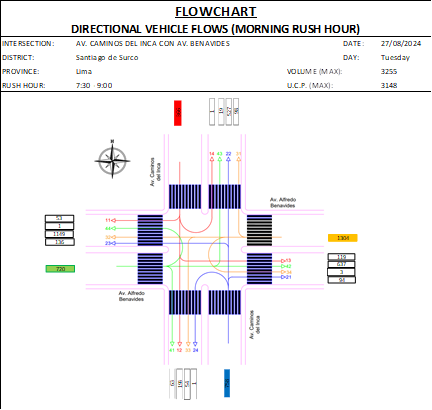
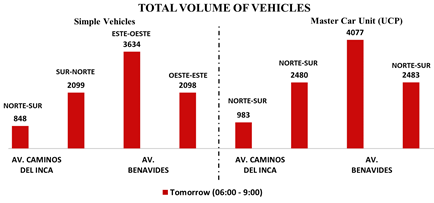
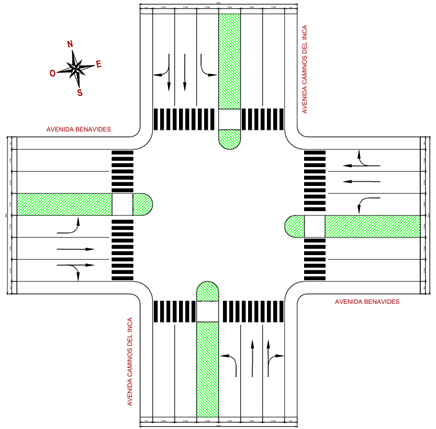
First, the directions of vehicular and pedestrian flows were defined in an illustrative way, showing only the vehicular ones Figure 3, considering different categories such as private cars, public transport vehicles, motorcycles, trucks, among others, at the study intersection, also determining the master car units. Subsequently, the vehicular and pedestrian count was carried out in the field for two days (Tuesday and Thursday), from 6:00 a.m. to 9:00 a.m., corresponding to the period of greatest demand at the intersection. Finally, the information collected was organized to obtain the vehicular flow of the intersection of Caminos del Inca and Benavides (Figure 4).
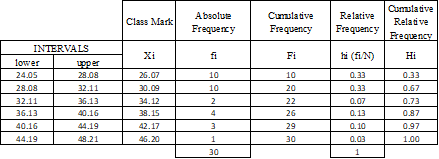
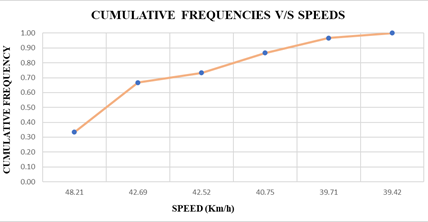
In addition, travel times were recorded in two specific sections: Section 1 (South-North) and Section 2 (East-West). To this end, 30 meters were previously delimited in each section, which allowed the travel times for each type of vehicle to be recorded. From these records, the speeds and associated frequencies were determined Figure 5, as well as the cumulative frequency Figure 6, for each type of vehicle and each access. By way of illustration, the case of the auto type in section 1 access (South-North) is presented.
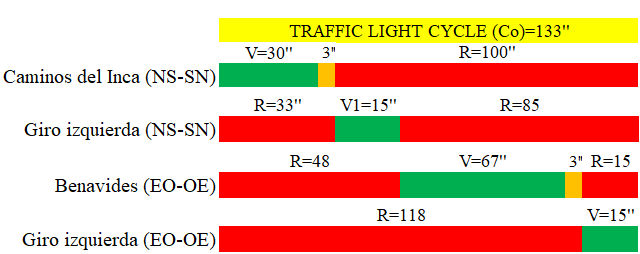
Likewise, geometric measurements of the intersection were carried out, including the width of sidewalks, the dimensions of the lanes and a detailed analysis of the points of conflict. In the study area, four traffic lights were identified, both vehicular and pedestrian, located at each of the accesses. The phases of operation are presented in Figure 7, while the corresponding cycles of each traffic light are shown in Figure 8.

For this research, the use of VISSIM simulation software was implemented as a tool, since it allowed to model in detail the study intersection and evaluate the effectiveness of the adaptive traffic light in reducing traffic congestion. The data that had to be entered is the following:
- Number of vehicles according to type
- Traffic light time
- Cumulative Frequency of Vehicle Speeds
- Geometric dimensions of the intersection
5. Intersection Design
The design was carried out at the intersection of Av. Caminos del Inca with Av. Alfredo Benavides, in Lima, Peru as shown in Figure 9, with the purpose of reducing traffic congestion through the implementation of an adaptive traffic light. The strategy includes the installation of detectors 30 m. before the vehicle stop area. Congestion indicators, such as queue length, delay and service level on sections 1 (South-North) and 2 (East-West), are calculated using VISSIM simulation software.
5.1 Microsimulation of the Current Scenario
5.1.1. Modeling and Simulating the Intersection
The current modeling was carried out using the VISSIM software for the intersection, for which it was necessary to obtain prior information, such as the geometry of the intersection, speeds and vehicle and pedestrian capacity data.
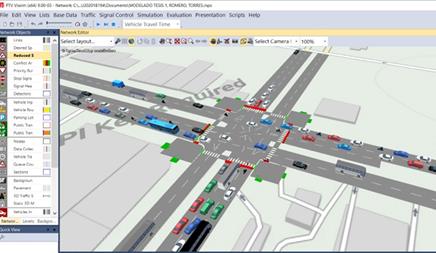
It began with the activation of the map in VISSIM, then the entry and exit routes were traced using the "Links" tool and the connections were made with the "Connector" tool. Then the points of conflict were inserted and priority was given between the routes of vehicles and pedestrians. Subsequently, the vehicular flows were inserted using the "Vehicle Inputs" tool, assigning the respective volumes according to the type of vehicle and the route followed by each one. On the other hand, for the configuration of the traffic light cycle, the "Signal Control" tool was used, which allowed adjusting the times of green, red and amber light as shown in Figure 10, thus finalizing the current modeling and proceeding with the simulation as illustrated in Figure 11.
5. 1. 2. Calibration and Validation
The statistical analysis for calibration and validation was carried out using the randomization test for the mean difference, implemented with the StatKey tool. During this procedure, the combination that generated the most favorable statistical results was identified.
- Calibration
a. Simulation variables.
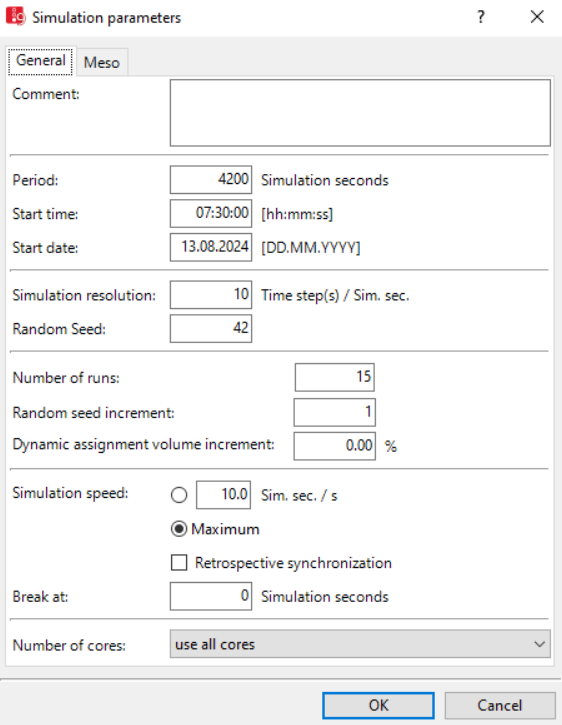
The start time, start date, and number of simulations were configured. The simulation period was set to 1 hour (3600 seconds) with an additional 10 minutes for vehicle warm-up Figure 12. To calibrate the model, data on field travel times from sections 1 and 2 were used, as shown in Table 2.
b. Wiedemann Parameter Settings
The parameters of Wiedemann 74 and Visual Distance Forward were adjusted. The results obtained during calibration are presented in Table I.
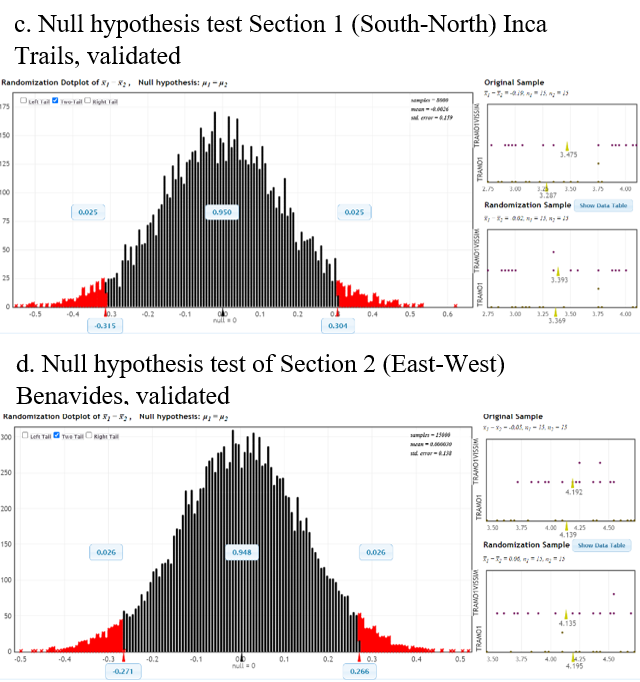
c. Null Hypothesis Test (Non-Parametric)
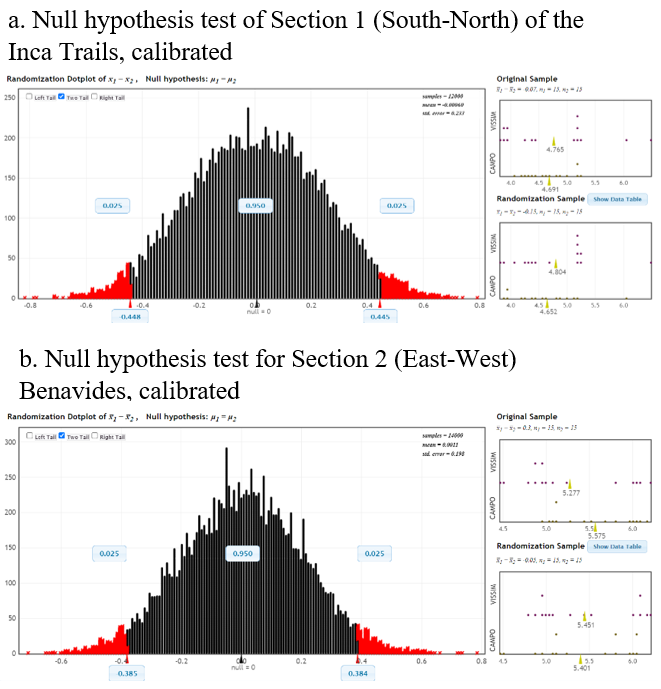
The virtual tool StatKey was used to evaluate the average differences in travel times of sections 1 and 2 with a significance level of 0.05 and that the probability of a queue exceeds 95% confidence between the field data and VISSIM, as shown in the Figure. 13 (a) and (b).
- Validation of the current model
In order to verify the validity of the model created, a gauge 2 on Thursday was used and travel times were measured on Caminos del Inca and Benavides avenues, the results of which are presented in Table 2.
The procedure followed is similar to that used during calibration. First, the minimum number of bullfights necessary was determined; subsequently, the Wiedemann parameters and the Visual Distance to the Front were adjusted, as detailed in Table 2. Finally, a null-hypothesis test was applied, as depicted in Figure 13(c)(d).
Table 2. Travel Time Results
|
RESULTS |
CAMINOS DEL INCA SOUTH-NORTH (SECTION 1) |
BENAVIDES EAST-WEST (SECTION 2) |
|
Average travel time (s) |
Average travel time (s) |
|
|
Field Capacity 1 |
4.69 |
5.57 |
|
Field Capacity 2 |
4.73 |
5.52 |
|
Calibrated |
4.76 |
5.28 |
|
Validated |
4.78 |
5.29 |
5. 2. Implementation of the Proposal
5. 2.1. Construction of the Solution Proposal
- Development of the PUA Archive
Since the proposal considers the conditional activation of a minimum green time for the southern access, the traffic light phases of the intersection were updated. However, the number of vehicular and pedestrian phases in operation remained constant.
Subsequently, using the Intergreen Matrix1 command, an all-green time of 4 seconds was added during the pedestrian interface, since in the current situation a problem was identified: during the phase change, pedestrians faced conflicts to complete their journeys.
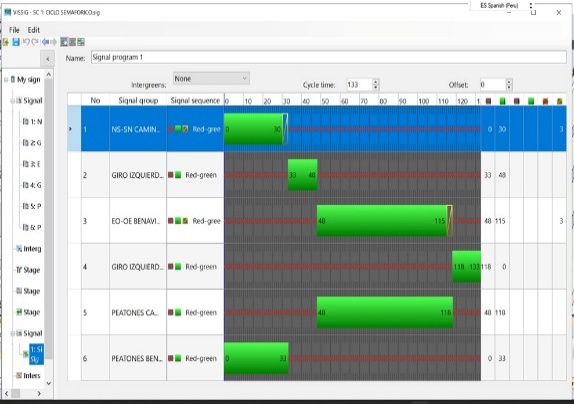
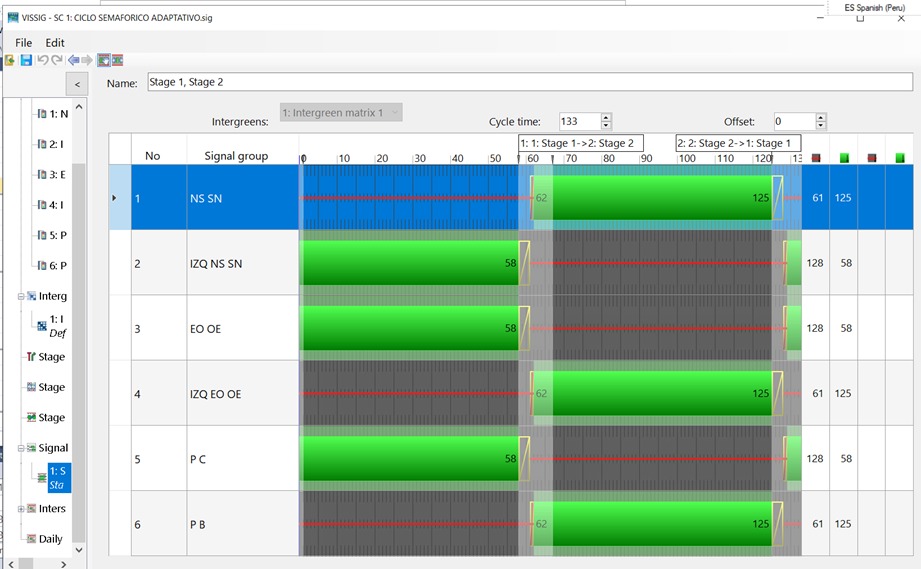
Likewise, using the Stage command, the sequence of the adaptive traffic light cycle was configured according to the following stages: stage 1 (Left turn Caminos del Inca, EO-OE and pedestrians Caminos del Inca) and stage 2 (Left turn Benavides, NS-SN and pedestrians Benavides).
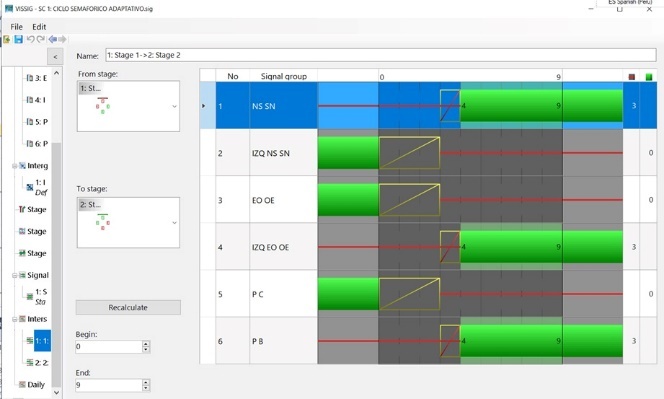
The total duration of the traffic light cycle (133 seconds) remained constant; however, the green and red times assigned to each phase were adjusted and updated, as detailed in Figure 14, using the Create stage based signal program option. Additionally, this tool allowed the generation of the Interstage corresponding to stages 1 and 2, as shown in Figure 15.
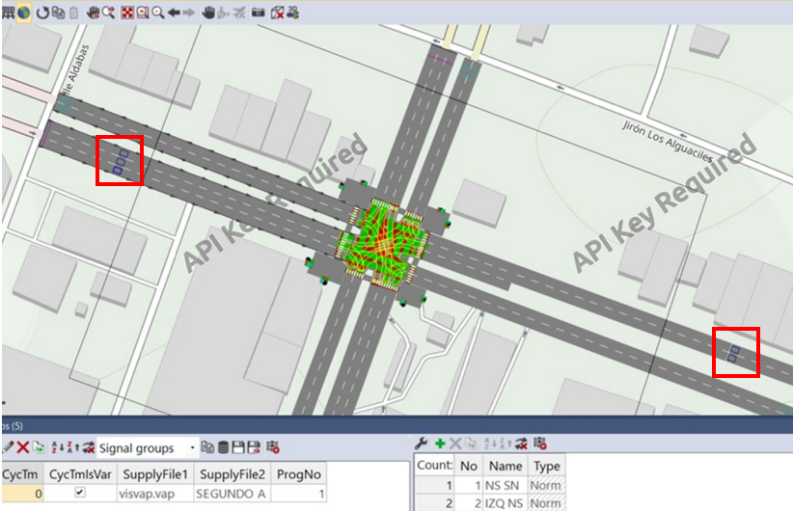
In addition, detectors were installed on Benavides Avenue to generate a constant flow, which were incorporated through the Network Objects – Detectors route. These detectors were configured with a sensor length of three meters and a joint activation, assigning them the same port. They were also placed at a distance of 30 meters from the vehicle stopping point, as shown in Figure 16.
Finally, the files with PUA extension corresponding to the vehicular and pedestrian phases programmed with detectors were exported. To perform this action, the VISSIG-Signal Controller was accessed and the File – Export – PUA path was followed.
- Development of the VAP Archive
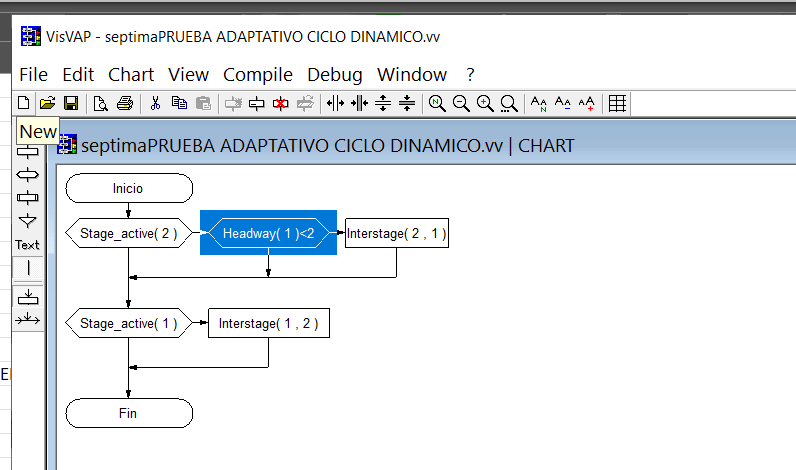
The coding was carried out in the VisVAP program, assigning functionality to the sensors. For this purpose, an algorithm, represented in Figure 17, was developed using basic elements of conditional programming. This included the "Condition" commands, the "Statement" statements, and the start and end boxes called "Terminus".
In the programming, it was established as an initial condition that the phase corresponding to the North-South and South-North movement was active, using the indication Stage_active (2). Subsequently, the activation of the detector was conditioned to measure the time interval between two consecutive vehicles; if this interval is less than 2 seconds (Headway (1)<2), the green phase is activated for that traffic light group. If no vehicle is detected, the phases follow their established logical sequence.
Finally, the files with VAP extension were generated for the adaptive traffic light cycle. To be able to perform this action, the Compile-Generate VAP File was entered.
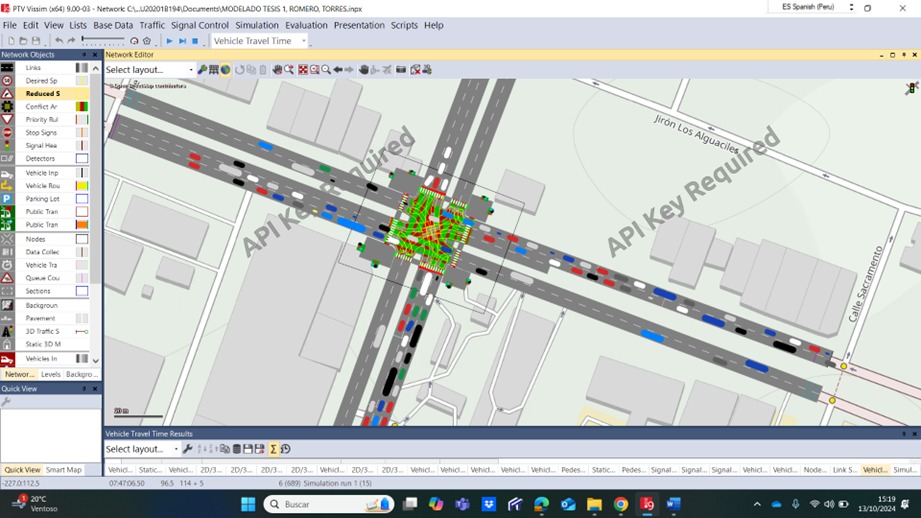
5. 2.2. Simulation with the Solution Proposal
In this section, the same parameters of the current microsimulation were considered. In addition, for the Adaptive Traffic Light settings, the cycle time was changed from fixed "fixed" to variable "Vap", in "logic file" the VAP was uploaded and in "interstage" the PUA. Finally, the simulation was run with the proposal and contribution as illustrated in Figure 18.
6. Current and Proposed Situation Results
Once the calibration and validation was completed, which represents the situation in reality, we proceeded to calculate the traffic congestion indicators such as: Delay, queue length and level of service of the intersection, the results are shown in Table 3.
After the implementation of the Adaptive Traffic Light with the algorithm created in Visvap and the efficient placement of the detectors, we proceeded to obtain the traffic congestion indicators as shown in Table 4.
Table 3. Results of current congestion indicators
|
RESULTS |
CURRENT SITUATION |
|||||
|
SOUTH-NORTH INCA ROADS (SECTION 1) |
BENAVIDES EAST-WEST (SECTION 2) |
|||||
|
Delay(s) |
4.76 |
5.28 |
||||
|
Movements |
||||||
|
Movement Number |
13 |
|||||
|
Tail Length (m) |
120.25 |
|||||
|
Service Level |
To |
B |
C |
D |
And |
F |
|
0 |
3 |
30 |
97 |
35 |
30 |
|
Table 4. Results of congestion indicators with Proposal
|
RESULTS |
WITH PROPOSAL |
|||||
|
SOUTH-NORTH INCA ROADS (SECTION 1) |
BENAVIDES EAST-WEST (SECTION 2) |
|||||
|
Delay(s) |
3.86 |
4.11 |
||||
|
Movements |
||||||
|
Movement Number |
13 |
|||||
|
Tail Length (m) |
69.38 |
|||||
|
Service Level |
To |
B |
C |
D |
And |
F |
|
22 |
103 |
70 |
0 |
0 |
0 |
|
7. Analysis of Results
The implementation of the adaptive traffic light system with detector at the intersection was evaluated using main indicators: average delay, queue length and service level, which allowed a detailed analysis of its impact on reducing congestion. While the study was conducted in a specific setting, the results suggest that the approach can be replicated at similar urban intersections to improve mobility.
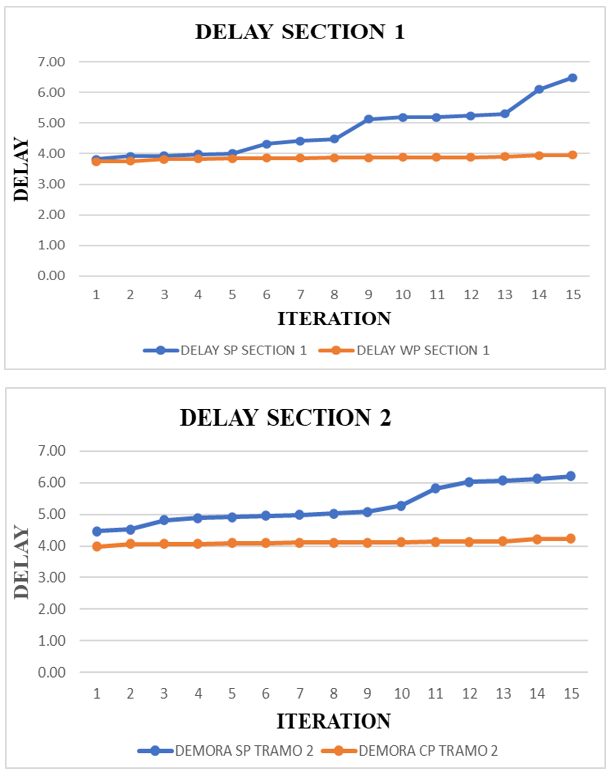
- Average Delay
The average delay in sections 1 and 2 showed a notable decrease after the implementation of the adaptive system. With the installation of selective detectors on the most congested road, the traffic light cycle was dynamically adjusted to the flow of vehicles, reducing the delay during peak hours Figure 19. This adjustment methodology, depending on the specific demand of each access, could be applied effectively at other intersections with high congestion problems on certain roads.
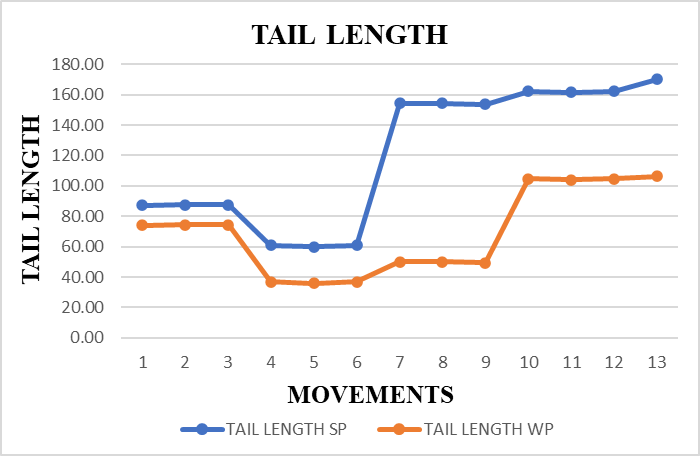
- Tail Length
The comparison graph in Figure 20 shows the queue length with and without the adaptive traffic light implementation. A notable reduction of approximately 25% is observed after the adaptation of the traffic light. This change is especially relevant on the road with the highest flow, where the implementation of the adaptive system allowed an effective response to traffic fluctuations, avoiding the accumulation of vehicles. This reduction benefits not only the mobility of the intersection under study, but also provides a management model that could be applied at other critical urban intersections, especially in cities with high vehicle density.
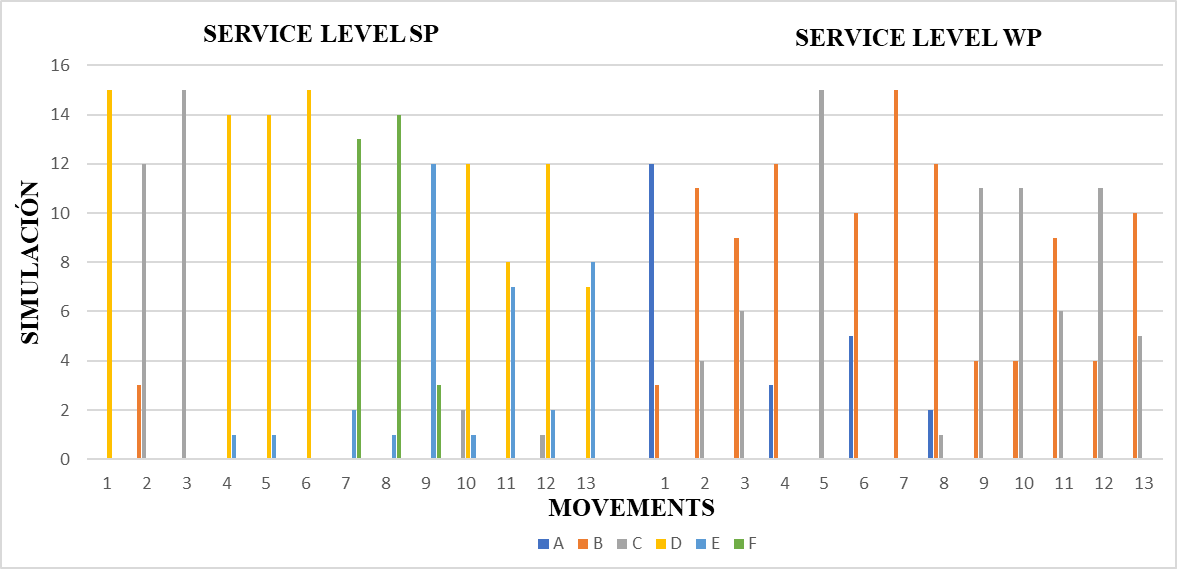
- Service Level
The improvement in the service level, which went from a level E (severe congestion) to a level D, demonstrates greater vehicular fluidity and a more satisfactory travel experience. This advance shows that the selective use of detectors on the roads with the highest demand can be an effective strategy to improve the quality of service at congested intersections, as can be seen in Figure 21. This approach is not only relevant to the context of the specific intersection, but also has the potential to be applied in different urban areas, bringing a flexible and scalable solution.
Beyond the case study, the proposed strategy demonstrates scalability potential. The selective use of detectors can be adapted to intersections with different geometric layouts, traffic volumes, or mobility priorities, provided that local calibration is carried out. This flexibility makes the approach applicable not only in Lima but also in other Latin American cities facing congestion in critical corridors. In this sense, the methodology could serve as a reference for implementing adaptive traffic lights in diverse urban contexts.
8. Validation of results
To validate the effectiveness of the results obtained with the VISSIM software, a null hypothesis statistical test of equality of means was applied, using a significance level of 0.05. The analysis was carried out using the StatKey tool, comparing the values of delay and queue length before and after the implementation of the adaptive traffic light system. This procedure, similar to the calibration and validation process, required that the mean differences be located outside the Gaussian bell (right and left tails) of the distribution, which would show a statistically significant difference (Figures 22, 23 and 24). The results were contrasted with field observations, confirming that the effects of the implementation are reflected in real traffic conditions and that they can be replicated in different urban environments.
Figure 22 shows the validation of the delay for section 1, where the mean difference obtained (0.97) exceeds the estimated value in VISSIM and is outside the distribution campaign. This confirms that the proposal generates a statistically significant effect, since this difference exceeds the range of the tails (-0.542 and 0.558), supporting the effectiveness of the adaptive system.
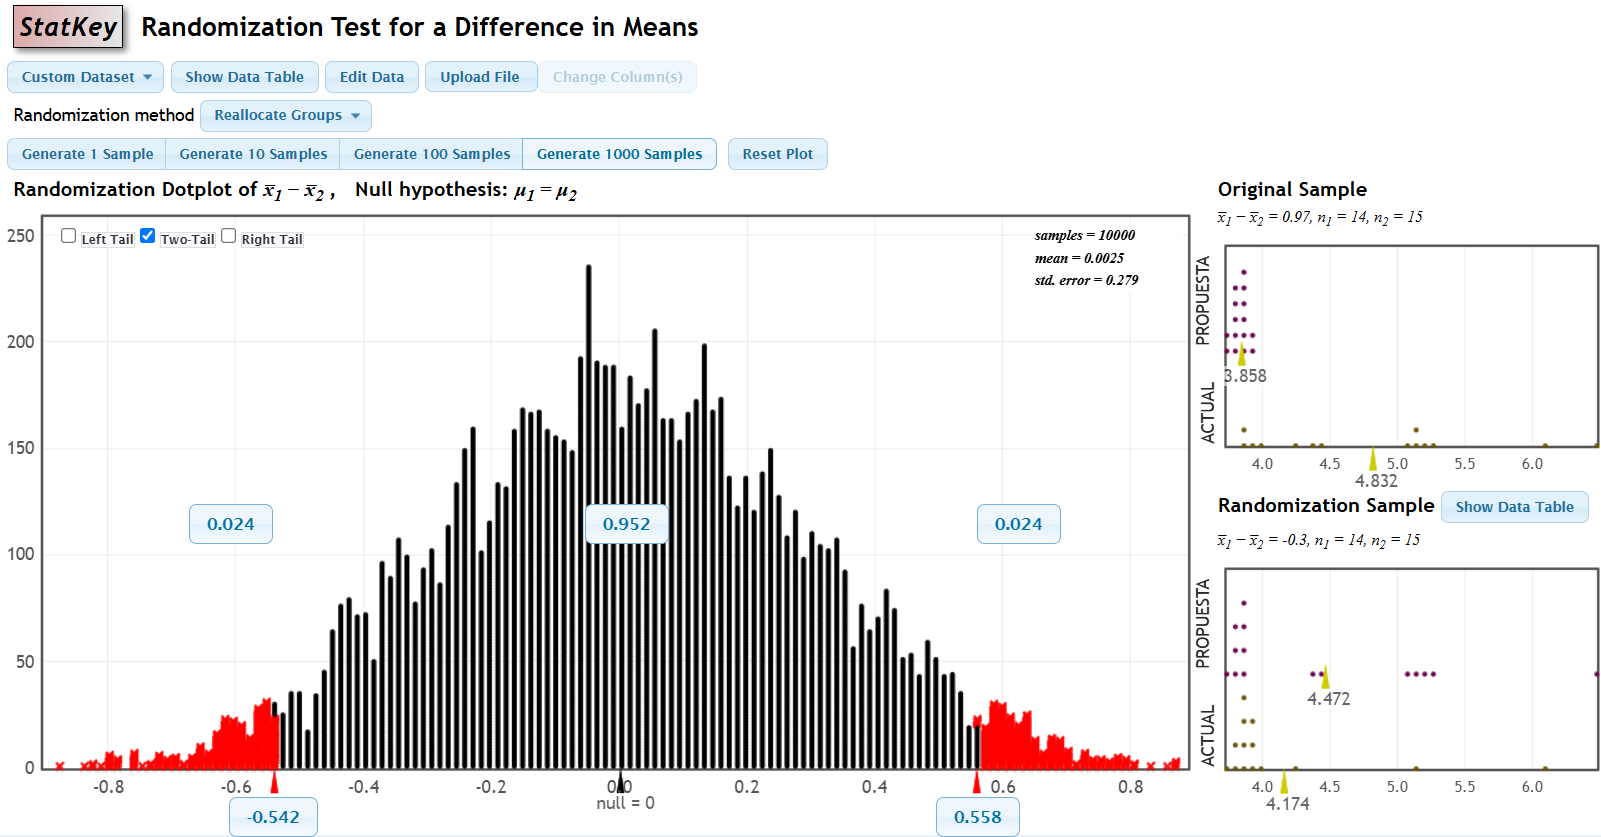
Figure 23 shows the validation of the delay for section 2, where the mean difference was 1.22, greater than that obtained in VISSIM and located outside the distribution campaign. This result also demonstrates statistical significance, given that the value exceeds the range of the tails (-0.529 and 0.544), reinforcing the effectiveness of the proposed approach.
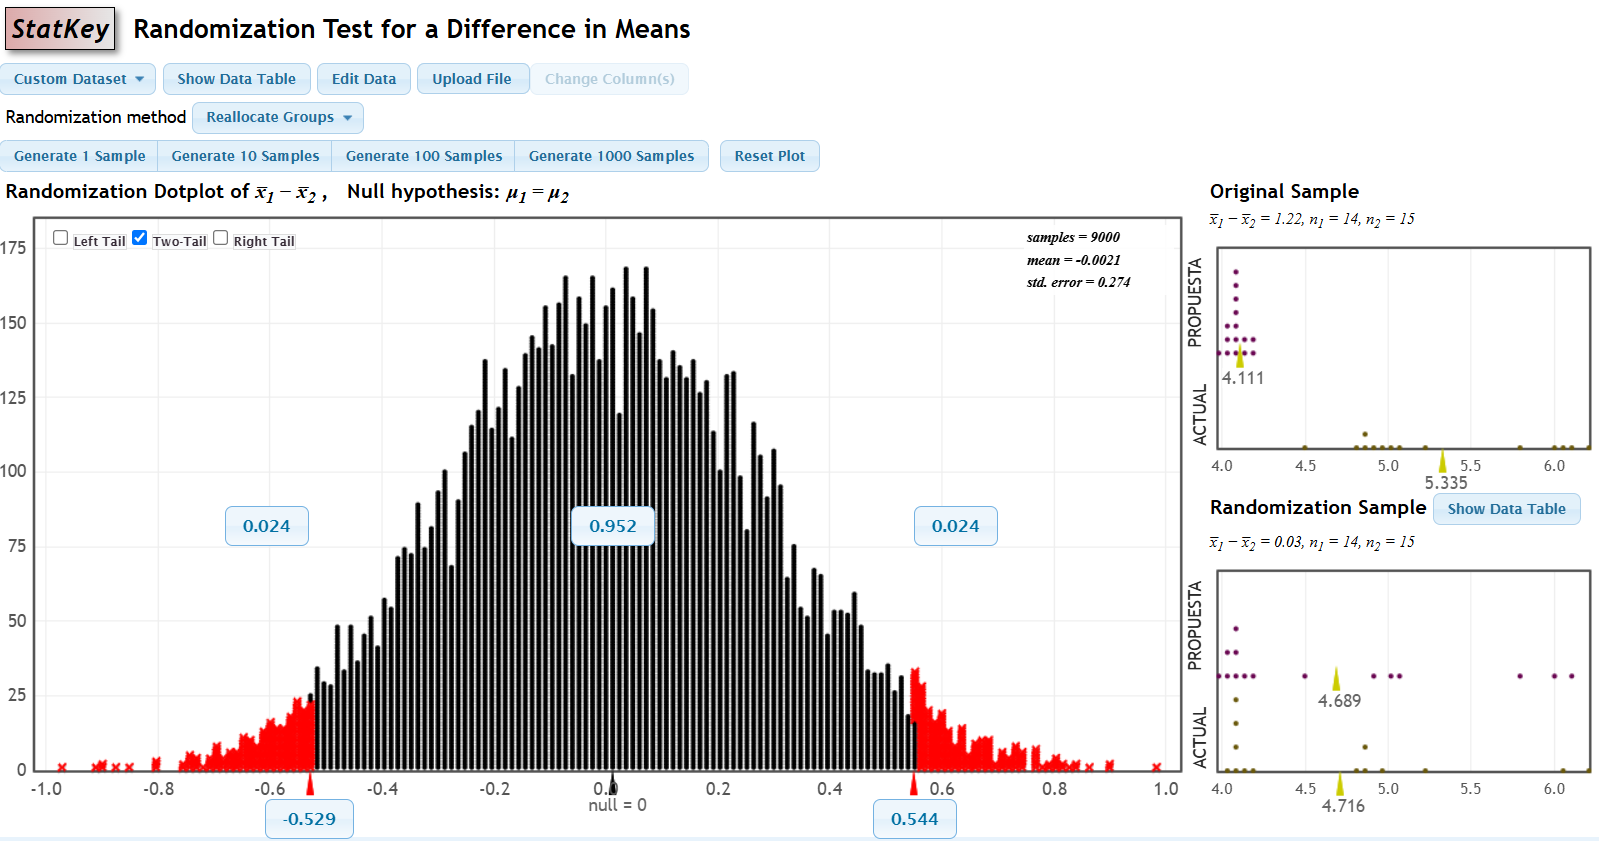
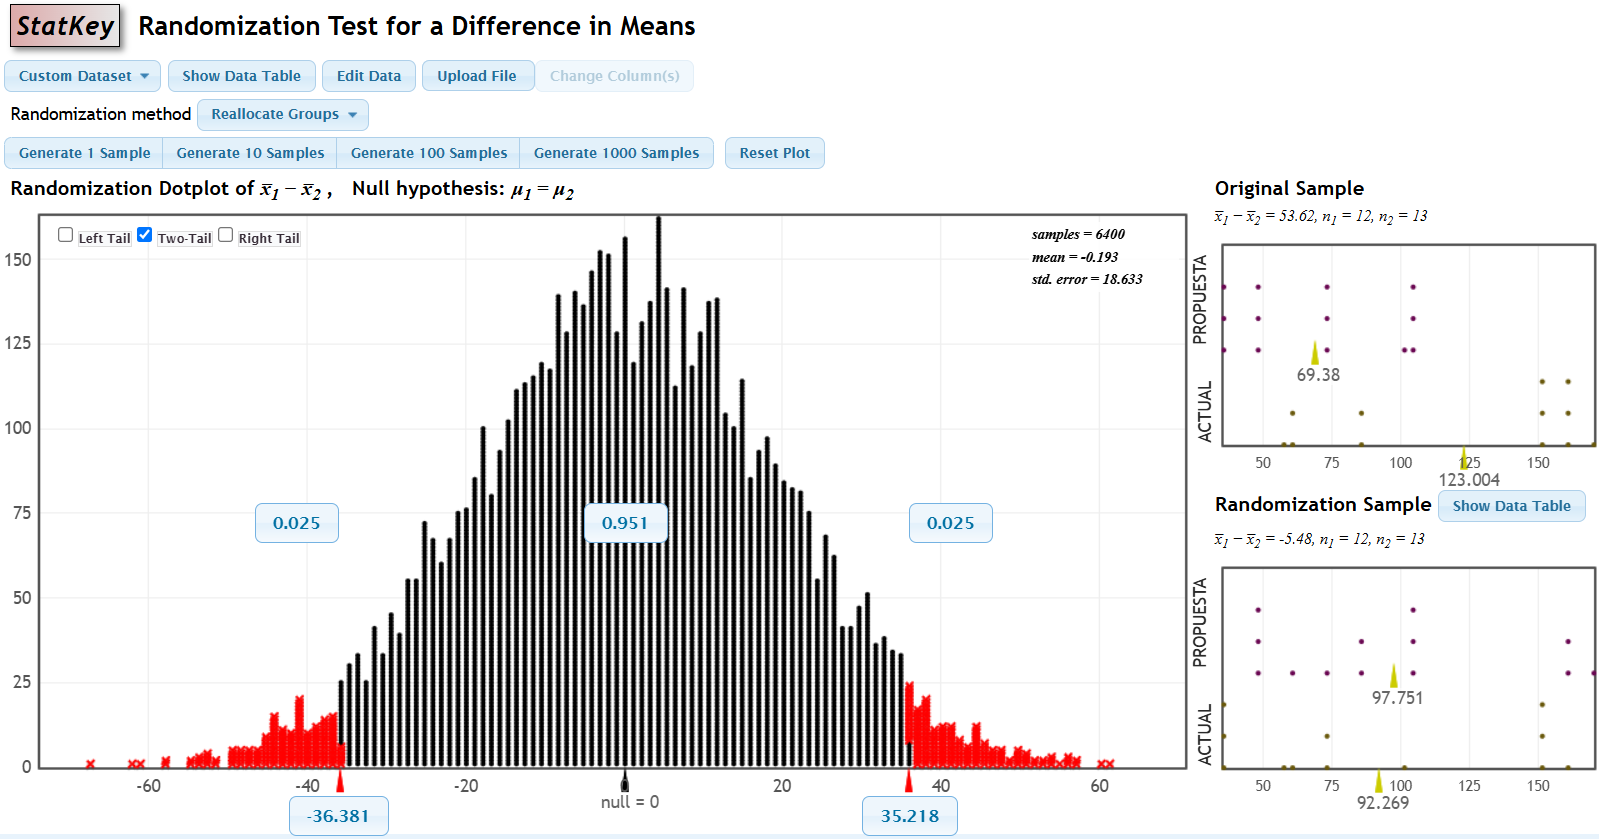
Figure 24 shows the validation of the tail length for the 13 movements, with a mean difference of 53.62, clearly higher than the value calculated in VISSIM and outside the distribution bell. When overcoming the queue range (-36,381 and 35,218), it is evident that the effect is statistically significant, confirming the efficiency of the strategy in reducing queues.
- Consistency of Results
Simulation and field data showed consistent reductions in delay and queue length, supporting the adaptive system's accuracy and ability to effectively adjust to real-time traffic flow. In addition, it was shown that, with an adequate configuration of detectors on the most congested roads, it is possible to optimize the traffic light cycle without the need to intervene all accesses, which represents an advantage in terms of resource savings and operational efficiency.
- Adaptability of Approach
The validation of the results not only demonstrates the effectiveness of the system in the case study, but also suggests an adaptable approach to various urban configurations. The consistency between the simulated and observed data indicates that the strategy based on the selective use of detectors can be implemented in other cities with similar congestion problems. This adaptability reinforces the practical value of the proposal and its applicability at intersections with high vehicular demand.
8. Conclusion
To mitigate traffic congestion issues, this research implemented an adaptive traffic light programmed into VisVap, improving the operation of a previously managed intersection with a fixed traffic light that presented deficiencies. Additionally, specific strategies were designed for the use of detectors in critical lanes, with the aim of improving important indicators such as delay, queue length, and service level. The results indicated that, compared to the current traffic light cycle, the adaptive traffic light achieved improvements of 19.03% and 22.11% in sections 1 and 2, respectively. As for the tail lengths of the thirteen movements of the intersection, an average improvement of 42.30% was recorded. A significant increase in service levels was also observed: level A increased by 22 points, level B by 103 and level C by 70, with no records at levels D, E and F. These results show that the implementation of the adaptive traffic light at the intersection studied allowed to reduce traffic congestion, improving the indicators evaluated and facilitating a more efficient flow for users.
One of the future areas of work is to evaluate the performance of the VisVAP algorithm. It should be noted that its coding has been effective, managing to properly prioritize vehicles on Benavides Avenue. It is recommended to adjust the logical sequence of the traffic light to include additional variables that prioritize public transport, thus improving the accuracy and functionality of the model.
While the theoretical analysis is mainly focused on one intersection, the adaptive traffic light proposed in this study could be applied to other road intersections with similar characteristics, as the results of this research offer useful data to address traffic problems in these areas. In the future, it is also planned to improve the detectors through the use of information prediction and machine learning, especially focused on intersection networks. Other professionals in this field are invited to continue researching to contribute to the improvement of traffic in the country.
From a practical perspective, the results obtained can support decision-making by local traffic authorities and municipalities. Since the proposed model reduces the need for multiple sensors, it represents a cost-efficient alternative, particularly relevant for cities with limited budgets. By prioritizing detector installation only in critical lanes, municipalities could progressively implement adaptive traffic control without large infrastructure investments, achieving significant improvements in mobility and safety with fewer resources.
References
[1] Statista, "Número de horas perdidas por año en el tránsito vehicular de algunas ciudades de América Latina en 2023. Tom Tom Trafic. Accessed: Apr. 4, 2024. [Online]. Available in: View Article
[2] G. Zhang, F. Chang, J. Jin, and H. Huang, "Multi-objective deep reinforcement learning approach for adaptive traffic signal control system with concurrent optimization of safety, efficiency, and decarbonization at intersections," Accident Analysis & Prevention, vol. 199, pp. 107451, 2024. doi: 10.1016/J.AAP.2023.107451. [Online]. Available in: h View Article
[3] E. F. Grumert and I. Pereira, "Heads-up green in connected traffic signals," IEEE Transactions on Intelligent Transportation Systems, vol. 23, no. 12, pp. 23334-23345, 2022. doi: 10.1109/TITS.2022.3197919. [Online]. Available in: View Article
[4] Y. Han, M. Wang, and L. Leclercq, "Leveraging reinforcement learning for dynamic traffic control: A survey and challenges for field implementation," Communications in Transportation Research, vol. 3, pp. 100104, 2023. doi: 10.1016/j.commtr.2023.100104. [Online]. Available in: View Article
[5] F. Zhao, L. Fu, X. Pan, T. J. Know, and M. Zhong, "Investigating the effect of network traffic signal timing strategy with dynamic variable guidance lanes," Sustainability, vol. 14, no. 15, pp. 9394, 2022. doi: 10.3390/su14159394. [Online]. Available in: View Article
[6] N. Kumar, S. Rahman, and N. Dhakad, "Fuzzy inference enabled deep reinforcement learning-based traffic light control for intelligent transportation system," IEEE Transactions on Intelligent Transportation Systems, vol. 22, no. 8, pp. 4919-4928, 2020. doi: 10.1109/TITS.2020.2984033. [Online]. Available in: View Article
[7] D. Singh, T. Ameen, and A. Ahmad, "Analysis of delay and queue length variation at three-leg signalized intersection under mixed traffic condition," Innovative Infrastructure Solutions, vol. 6, no. 2, pp. 12, 2021. doi: http://dx.doi.org/10.1007/s41062-021-00493-1. [Online]. Available in: View Article