International Journal of Civil Infrastructure (IJCI)
ISSN: 2563-8084

Volume 4 - Year 2021- Pages 144-156
DOI: 10.11159/ijci.2021.018
Calibration of the Simple Rainfall Simulator for Investigating Soil Erodibility in Unpaved Roads
Esdras Ngezahayo*, Michael Burrow, Gurmel Ghataora
Department of Civil Engineering, School of Engineering, University of Birmingham, UK.
EXN396@alumni.bham.ac.uk, m.p.n.burrow@bham.ac.uk, g.s.ghataora@bham.ac.uk
Abstract - Rainfall simulators have been used for erosion research for more than 50 years now. These are widely used in agricultural soils to assess the infiltration capacity and porosity of soils, and hence learn lessons on the potential of plant roots to penetrate those soils. Recently, rainfall simulators have been very useful to investigate soils detachment by both the raindrops kinetic energy and the subsequent flow shear stress. This has led to notable advances in the understanding of the failure of infrastructures such as unpaved roads due to surface soil loss and formation of erosion features, buried pipes and facilities due to removal of fill materials, as well as bridge scour and embankments failures to mention a few. To help conduct a thorough and rigorous research, rainfall simulators must produce raindrops of the same size as those produced by the natural rainfall. Calibrating rainfall simulators satisfying this key demand of raindrops sizes in the range of 1 mm to 6 mm posed challenges for years, and therefore led to inconsistencies in results from different studies. In this paper, an economical rainfall simulator which can be used for assessing erodibility of soils in unpaved roads was developed. The flour method technique was used to determine the sizes of the raindrops. The mean raindrops sizes were found to be 3.0 mm, 3.2 mm, and 3.5 mm, respectively for the rainfall intensities of 30 mm/hr, 51 mm/hr and 68 mm/hr falling through 2.0 m. In the same order of rainfall intensities, raindrops hit the surface of the tested surfaces by 193.5 µJ, 244 µJ and 301 µJ kinetic energies, which were sufficient to initiate detachment in soils of D50 ranging from about 0.4 mm to 1.5 mm compacted to maximum dry density.
Keywords: Rainfall simulator, flour method, drop size and energy, erosion, erodibility.
© Copyright 2021 Authors - This is an Open Access article published under the Creative Commons Attribution License terms. Unrestricted use, distribution, and reproduction in any medium are permitted, provided the original work is properly cited.
Date Received: 2021-03-15
Date Accepted: 2021-07-05
Date Published: 2021-08-04
1. Introduction
Rainfall erosion is certainly the most deteriorating agent of unpaved roads. The starting point of the rainfall erosion is no other than the surface soil particles detachment by the raindrops’ kinetic energy and probably by subsequent flow shear stresses. After detachment, rainfall erosion is completed by transport and deposition of detached particles by both splash and flow velocity. Soils exert different potentials to resist detachment. This intrinsic resistance of the soils to both the raindrops kinetic energy and the shear stresses is called the soil erodibility, which defines the rate of erosion for a given soil. The simulated rainfall has been used widely to investigate the susceptibility of soils to erosion, mainly for agricultural soils [1-3]. Two types of rainfall simulators exist based on the way raindrops are generated. These are the drop-forming simulators and the pressurized simulators. A comparison between the two is shown in Table 1. Each of these has its merits and demerits but have both been used successfully used for erosion studies. To develop good understanding on the erodibility of soils in unpaved roads, it is an imperative necessity to use a rainmaker device that can mimic sizes of the natural raindrops, and thus the effect of the natural rainfall on the detachment of soil particles at the surface of unpaved roads. The severity of erosion roads depends on how much soil detachment is caused by both raindrops’ kinetic energy and the shear stress from the subsequent flow. The design and calibration of an adjustable rainfall simulator that can be adjusted to simulate raindrops for a climates and regions to be studied. The use of rainfall Intensity – Duration – Frequency (IDF) curves for different regions can help to check the accuracy of a rainfall simulator. Deliberately, the example IDF curves from the Central and Eastern Africa region (Democratic Republic of Congo and Rwanda) [4-6] which could represent the natural rainfall intensities and drop sizes in Sub-Saharan Africa, and probably in most of the tropical region where unpaved roads are predominant were used [7].
Table 1. Comparison between drop-forming and pressurised simulators.
|
Drop-forming simulators |
Pressurised simulators |
|
|
Merits |
Suitable for small plots (< 10 m2) and hence suitable for laboratory works due to limited spaces [8]. High spatial uniformity of raindrops (> 90%) and easy control on drop size are attainable [2-3]. The raindrops of natural rains are reproducible (1 mm - 6 mm) [1], [9]. The raindrops fall by gravity force [1]. |
Suitable for laboratory and field tests, and performance for wider plots (10 – 500 m2) [8], [10]. Variable rainfall and random raindrop sizes, with spatial uniformity of raindrops greater than 80% [3]. Can reproduce natural raindrops sizes. Maximum drop size and kinetic energy achievable for the heights less than 4 m [2], [8]. Portable and high resistance to wind effect [10]. |
|
Demerits |
Low rainfall intensities while drops form at lower heights [11]. Difficulty to achieve terminal velocities and kinetic energy of raindrops [1]. About 9 m needed to achieve maximum drop sizes and kinetic energy [2], [8]. |
Higher rainfall intensities (> 200 mm/hr) than naturally occurring rainfall can be achieved [3]. Drop velocities can be exaggerated due to water pressure [11]. Challenging control of drop sizes if greater water pressures are required [10]. |
|
Limits in operation |
Mostly stationary, perform poorly in windy areas leading to difficulty for field use [3]. |
May need to be powered by pumps and generators to help raindrops fall at desired velocities [3]. |
2. Methods and Materials
Three rainfall intensities of 30 mm/hr, 51 mm/hr and 68 mm/hr were used in this research. These were chosen deliberately based on IDF curves from countries of the Central and Eastern Africa, a region in the Sub-Saharan Africa where about 80% of the road networks are unpaved [9], [12-14] and thus in much need to control erosion in these roads. Using the flour method to determine the size of the raindrops [3], [7], [15-17], the drop sizes of 3 mm, 3.2 mm, and 3.5 mm were found, leading to the kinetic energy from the raindrops of 193.5 µJ, 244 µJ and 301.1 µJ, respectively for 30 mm/hr, 51 mm/hr and 68 mm/hr rainfall intensities. The sizes of the raindrops were satisfactory to initiate erosion of soils of 0.4 mm < D50 < 1.5 mm [18], which were found appropriate at the surface of unpaved roads [9]. Importantly, the obtained raindrop sizes satisfied the range of the natural rainfall drops sizes (1.0 mm to 6.0 mm), as reported in previous studies [15] [19-27]. In this study, a pressurized type of rainfall simulator is designed and calibrated for effectively conducting laboratory erosion tests. According to Horne [3], the calibration process consists of the design and assembly of the device, design of the rainfall intensity, determination of the raindrops’ sizes using the flour method, determination of the raindrops’ kinetic energy and performance evaluation for the rainfall simulator.
2.1. Design and assembly of the rainfall simulator
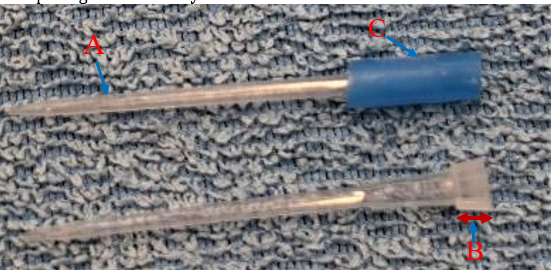
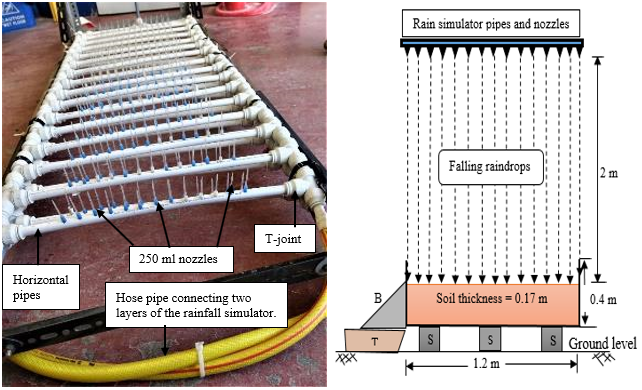
The first step towards proper design of the rainfall simulator was the selection of the rainfall nozzles and the pipes that would continuously feed water to the nozzles. The rainfall simulator was made of pipes horizontally laid over the width of the tested soil. The pipes were perforated to make 6 mm diameter holes and downward nozzles were inserted into the pipe holes to help drops formation. The nozzles were carefully and manually inserted into the holes. Since the nozzles weight would increase once filled with water, smaller nozzles were preferred to avoid the likelihood of them coming off due to increased weight. Thus, 250 ml nozzles and 15 mm x 1.5 mm BARRIER PE-X pipes [28] were chosen for the construction of the rainfall simulator. The use of small pipes and small nozzles also minimized the amount of water converted into rainfall, leading to an economical system. The study was conducted into the Civil Engineering laboratory, University of Birmingham, and water to be converted into rainfall was supplied from the water tap to the rainfall simulator. However, the bottoms of nozzles were not in a shape that would allow to insert them into the pipe holes securely. Thus, the original bottoms were cut off and the rest of the nozzles were inserted into the new bottoms made from a nylon 6 x 4 pipe, as shown in Figure 1. To maximize the number of raindrops falling on the tested surface, the spacing between nozzles on the same pipe was made 2.3 cm centre to centre, while the spacing between any two successive pipes was made 5 cm. Also, the T-joints between horizontal pipes allowed 10 cm spacing, which was double of the designed spacing between horizontal pipes. Thus, it was necessary to superimpose two layers of pipes and connect these using a crossing hose pipe at one end to ensure an even supply of water in both layers. Details of the steps discussed above are shown in Figure 2. Finally, throughfall height of the raindrops of 2 m above the soil samples was deemed enough to help produce sufficient drop sizes and kinetic energy [2], [29].
2.2. Design of the simulated rainfall intensity
The rainfall simulator designed in this study is primarily to help study erodibility of soils at the surface of unpaved roads. For this reason, rainfall intensities more representative of the regions with high percentages of those roads are reasonably used for calibration and testing purposes. Ultimately, rainfall intensities from Rwanda and Democratic Republic of Congo in the Sub-Saharan Africa were preferred. These could also be applicable in most of tropical countries. According to [4-6], the rainfall intensities of 30 mm/hr, 51 mm/hr and 68 mm/hr can occur for about 60 min, 35 min and 21 min respectively every 2 years in the selected region. This could also be read on the IDF curves from KARAMA hydrological station in Rwanda, as shown in Figure 3.
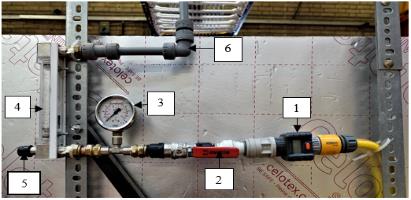
However, since the water tap was the only possible source of water to feed the rainfall simulator, ways of increasing the flow rate that reached the rainfall simulator and converted into the raindrops were necessary. As shown on Figure 4, a flow control zone was designed by provision of two flowmeters which are the GARDENA® flowmeter (1) to indicate the flowrate directly from the water tap and the COLE-PALMER® flowmeter (4) with its valve (5). The open-close movements of the valve could help to introduce air into the flow and therefore to increase flowrates that satisfied the size of the rain simulator for all the target rainfall intensities. As it was expected, the introduction of air caused lots of oscillations of the flow meter’s bob to the point that it was a bit difficult to record precise reading of the flow rate for a given rainfall intensity. For this reason, a pressure gauge (3) was added between the two flow meters and rainfall intensities were accurately calibrated based on the three devices. The main valve (2) served to close the flow temporarily between the supply water tap and the rainfall simulator whenever needed while the pipe (6) conveyed water to the rainfall simulator. Using the tap flow rate from GARDENA® flowmeter, aired flow rate from COLE-PALMER® flowmeter and tap water pressure from the pressure gauge, the calibration for target rainfall intensities was achieved as shown in Figure 5. Readings of flow rates from the two flow meters and the water pressure should be checked at the same time and help to get the corresponding rainfall intensity before starting each erodibility test.
2.3. Determination of the raindrops’ size
The size of the raindrops can be determined using various methods such as the stain method, the momentum method, the immersion method, the oil method, the photographic method, and the flour method [16]. According to Horne [3] and Ricks et al. [17], the stain method relates the stain on absorbent surfaces such as filter and blueprint papers to the diameter of the raindrops. Contrary, the momentum method uses both pressure transducers and piezoelectric sensors to determine the raindrops’ sizes while immersion method uses collection of raindrops into an oil where they are surrounded by oil due to its low density their diameters determined using a microscope [3], [16]. The oil method uses a specific type of oil with low density and a high viscosity, which helps to take photographs of the raindrops enveloped by the oil. Raindrop’s diameters are determined from these photographs [3]. Although the photographic method can accurately give a quick measurement of the size and shape of the raindrops, the method not only requires expensive equipment but also fails to produce a good raindrop distribution [17]. Finally, the flour method consists of collecting raindrops in pans that contain plain flour and the drops’ diameters are determined from the pellets formed by water and flour reaction [3], [17].
2.4. Flour Method for determination of the raindrops’ sizes
This method for raindrops’ sizes determination was developed by Bentley in 1904 [15-16]. Apart from being simple and cost effective, the method is preferred for its ability to reproduce the spherical shape and sizes of natural raindrops [3], [17]. Raindrops were collected in pans of about 21 cm diameter which were filled a 2.5 cm thick layer of plain flour from Tesco’ supermarket. Three evenly spaced pans were placed at 30 cm above the ground and below the rainfall simulator for each of the three target rainfall intensities (30, 51, and 68 mm/hr) for 3 seconds. The position of the pans referred to the targeted position of the surface soil to be tested. As the rainfall hit the flour in the pans, wet pellets were formed. The pans were placed in the open air for 12 hours for the pellets to dry out. Using a small spoon, air-dried pellets were carefully separated from the rest of the flour before being manually sieved on the 0.213 mm sieve to remove the excess flour. Double pellets formed due to close falling raindrops were removed and disregarded. The remainder of pellets were then placed in an oven set at 43 oC for 6 hours, then sieved for 2 minutes, on a sieve analysis test set of 4.75 mm, 2.36 mm, 2.00 mm, 1.18 mm, 0.85 mm, 0.60 mm, and the pan. After sieving, the pellets retained on each sieve were weighed and counted, and the mean diameter of the raindrops was calculated using Equation 1.
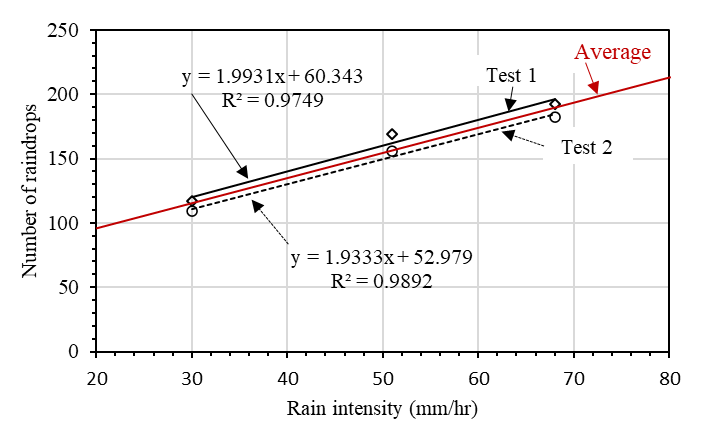
where Dr is the mean raindrops’ diameter (mm) and W is the mean weight of the raindrops (mg) and mR is the ratio of the mass of the raindrop to the mass of the pellet which is obtained using the flour-calibration line suggested by Laws and Parsons [15]. Figure 6 shows the raindrops collection into the flour and the dried pellets after sieving. The average numbers of the raindrops from two tests for each of three rainfall intensities of 30, 51, and 68 mm/hr were respectively 113, 163 and 187 raindrops. An obvious linear relation between rainfall intensity and number of drops was noted, as shown in Figure 7.
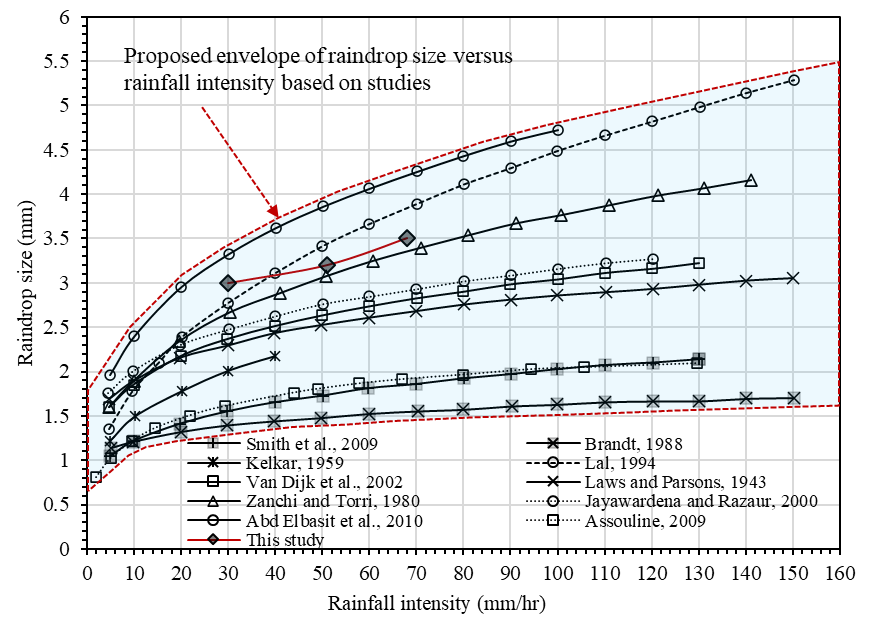
The weights of dry pellets obtained during the sieve analysis test were 1.72, 2.87, and 3.66 grams respectively for rainfall intensities of 30, 51, and 68 mm/hr. By dividing the weights by the number of pellets, the average weights of the pellets were 15.2, 17.6, and 19.6 milligrams, respectively. According to Laws and Parsons [15], the ration of the mass of the raindrop to the mass of the pellets (mR) are approximately 1.1, 1.11 and 1.12. Equation 1 was then applied, leading to the mean raindrop size (Dr) of 3.0, 3.2, and 3.5 mm of diameter, respectively for the 30, 51 and 68 mm/hr rainfall intensities. The number of raindrops and the mean raindrop size increased with the increasing rainfall intensity, which agrees with previous studies, as shown in Figure 8.
2.5. Determination of kinetic energy from simulated rainfall
The purpose of determining the raindrops’ sizes was to determine the kinetic energy embodied in the raindrops, which is responsible for soil detachment and erosion. The relation used to obtain the rainfall’s kinetic energy is given in Equation 2.
where KE is the kinetic energy (J); m is the mass of the raindrop (kg); and v is the terminal velocity (m/s) at which the drop hits the soil surface.
The mass of the raindrops was calculated from the bulk density relationship which is given by the ratio of mass to the volume. Thus, the mass of the raindrop was calculated as follows:

where ρ is the density of water (mg/mm3); and V the volume of the raindrop (mg/mm3).
Assuming the spherical shape of the raindrops, the volume of individual raindrops was calculated as the volume of the sphere with the same diameter as in the next relation:
where V is the volume of the raindrop (mm3); and Dr the raindrop diameter (mm).
Using Equations 3 and 4 and keeping in mind that the density of water is equal to 1mg/mm3, the mass of an individual raindrop was found to be 14.13 mg, 17.15 mg, and 22.1 mg respectively for the 30 mm/hr, 51 mm/hr and 68 mm/hr simulated rainfall intensities. After determining the mass for individual raindrops, the next step was to obtain the terminal velocity to be able to apply Equation 2. This was achieved by using ASTM’s chart [29] that correlates the fall velocity, fall height and raindrop diameter as shown in Figure 9. In this study, a fall height of 2 m was used in the experimental set up. At this height, the fall velocities were estimated 5.2 m/s, 5.21 m/s and 5.22 m/s respectively for the raindrops of the 30 mm/hr, 51 mm/hr and 68 mm/hr simulated rainfall intensities. Consequently, and by application of Equation 2, the kinetic energy from individual raindrops was calculated as 193.5 µJ, 244 µJ and 301.1 µJ respectively for the 30 mm/hr, 51 mm/hr and 68 mm/hr simulated rainfall intensities as shown in Table 2.
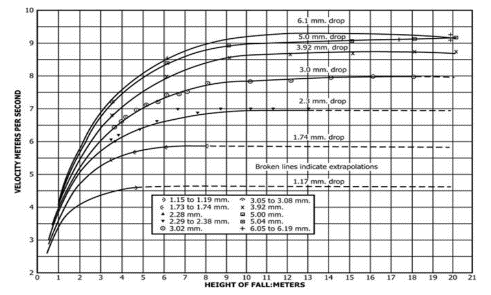
Table 2. Kinetic Energy (KE) embedded in raindrops.
|
Rainfall intensity, I (mm/hr) |
Mean size (diameter), Dr (mm) |
Volume of raindrop, V (mm3) |
Mass of raindrop, m (mg) |
Fall velocity, v (m/s) |
Kinetic Energy, KE (µJ) |
|
30 |
3 |
14.13 |
14.13 |
5.2 |
193.5 |
|
51 |
3.2 |
17.15 |
17.15 |
5.21 |
244 |
|
68 |
3.5 |
22.1 |
22.1 |
5.22 |
301.1 |
2.6. Performance of the Rainfall Simulator
According to [1], [3], [7], [17], [30], the useful coefficient of uniformity (CU) - measure of consistency of raindrops spatial distribution must be in the range of 80% to 100% for acceptable performance of a rainfall simulator. This coefficient is known as the Christiansen coefficient as the researcher introduced it first in 1942 [3]. The coefficient of uniformity was calculated by collecting simulated rainwater in 6 same-size graduated cylinders for 10 minutes and using Equation 5.
where CU is the coefficient of uniformity (%); Di is the depth of water in the graduated cylinder (cm); Dm is the mean depth of water in graduated cylinders (cm); and n is the number of graduated cylinders. Applying Equation 5, the designed rainfall simulator was performing evenly over the tested area with a coefficient of uniformity of 100%.
3. Validating the rainfall simulator for erosion testing
Since the main objective to design the rainfall simulator was to carry out a robust investigation of the erodibility of soils in rural unpaved roads, the efficiency of the device was checked by its ability to detach compacted soils appropriate for the construction of these roads. Based on the kinetic energy of the rainfalls and the mean grain size of the tested soils, it was found that the three rainfall intensities could detach these soils. Furthermore, the results from the rainfall simulator’s calibration fitted in the envelope by Salles et al. [18] relating rainfall’s kinetic energy and mean grain size of detachable soils. An additional diagram for the detachment of the soils by surface flow velocity with respect to the particle size distribution of the soils was given according to Carey and Simon [31], as shown in Figure 10. The tested soils were synthesized by mixing gravelly sandy (GS) and very gravely sandy (VGS) soils with percentages of English china clay (ECC) to simulate the variability of soils at the surface of unpaved roads in terms of particle size distribution as well as the required plasticity index at the surface of unpaved roads of about 2% to 12% [7, 9, 32], as shown in Table 3.
Table 3. Properties of the tested soils.
|
Soil type / Properties |
GS |
GS+5% ECC |
GS+10% ECC |
GS+15% ECC |
GS+20% ECC |
VGS |
VGS+ 5% ECC |
VGS+ 10% ECC |
VGS +15% ECC |
VGS +20% ECC |
|
Mean grain size, D50 (mm) |
0.52 |
0.50 |
0.46 |
0.44 |
0.40 |
1.2 |
1.6 |
1.1 |
0.9 |
0.8 |
|
Plasticity index, Ip (%) |
- |
5.2 |
7.9 |
9.8 |
12.2 |
- |
4.3 |
5.7 |
7.6 |
9.1 |
|
Maximum dry density, ϕ (Mg/m3) |
1.82 |
1.94 |
1.96 |
2.04 |
2.10 |
1.89 |
2.05 |
2.21 |
2.24 |
2.25 |
4. Typical results from erosion tests
Using the calibrated rainfall simulator, over 200 erosion tests were undertaken during a thorough study on erodibility of geomaterials in unsealed roads. Tables 4 and 5 provide results for eroded sediment and erosion rate respectively at 5-minute time intervals for the 30-minute rainfall. Deliberately, results for three soils (GS + 5%, GS + 10% and GS + 20%) tested using simulated rainfall intensities of 30 mm/hr, 51 mm/hr, and 68 mm/hr and two bed-slopes of 0% and 6% are presented. Soil samples were compacted in two testing boxes of 0.6m x 0.3m x 0.17 m and 1.2 m x 0.3m x 0.17 m (length x width x thickness) for small-scale (Ss) and large-scale (Ls) respectively. Runoff containing eroded sediment was collected and weighed at 5-minute time intervals for 30-minute. Amongst several types of analysis, runoff was oven-dried to retain dry sediment which was weighed and used to calculate erosion rate with respect to testing conditions. Erosion rate is the measure of erodibility given by the ratio of dry sediment over eroded area per unit time. Generally, the results agreed with previous studies [7-9], [19] and highlighted the key elements governing understanding of erodibility of soils in unpaved roads, as can be observed in Tables 4 and 5. These elements are:
- Higher rainfall intensity (or greater kinetic energy) leads to more erosion.
- Peak soil detachment is achieved in about 10 to 15 minutes from start of the rainfall.
- Increases in plasticity index and clay content reduce erosion.
- Increases in slope length and slope gradient increase erosion.
- Erosion rate is more dependent on the rainfall intensity and the area of the tested surface rather than the slope length. Thus, it is possible to have higher erosion rate values for shorter slopes than for longer slopes.
Table 4. Collected sediment from erosion tests at 5-minute time intervals for a 30-minute rainfall.
|
Time intervals (min) |
Large Scale (Ls): GS + 20% ECC |
Small Scale (Ss): GS + 20% ECC |
||||||||||
|
30 mm/hr |
51 mm/hr |
68 mm/hr |
30 mm/hr |
51 mm/hr |
68 mm/hr |
|||||||
|
Slope |
Slope |
Slope |
Slope |
Slope |
Slope |
|||||||
|
0% |
6% |
0% |
6% |
0% |
6% |
0% |
6% |
0% |
6% |
0% |
6% |
|
|
|
Weight of collected sediment (g) |
|||||||||||
|
5 |
27.8 |
70.4 |
54.9 |
146.3 |
40.8 |
221.1 |
10.3 |
13.1 |
20.3 |
39.0 |
19.0 |
29.0 |
|
10 |
44.7 |
88.0 |
57.2 |
159.2 |
45.0 |
231.2 |
16.1 |
20.3 |
26.1 |
51.3 |
52.9 |
57.8 |
|
15 |
32.9 |
77.0 |
43.7 |
125.0 |
58.6 |
206.9 |
16.7 |
21.0 |
39.7 |
68.8 |
48.6 |
64.4 |
|
20 |
32.4 |
72.4 |
37.1 |
123.9 |
54.4 |
199.6 |
14.8 |
18.0 |
37.8 |
60.0 |
43.1 |
53.4 |
|
25 |
30.4 |
65.7 |
32.2 |
116.9 |
52.3 |
196.8 |
14.5 |
14.0 |
34.5 |
57.3 |
41.4 |
44.7 |
|
30 |
29.0 |
62.0 |
30.9 |
111.7 |
48.7 |
192.5 |
12.2 |
13.0 |
32.2 |
54.6 |
40.0 |
43.8 |
|
Large Scale (Ls): GS + 10% ECC |
Small Scale (Ss): GS + 10% ECC |
|||||||||||
|
5 |
54.6 |
96.6 |
97.7 |
171.5 |
163.2 |
287.8 |
33.5 |
69.5 |
53.5 |
91.0 |
101.2 |
212.4 |
|
10 |
121.6 |
142.0 |
142.7 |
147.8 |
199.7 |
300.1 |
49.9 |
93.0 |
69.9 |
137.1 |
146.3 |
254.8 |
|
15 |
90.5 |
113.1 |
90.1 |
133.4 |
158.1 |
278.2 |
45.3 |
88.0 |
65.3 |
130.2 |
117.0 |
149.1 |
|
20 |
82.3 |
105.1 |
76.7 |
113.7 |
135.5 |
224.3 |
42.3 |
76.0 |
62.3 |
128.9 |
106.8 |
138.8 |
|
25 |
78.1 |
97.7 |
71.7 |
109.8 |
109.3 |
214.1 |
40.6 |
61.0 |
60.6 |
109.4 |
93.8 |
124.4 |
|
30 |
72.7 |
92.4 |
66.4 |
107.2 |
103.0 |
208.3 |
47.3 |
46.0 |
57.3 |
102.8 |
83.3 |
113.4 |
|
Large Scale (Ls): GS + 5% ECC |
Small Scale (Ss): GS + 5% ECC |
|||||||||||
|
5 |
22.2 |
116.2 |
124.6 |
87.5 |
195.2 |
255.8 |
17.0 |
85.0 |
57.2 |
58.7 |
79.1 |
186.9 |
|
10 |
88.9 |
160.2 |
260.4 |
231.7 |
231.7 |
360.1 |
65.3 |
106.1 |
85.4 |
159.2 |
176.3 |
267.1 |
|
15 |
72.2 |
134.1 |
191.8 |
217.4 |
201.3 |
348.5 |
61.2 |
98.0 |
71.0 |
136.2 |
137.5 |
165.2 |
|
20 |
62.5 |
127.5 |
172.2 |
197.7 |
170.9 |
302.3 |
58.0 |
84.3 |
70.1 |
128.4 |
120.1 |
150.3 |
|
25 |
61.8 |
125.7 |
161.0 |
177.8 |
157.3 |
280.1 |
57.1 |
76.0 |
67.0 |
119.5 |
108.3 |
141.2 |
|
30 |
61.0 |
106.4 |
151.2 |
151.2 |
130.2 |
270.3 |
59.0 |
72.3 |
59.2 |
101.1 |
97.9 |
134.4 |
Table 5. Erosion rate from tested soils at 5-minute time intervals for a 30-minute rainfall.
| Time intervals (min) |
Large Scale (Ls): GS + 20% ECC |
Small Scale (Ss): GS + 20% ECC |
||||||||||
|
30 mm/hr |
51 mm/hr |
68 mm/hr |
30 mm/hr |
51 mm/hr |
68 mm/hr |
|||||||
|
Slope = 0% |
Slope = 0% |
Slope = 0% |
Slope = 0% |
Slope = 0% |
Slope = 0% |
|||||||
|
0% |
6% |
0% |
6% |
0% |
6% |
0% |
6% |
0% |
6% |
0% |
6% |
|
|
Erosion rate (kg/m2/s) |
||||||||||||
|
5 |
0.001 |
0.003 |
0.003 |
0.007 |
0.002 |
0.010 |
0.001 |
0.001 |
0.002 |
0.004 |
0.002 |
0.003 |
|
10 |
0.003 |
0.007 |
0.005 |
0.014 |
0.004 |
0.021 |
0.002 |
0.003 |
0.004 |
0.008 |
0.007 |
0.008 |
|
15 |
0.005 |
0.011 |
0.007 |
0.020 |
0.007 |
0.031 |
0.004 |
0.005 |
0.008 |
0.015 |
0.011 |
0.014 |
|
20 |
0.006 |
0.014 |
0.009 |
0.026 |
0.009 |
0.040 |
0.005 |
0.007 |
0.011 |
0.020 |
0.015 |
0.019 |
|
25 |
0.008 |
0.017 |
0.010 |
0.031 |
0.012 |
0.049 |
0.007 |
0.008 |
0.015 |
0.026 |
0.019 |
0.023 |
|
30 |
0.009 |
0.020 |
0.012 |
0.036 |
0.014 |
0.058 |
0.008 |
0.009 |
0.018 |
0.031 |
0.023 |
0.027 |
|
Large Scale (Ls): GS + 10% ECC |
Small Scale (Ss): GS + 10% ECC |
|||||||||||
|
5 |
0.003 |
0.004 |
0.005 |
0.008 |
0.008 |
0.013 |
0.003 |
0.006 |
0.005 |
0.008 |
0.009 |
0.020 |
|
10 |
0.008 |
0.011 |
0.011 |
0.015 |
0.017 |
0.027 |
0.008 |
0.015 |
0.011 |
0.021 |
0.023 |
0.043 |
|
15 |
0.012 |
0.016 |
0.015 |
0.021 |
0.024 |
0.040 |
0.012 |
0.023 |
0.017 |
0.033 |
0.034 |
0.057 |
|
20 |
0.016 |
0.021 |
0.019 |
0.026 |
0.030 |
0.050 |
0.016 |
0.030 |
0.023 |
0.045 |
0.044 |
0.070 |
|
25 |
0.020 |
0.026 |
0.022 |
0.031 |
0.035 |
0.060 |
0.020 |
0.036 |
0.029 |
0.055 |
0.052 |
0.081 |
|
30 |
0.023 |
0.030 |
0.025 |
0.036 |
0.040 |
0.070 |
0.024 |
0.040 |
0.034 |
0.065 |
0.060 |
0.092 |
|
Large Scale (Ls): GS + 5% ECC |
Small Scale (Ss): GS + 5% ECC |
|||||||||||
|
5 |
0.001 |
0.005 |
0.006 |
0.004 |
0.009 |
0.012 |
0.002 |
0.008 |
0.005 |
0.005 |
0.007 |
0.017 |
|
10 |
0.005 |
0.013 |
0.018 |
0.015 |
0.020 |
0.029 |
0.008 |
0.018 |
0.013 |
0.020 |
0.024 |
0.042 |
|
15 |
0.008 |
0.019 |
0.027 |
0.025 |
0.029 |
0.045 |
0.013 |
0.027 |
0.020 |
0.033 |
0.036 |
0.057 |
|
20 |
0.011 |
0.025 |
0.035 |
0.034 |
0.037 |
0.059 |
0.019 |
0.035 |
0.026 |
0.045 |
0.047 |
0.071 |
|
25 |
0.014 |
0.031 |
0.042 |
0.042 |
0.044 |
0.072 |
0.024 |
0.042 |
0.032 |
0.056 |
0.057 |
0.084 |
|
30 |
0.017 |
0.036 |
0.049 |
0.049 |
0.050 |
0.084 |
0.029 |
0.048 |
0.038 |
0.065 |
0.066 |
0.097 |
4. Conclusion
A low-cost rainfall simulator was successfully designed, constructed, and calibrated to help investigate erodibility in unpaved roads. The device can accurately produce raindrops in the range of those observed in natural rainfalls (1-mm to 6-mm diameter). These raindrops sizes were 3.0 mm, 3.2 mm, and 3.5 mm; leading to kinetic energies of 193.5 µJ, 244 µJ and 301.1 µJ respectively for the 30 mm/hr, 51 mm/hr and 68 mm/hr rainfall intensities. The rainfall energy was enough to initiate erosion at the surface of unpaved roads, with ability to detach surface soils with up to about 4 mm diameter mean grain size. Key elements governing erodibility of soils in unpaved roads were identified based on erosion testing results. Therefore, it is an effective and efficient device to help investigate and compare erodibility of different soil materials suitable for use in the construction of unpaved roads. This not only leads to better decision making in the selection of appropriate soils for use in those roads, but also to enormous savings from the heavy maintenance burden and to the preservation of the already scarce quarries for appropriate soils. With water erosion being widely regarded as the most detrimental factor of unsealed roads, particularly in the rural areas (rural roads) of the developing countries, this study could prove to be very dependable for road engineers. They ought to detail erodibility of selected soils for use in the construction and maintenance of these roads in order to ensure that the most appropriate or the least erodible soil satisfying strength requirements is used for both the surface and base layers of the unsealed road.
Acknowledgements
Commonwealth Scholarship Commission in the UK are thanked for a PhD scholarship awarded to the first author. The School of Engineering, University of Birmingham is gratefully acknowledged for facilitating the research.
References
[1] I.D. Moore, M.C. Hirschi and B.J. Barfield, “Kentucky Rainfall Simulator,” Trans. of the Am. Society of Agr. and Biol. Eng., vol. 26, no. 4, pp. 1085-1089, 1983. View Article
[2] H. Aksoy, E. Unal, S. Cogkor, S. Gedikli, J. Yoon, K. Koca, S. Inci Boran and E. Eris, “A rainfall simulator for laboratory-scale assessment of rainfall-runoff-sediment transport processes over a two-dimensional flume,” Catena, vol. 98, pp. 63-72, 2012. View Article
[3] M.A. Horne, “Design and Construction of a Rainfall Simulator for Large-scale Testing of Erosion Control Practices and Products,” Master’s Thesis, Auburn University, 2017.
[4] B. Mohymont, G.R. Demarée and D.N. Faka, “Establishment of IDF-curves for precipitation in the tropical area of Central Africa - comparison of techniques and results,” Natural Hazards and Earth System Science, vol. 4, no. 3, pp. 375-387, 2004. View Article
[5] G.R. Demarée and H. Van de Vyver, “Construction of Intensity-Duration-Frequency (IDF) curves for precipitation with annual maxima data for Rwanda, Central Africa,” Adv. Geosc., vol. 35, pp. 1–5, 2013. View Article
[6] N. Wagesho and M. Claire, “Analysis of Rainfall Intensity-Duration-Frequency Relationship for Rwanda,” Journal of Water Resource and Protection, vol. 8, pp. 706-723, 2016. View Article
[7] E. Ngezahayo, G.S. Ghataora and M.P.N. Burrow, “Factors Affecting Erosion in Unpaved Roads,” Proc. of the 4th World Congress on Civil, Str. and Envir. Eng. (CSEE’19), Rome, April 7-9, Paper No. ICGRE 108, 2019. Available at http://avestia.international-aset.com/CSEE2019_Proceedings. View Article
[8] H. Aksoy, E. Eris and G. Tayfur, “Empirical Sediment Transport Models Based on Indoor Rainfall Simulator and Erosion Flume Experimental Data,” Land Degr. and Development, vol. 28, pp. 1320-1328, 2017. View Article
[9] E. Ngezahayo, M.P.N. Burrow and G.S. Ghataora, “The Advances in Understanding Erodibility of Soils in Unpaved Roads,” Int. Journal of Civil Infrastructure, vol. 2, pp. 18-29, 2019. DOI: 10.11159/ijci.2019.002. View Article
[10] R.W. Tossell, W.T. Dickinson, R.P. Rudra and G.J. Wall, “A Portable Rainfall Simulator,” Canadian Agricultural Eng., vol. 29, no. 2, pp. 155-162, 1987.
[11] G.J. Sheridan, P.J. Noske, P.N.J. Lane and C.B. Sherwin, “Using rainfall simulation and site measurements to predict annual interrill erodibility and phosphorus generation rates from unsealed forest roads: Validation against in-situ erosion measurements,” Catena, vol. 73, pp. 49-62, 2008. View Article
[12] A. Faiz, “The Promises of Rural Roads. Review of the Role of Low-Volume Roads in Rural Connectivity, Poverty Reduction, Crisis Management and Livability,” TRB Low Volume Roads Committee, Circular Number E-C 167, 2012.
[13] M.P.N. Burrow, R.C. Petts, M.C. Snaith, H. Evdordes and G.S. Ghataora, “Technology selection and its sustainability for low volume, rural roads in low-income countries: protocol for a systematic review (Protocol),” London: EPPI Centre, University of London, 2014.
[14] M.P.N. Burrow, H. Evdorides, G.S. Ghataora, R. Petts and M.S. Snaith, “The evidence for rural road technology in low-income countries,” Proc. ICE, 169, Issue TR6, pp. 366 – 377, 2016. View Article
[15] J.O. Laws and D.A. Parson, “The relation of raindrop-size to intensity” Trans. of the Am. Geographical Union, Papers Hydrology, pp. 453-460, 1943.
[16] J.D. Eigel and I.D. Moore, “A Simplified Technique for Measuring Raindrop Size and Distribution” Trans. of the American Society of Agricultural and Biological Engineers, vol. 26, no. 4, pp. 1079-1084, 1983. View Article
[17] M.D. Ricks, M.A. Horne, B. Faulkner, C. Zech, X. Fang, W.N. Donald and M.A. Perez, “Design of a Pressurized Rainfall Simulator for Evaluating Performance of Erosion Control Practices,” Water, vol. 11, no. 2386, 2019. View Article
[18] C. Salles, J. Poesen and G. Govers, “Statistical and physical analysis of soil detachment by raindrop impact: Rain erosivity indices and threshold energy,” Water Res. Res., vol. 36, no. 9, pp. 2721-2729, 2000. View Article
[19] V.N. Kelkar, “Size distribution of raindrops - Part II,” Indian Journal of Meteorology and Geophysics, vol. 4, pp. 323-330, 1959.
[20] C. Zanchi and D. Torri, “Evaluation of rainfall energy in central Italy,” In Assessment of Erosion, De Boodt, M., Gabriels, D. (eds), Wiley: Chichester; pp. 133-142, 1980.
[21] C.J. Brandt, “The Transformation of Rainfall Energy by a Tropical Rain Forest Canopy in Relation to Soil Erosion,” J. Biogeography, vol. 15, no. 1, pp. 41-48, 1988. View Article
[22] R. Lal, “Soil Erosion Research Methodology,” Soil Cons. Soc. Am., Ankeny, IA, 340pp, 1994.
[23] A.W. Jayawardena and R.B. Rezaur, “Drop size distribution and kinetic energy load of rainstorms in Hong Kong,” Hydrological Processes, vol. 14, pp. 1069-1082, 2000. View Article
[24] A.I.J.M. Van Dijk, A.G.C.A. Meesters and L.A. Bruijnzeel, “Exponential distribution theory and the interpretation of splash detachment and transport experiment,” Soil Science Society American Journal, vol. 66, no. 50, pp.1466-1474, 2002. View Article
[25] S. Assouline, “Drop size distributions and kinetic energy rates in variable intensity rainfall,” Water Resources Research, vol. 45, W11501, 2009. View Article
[26] J.A. Smith, E. Hui, M. Steiner, M.L. Baeck, W.F. Krajewski and A.A. Ntelekos, “Variability of rainfall rate and raindrop size distributions in heavy rain,” Water Resources Research, vol. 45, W04430, 2009. View Article
[27] M.A.M. Abd Elbasit, H. Yasuda, A. Salmi and H. Anyoji, “Characterization of rainfall generated by dripper-type rainfall simulator using piezoelectric transducers and its impact on splash soil erosion,” Earth Surf. Processes and Landforms, vol. 35, pp. 466-475, 2010. View Article
[28] BS 7291-3: 2010, Thermoplastics pipe and fitting systems for hot and cold water for domestic purposes and heating installations in buildings. Specifications for cross linked polyethylene (PE-X) pipes and associated fittings.
[29] American Standards for Testing Materials, “Standard Test Method for Determination of Rolled Erosion Control Product Performance in Protecting Hillslopes from Rainfall-Induced Erosion,” ASTM: West Conshohocken, PA, USA, 2015.
[30] E. Ngezahayo, M.P.N. Burrow and G.S. Ghataora, “Rainfall Induced Erosion of Soils Used in Earth Roads,” Proc. 7th International Symposium on Deformation Characteristics of Geomaterials, Glasgow, Scotland, United Kingdom, June 26–28, E3S Web of Conferences 92: 17006, 2019,https://doi.org/10.1051/e3sconf/20199217006. View Article
[31] W.P. Carey and A. Simon, “Physical basis and potential estimation techniques for soil erosion parameters in the Precipitation-Runoff Modelling System (PRMS),” Water Resources Investigations Report, 84-4218, 1984. Doi.org/10.3133/wri844218.
[32] E. Ngezahayo, G.S. Ghataora and M.P.N. Burrow, “Modelling the Effects of Soil Properties, Rainfall and Road Geometry to Erosion in Unpaved Roads”, Int. J. of Civil Infrastructure, vol. 4, pp. 116-127, 2021. DOI: 10.11159/ijci.2021.015. View Article