International Journal of Civil Infrastructure (IJCI)
ISSN: 2563-8084

Volume 5 - Year 2022- Pages 70-77
DOI: 10.11159/ijci.2022.010
Numerical Study of the Effect of Maximum Aggregate Size on the Ultimate Strength of Pre-tensioned Prestressed Concrete Beam
Zaher Alkurdi
Budapest University of Technology and Economics, Department of Structural Engineering
Műegyetem rkp. 3, Budapest, Hungary 1111
zaherkurdi@edu.bme.hu
Abstract - Numerical modeling is being implemented because experiments are challenging, unwelcome, costly, or time-consuming. The main goal of this research is to study the influence of the maximum aggregate size on the ultimate load of the pre-tensioned prestressed concrete beam with multiple layers of strand and shear reinforcements under flexural loading numerically. This was done by validating one finite element model based on experimental results of a standardized four-point static bending test previously reported. Subsequently, four beams with different maximum aggregate sizes were simulated using ATENA 3D software. The finite element analysis could simulate the experimental tests and provide meaningful results. Moreover, a slight increase in the ultimate load of the member was observed with a larger maximum aggregate.
Keywords: Aggregate size, Prestressed concrete, Four-point bending test, Numerical analysis
© Copyright 2022 Authors - This is an Open Access article published under the Creative Commons Attribution License terms. Unrestricted use, distribution, and reproduction in any medium are permitted, provided the original work is properly cited.
Date Received: 2022-06-21
Date Accepted: 2022-06-30
Date Published: 2022-07-05
1. Introduction
Reinforced concrete is one of the most common structural materials in civil engineering [1]. By emitting massive amounts of carbon dioxide into the atmosphere, concrete production contributes significantly to climate crisis. The two greenhouse gases most responsible for global warming are carbon dioxide and methane. Furthermore, concrete can harm the earth's most fertile layer, the topsoil [2–3].
Since the 1950s, prestressed concrete has been widely used. In pre-tensioned prestressed concrete technology, prefabrication contributes to a quicker construction process, high-quality fabrication, optimal usage of properties of applied materials, and solutions to the limitations connected with environmental issues [4]. To take use of the compressive strength of the concrete, a prestressing system is used. Prestressing compresses the concrete structure in areas where tensile stress is present. The tension created by applied loads must first relieve the compression caused by prestressing, which is done by tendons, before cracking in the concrete can develop [5]. When reinforced with steel, concrete can bear significant tensile loads while also exhibiting excellent ductility, allowing structural elements to fail in a ductile manner with extensive plastic deformation when overloaded. This type of failure is known as a flexural failure and is widely used in the design of a structural element because it can provide sufficient warning before failure. When specific design standards are followed, this behavioral response can be correctly predicted. To investigate the properties and behavior of materials with structural applications and to establish design specifications, the four-point static bending test is used.
In civil engineering, numerical modeling has made significant progress. Numerical modeling is also used in design because experiments can be difficult, expensive, and time-consuming [6]. Furthermore, model predictions and experimental testing are very similar. As for modeling a pre-tensioned prestressed concrete beam, the most common user-friendly software packages for the nonlinear analysis of reinforced concrete structures are ATENA 3D, ANSYS, and ABAQUS. In particular, ATENA 3D, based on advanced constitutive models, can effectively support and extend experimental investigations for innovative solutions in the field of prestressed concrete members. The crack-band approach employed for tensile and compressive softening avoids the finite element (FE) mesh sensitivity of the solution.
Yapar et al. [7] created a nonlinear FE model using ABAQUS software for pre-tensioned prestressed concrete beams. The modeling and simulation results were quite close to the test results and provided a good explanation of how such beams behave. Doi et al. [8] simulated a vertical compression test by 2D FE analysis software to clarify the mechanism of compression deformation of the soilbags. The results of the numerical simulation coincided with almost the same as those of the experimental test, showing the high applicability of the numerical method.
Furthermore, using ATENA 2D software, Tavares et al. [9] investigated bond behavior for various bar diameters using simulated pull-out tests. Their numerical results were in the range of experimental results. Similarly, Hoang et al. [10] developed a FE model in ATENA 3D to examine the compressive behavior of circular steel tube–confined concrete stub columns using normal, high, and ultra-high strengths. The FE model predicted curves of ultimate and axial loads versus vertical strain that aligned well with those of previous test results. Additionally, Abed et al. [11] simulated pull-out tests using ATENA 3D software. The numerical results were comparable to those obtained experimentally, which expressed real behavior.
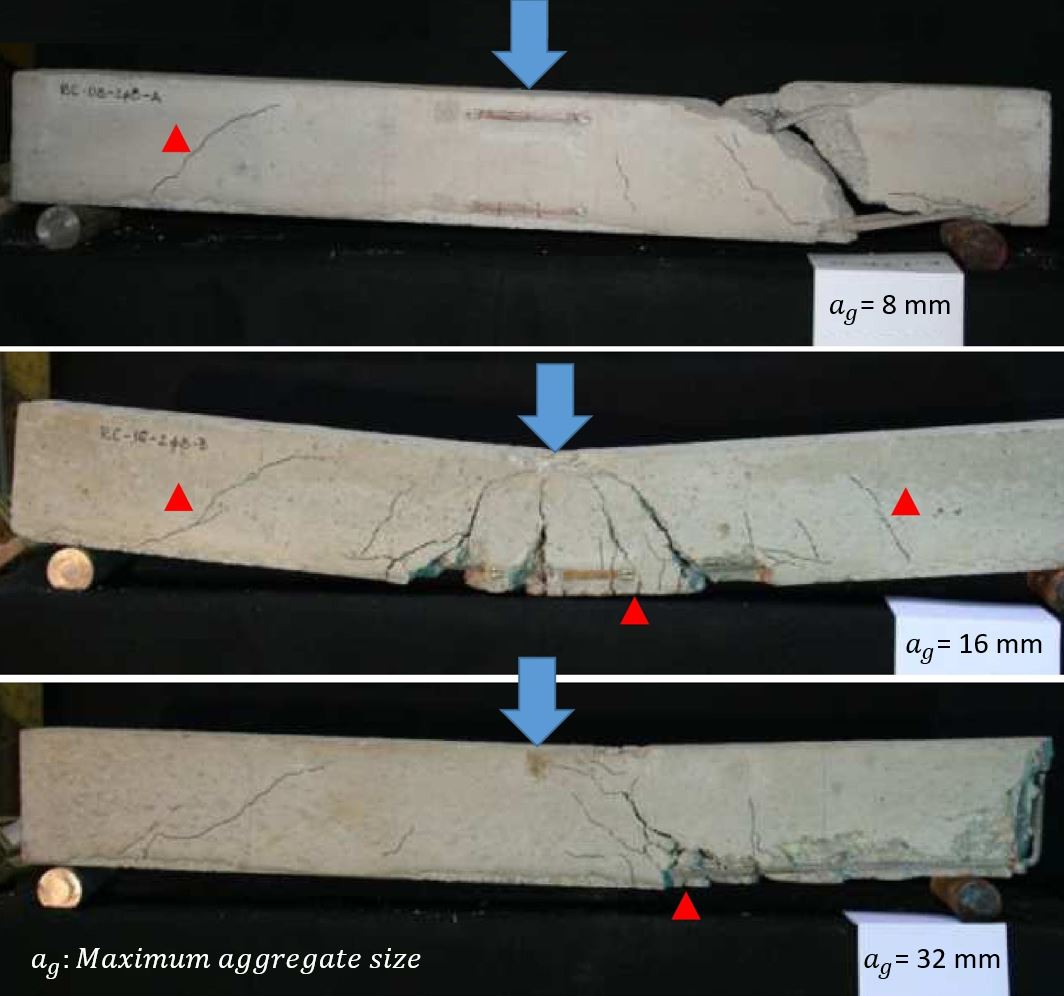
Typically, the maximum aggregate size parameter affects the failure mode of the reinforced concrete beam under the bending effect. In other words, by using the same concrete class with variable maximum aggregate sizes, the crack pattern can be changed by aggregate size changing. Vajk et al. [12] reported results of three-point bending tests of reinforced concrete beams with longitudinal reinforcement only (2Φ8). The concrete class was the same for the three beams, and the difference was only in the maximum aggregate size (8 mm, 16 mm, and 32 mm). As shown in Figure 1, the failure mode was not symmetric for all the specimens and was strongly affected by the maximum aggregate size. In addition, the type and location of critical cracks were changed by aggregate size changes.
Daluga [13] studied the influence of the maximum aggregate size on the shear strength of reinforced concrete beams without web reinforcement. A 20 percent increase in mean shear strength was observed between beams with a maximum aggregate size of 19 mm (3/8 inch) and 25.4 mm (1 inch). Ismael et al. [14] evaluated eight reinforced concrete beams with self-compacting concrete and conventional concrete using different aggregate sizes (10 mm and 20 mm). The results showed that increasing the coarse aggregate maximum size increases the diagonal cracking load and ultimate shear strength of self-compacting concrete beams slightly, but the effect was more significant for conventional concrete beams.
As previously stated, several experiments have been simulated using various software, with numerical results that are consistent with experimental results. Although various reinforced concrete member models have been simulated, there are few numerical models on the flexural behavior of pre-tensioned prestressed members in the literature. As a result, more research is needed to precisely numerically simulate the flexural behavior of a pre-tensioned prestressed concrete beam and understand the important parameters.
2. Methodology
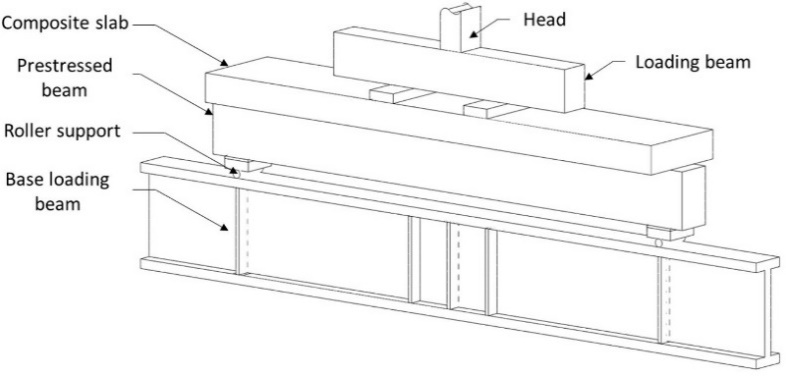
This study consists of numerical modeling efforts targeted at understanding and validating the structural behavior of a pre-tensioned prestressed concrete member based on an experimental investigation from the literature review. On top of that, studying the influence of the coarse aggregate size on the behavior of the member under the bending test. Part of this numerical model has already been done in a previous paper by Alkurdi [15]. A four-point static bending test is used to perform the flexural test on the pre-tensioned prestressed concrete beam. Cowen and VanHorn [16] conducted an experiment on a T-beam that was simply supported. The specimen was a rectangular prestressed concrete beam with a cast-in-place slab. In this study, the ATENA 3D software was used to simulate the actual behavior of concrete structures, such as reinforcement yielding, concrete cracking, and crushing [15]. Furthermore, ATENA 3D was specially designed for concrete, making it more user-friendly with appropriate default values [17].
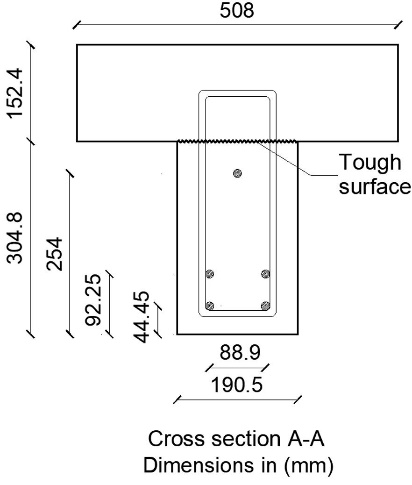
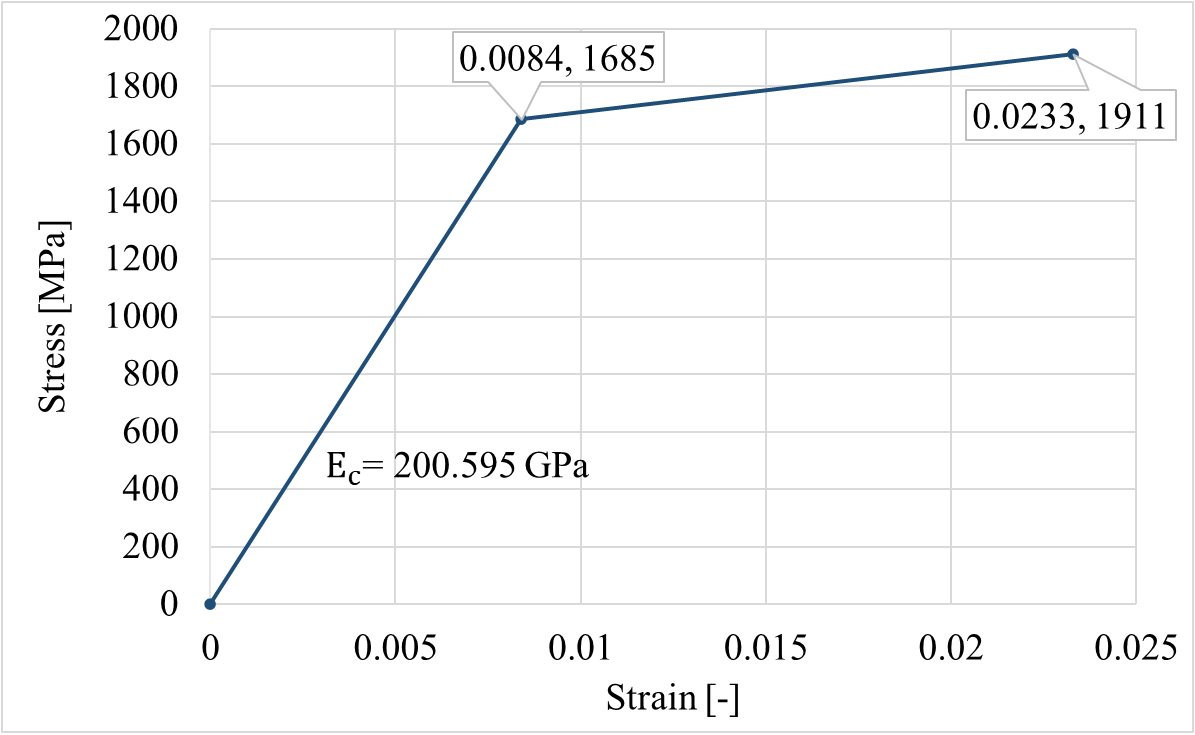
The mix of concrete was produced with Type III (high-early strength) Portland cement, sand, and crushed limestone coarse aggregate. The mix proportions by weight (cement-to-sand-to-coarse aggregate) were 1.00:2.64:2.98. The concrete cylinder compressive strengths at the time of the test were 41.16 MPa and 46.56 MPa for the rectangular beam and slab, respectively. In addition, Young's modulus of the concrete was 28 GPa. Stress-relieved type seven-wire 270 K strands with a diameter of 12.8 mm were used as longitudinal reinforcements. The elastic modulus of the strand is 200.595 GPa. Strands were placed in three layers in the cross-section. The rebars for the shear reinforcements were fabricated from No. 3 deformed bars with a nominal yield stress of 345 MPa and a diameter of 10 mm. The arrangement of shear reinforcements of the beam was Φ10@152.4 mm (compliant to Eurocode 2) [15].
2.1. Four-point static bending test
The four-point static bending test, as reported by Cowen and VanHorn [16], is presented and validated in this section using the nonlinear FE software ATENA 3D. The aim of the test was to determine the ultimate load and the associate failure characteristics.
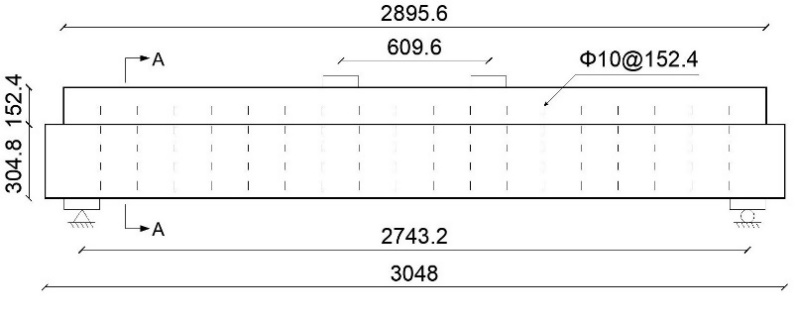
The pre-tensioned prestressed concrete beam was tested in the Fritz Engineering Laboratory's 300 kips (1334.5 kN) hydraulic testing machine. The loading beam and associated apparatus were arranged to provide symmetric two-point loading for the spacemen [15]. The pre-tensioned prestressed concrete beam used in this study had a span of 2743.2 mm. Figure 2 shows the geometry, beam cross-section, and position of the loading spins. The test specimen was initially loaded in 44.5 kN increments, which equaled around 8% of the computed ultimate load. When visible concrete cracks appeared, the loading increment was reduced to 22.25 kN till failure. The strands were initially tensioned to 70% of the ultimate stress specified [14]. The theoretical and measured losses in the strand are shown in Table 1.
Table 1. Losses in prestressing strand.
|
|
Theoretical |
Measured |
|
Initial stress (kN) |
128.55 |
128.55 |
|
Elastic loss at release (kN) |
6.81 |
15.03 |
|
Stress after release (kN) |
121.88 |
113.52 |
|
Loss after release (%) |
5.19 |
11.70 |
|
Shrinkage (kN) |
5.60 |
19.88 |
|
Creep, steel, and concrete (kN) |
22.33 |
|
|
Total loss (kN) |
34.74 |
34.91 |
|
Total loss present (%) |
27.02 |
27.20 |
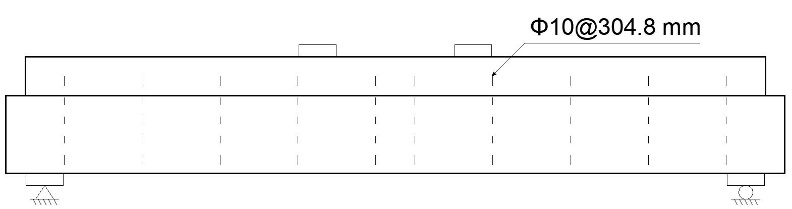
The FE model was upgraded to study the influence of the coarse aggregate size on the behavior of the pre-tensioned prestressed concrete beam under the bending test with maximum aggregate sizes equal to 13, 21, 25, and 37 mm, as carried out by Ajamu et al. [18]. The upgraded model is called "n-beam". Since the aggregate size affects the shear strength, the shear reinforcement ratio of the beam was decreased to half to fail in shear and not in flexure or bond. The arrangement of shear reinforcement of the n-beam was Φ10@304.8 mm (non-compliant to Eurocode 2), as shown in Figure 3.
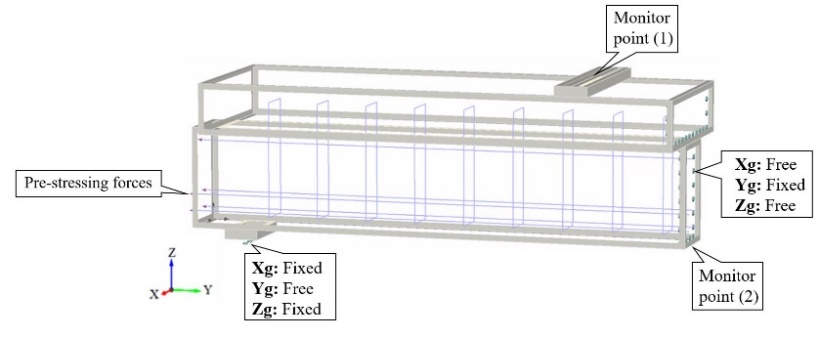
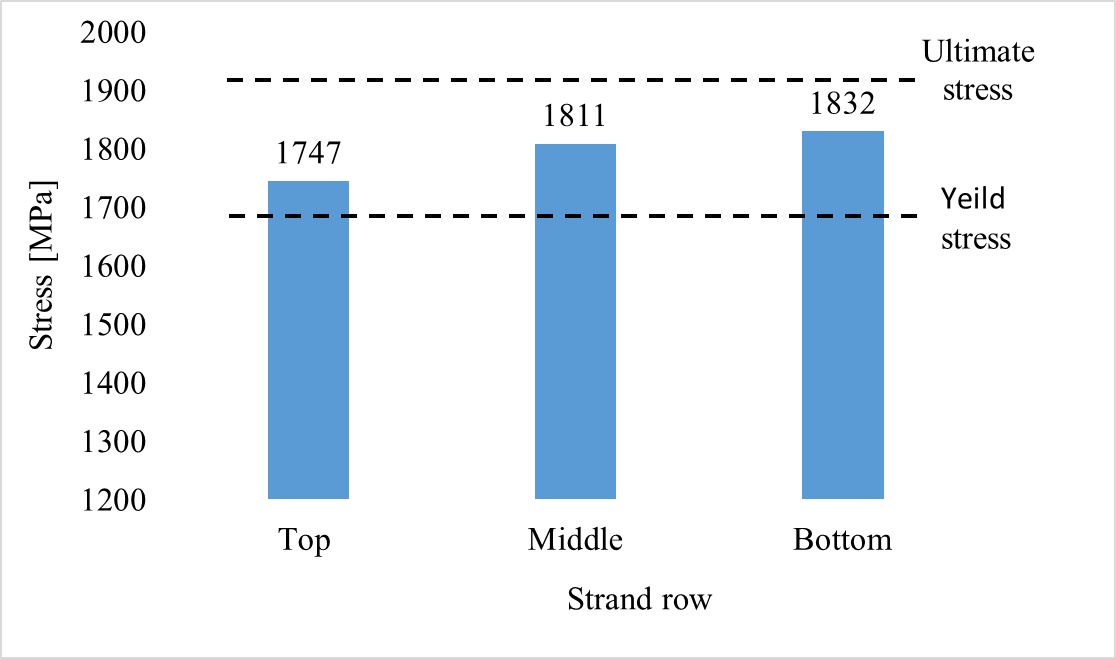
An inverse analysis was executed by ATENA 3D software after establishing the model geometry and the flexural test procedures used in the experiment. Due to the symmetricity, half of the pre-tensioned prestressed concrete beam was modeled [15]. Steel plates 3 cm thick were installed at the bottom and top of the beam for support and loading. The displacement loads were applied to the upper steel plate rather than the beam directly to avoid early cracking, as the software manual suggests [19]. An elastic tetrahedral element with an elastic modulus of 2.1 × 10⁵ MPa was used to model the steel plates. For the boundary conditions, since analyzing only half of the beam, the axis of symmetry along the right side of the beam was enforced. Therefore, the horizontal y-displacements along this side should be equal to zero. The transition of the left support was fixed in the vertical and lateral directions, as illustrated in Figure 4. The model's FE mesh type was brick with a size of 0.05 m. The loading history for the analysis was defined, consisting of load steps, and each load step included a combination of load cases. In the software, the Newton-Raphson solution method was chosen. The simulation's aim was to increase the load to failure. During nonlinear analysis, forces, displacements, strains, and stresses in the model are typically monitored. The monitored data can provide information about the status of the model and produce the load-deflection curve. Therefore, two monitoring points were selected in the numerical model for this purpose. The first point was for the monitoring of the force applied at the top steel plate, and the second was located at the middle of the beam near its bottom surface, where the largest vertical displacements could be expected. Thus, the required load-deflection curve could be obtained. Moreover, other monitor points were defined to record the stresses, strains, and crack widths of the member. When defining the materials, the compressive strength of concrete was entered into the program for the slab (flange) and the beam (web). The strand properties were defined according to the experiments, as shown in Figure 5. In addition, prestressing forces were applied to the strands in the software in the form of effective stress of 93.64MPa.
2.2. Nonlinear Finite Element Analysis
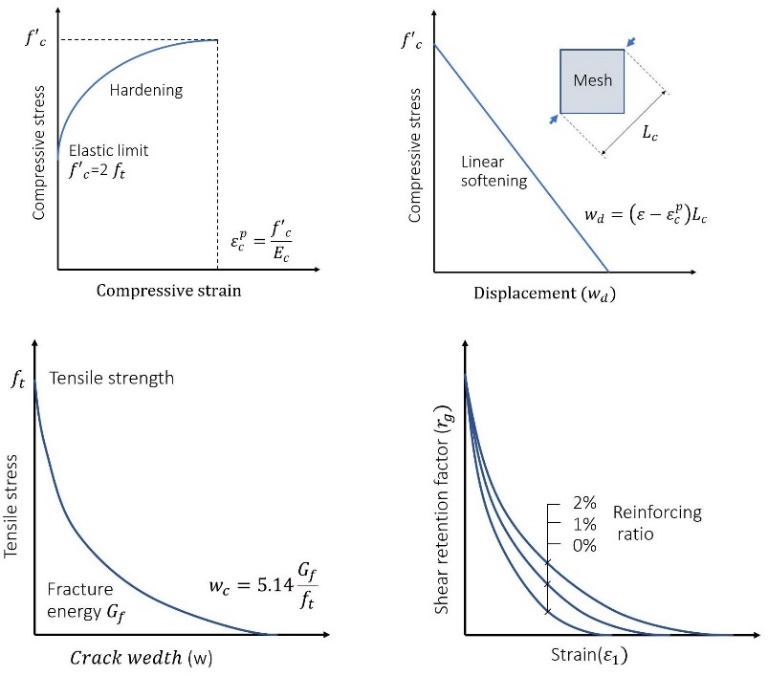
The compression, tension, and shear transfer models implemented in the ATENA 3D software package are summarized in Figure 6. Alkurdi [15] presented the equations of the hardening and softening functions used in the compression and tension models.
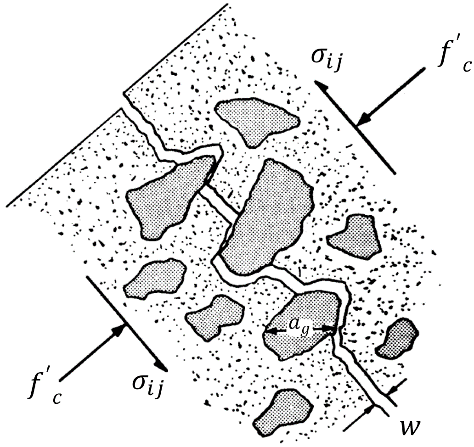
ATENA 3D software uses the Modified Compression Field Theory of Vecchio and Collins to calculate the shear strength of cracked concrete, as shown in Eq. 1 [20]. Cracking occurs for most concretes along the interface between the aggregate and paste of cement. As illustrated in Figure 7, shear stresses can transmit with the resulting rough cracks by aggregate interlock.
where σij is the shear strength of cracked concrete, f'c is the compressive strength of the concrete (MPa), w is the maximum crack width (mm), and ag is the maximum aggregate size (mm).
3. Results
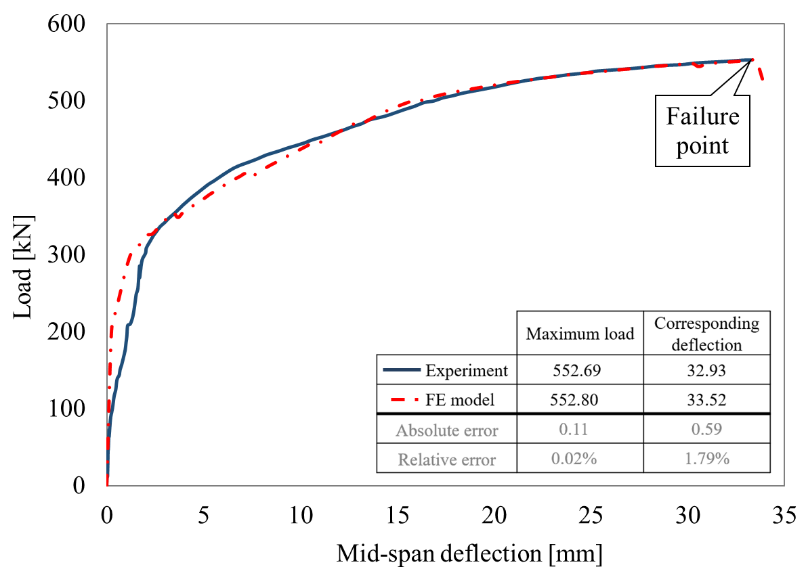
The load-deflection curve of the beam (Φ10@152.4 mm) obtained from the laboratory experiment and the numerical modeling are shown in Figure 8 [15]. The failure mode is flexural, which means that the pre-tensioned prestressed concrete beam failed due to concrete crushing long after the strands yielded at the mid-span, as shown in Figure 9. The ultimate loads were 552.69 and 552.80 kN, and the corresponding mid-span deflections were 32.93 cm and 33.52 cm for the laboratory experiment and FE model, respectively. It is observed from the curves that the stiffness of the FE model in the first stage of the test is higher than that of the experimental specimen (see Figure 8). In ATENA 3D software, smeared crack approach is used. In the model with smeared cracks, concrete is considered a continuous material after cracking. After cracks appear, the FE and the experimental results started to converge until the failure.
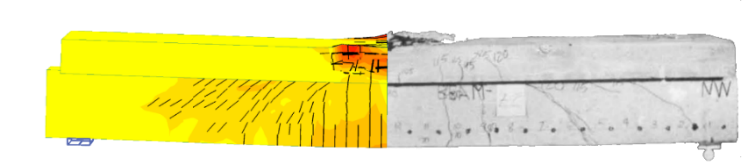
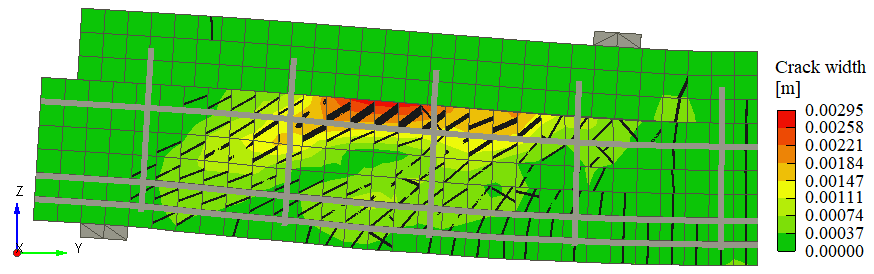
The crack pattern of the beam obtained from the FE analysis and laboratory experiment is shown in Figure 10. When the stresses in the bottom fibers reached values normally associated with the tensile strength of the concrete, flexural cracking occurred in the high-moment zone of the test specimens. The development of vertical cracks to a height between the lower and upper strands characterized the flexural cracking. Flexural-shear cracking followed flexural cracking in the shear-span region of the test specimen. A flexural-shear crack is different from a diagonal crack in that a diagonal crack is caused by primary tensile stresses that develop in the web of an I-beam or the stem of a T-beam.
The nonlinear FE analyses validated the experimental results by showing strong agreement on the overall load-deflections and failure modes with a variation of less than 2% at failure.
After assessing the bending behavior of the beam and verifying the results with the laboratory experiment, the n-beam, having reduced shear reinforcement (Φ10@304.8 mm), was modeled with maximum aggregate sizes of 13, 21, 25, and 37 mm. Four models failed in the same mode with different ultimate load capacities. The failures were unpredictable, occurring in the mid–shear span by yielding the two bottom layers and crushing the concrete around the top unyielded strand and specifically between two stirrups, as shown in Figure 11.
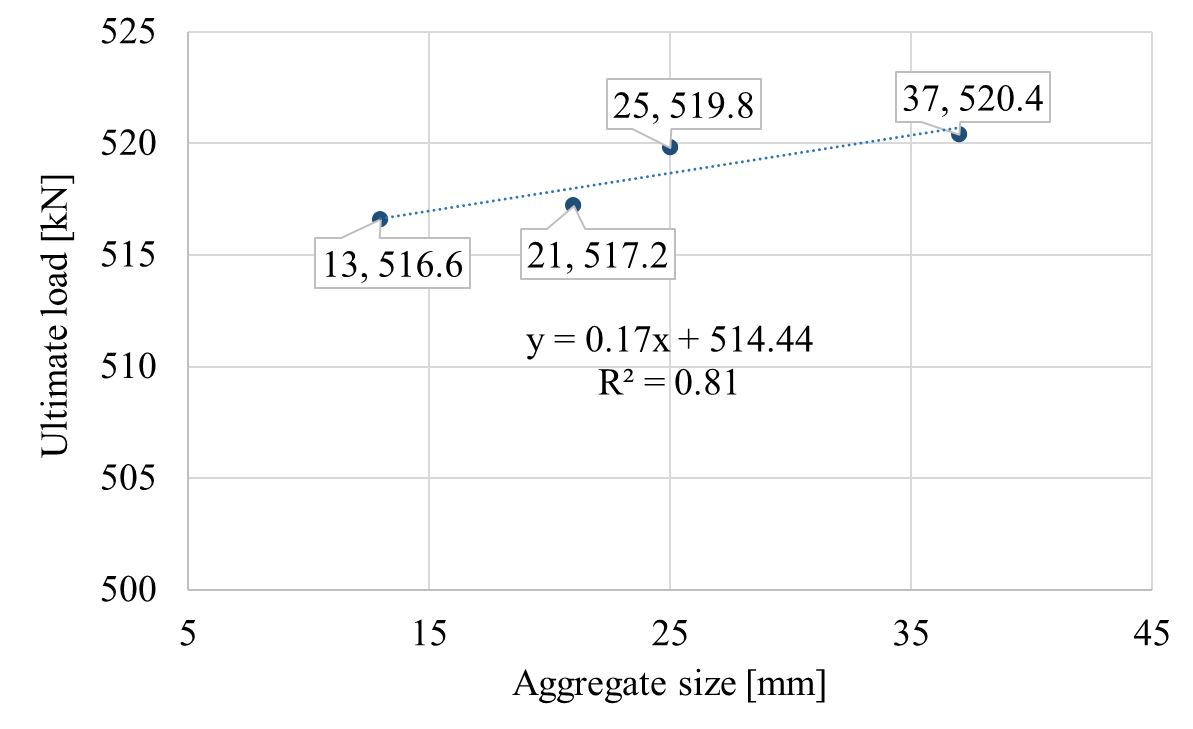
The results of FE models indicated that the ultimate load capacity of the beam increased with increasing the maximum aggregate size. Similar results were found in the previous studies by Murray et al. [21] and Chana [22]. Figure 12 illustrates the influence of the maximum aggregate size on the ultimate load of the n-beam. The ultimate loads at failure were 516.6, 517.2, 519.8, and 520.4 kN for maximum aggregate sizes of 13, 21, 25, and 37 mm, respectively. A linear regression shows the relationship between the ultimate load and the maximum aggregate size with a coefficient of determination R2= 0.81. Although the relationship is positive, the increase in the ultimate loads due to a larger maximum aggregate size was slight, as found by Ismael et al. [14]. This is attributed to the failure mode, which was not shear, owing to the minimal shear reinforcement.
5. Conclusion
Numerical modeling has made considerable progress in structural engineering. The influence of the maximum aggregate size on the ultimate load of the pre-tensioned prestressed beam was studied numerically. Firstly, a FE model was validated based on experimental results of a standardized four-point static bending test previously reported. The beam was a rectangular prestressed concrete beam with three layers of strands and a cast-in-place slab with cylinder concrete compressive strengths of 41.16 MPa and 46.56 MPa at the test, respectively. As a longitudinal reinforcement, seven-wire strands were used, and as a transverse reinforcement, deformed bars were used. The arrangement of shear reinforcements of the beam was Φ10@152.4 mm (compliant to Eurocode 2). Secondly, the shear reinforcement ratio of the beam was decreased to half to fail in shear and not in flexure or bond, since the aggregate size affects the shear strength. The arrangement of shear reinforcement of the upgraded beam was Φ10@304.8 mm (non-compliant to Eurocode 2). four models with maximum aggregate sizes of 13, 21, 25, and 37 mm were simulated. After examining the analyses, the following points are put forward:
- The results obtained using ATENA 3D software of the pre-tensioned prestressed concrete beam were comparable to those obtained experimentally in terms of failure mode, crack pattern, ultimate load, and corresponding mid-span deflection, which express the real behavior. Thus, it is possible to express the behavior of the four-point bending test by using ATENA 3D without attribution on an experimental but based on a validated one model. This saves the effort and cost needed to prepare and conduct the laboratory test.
- The ultimate load of the pre-tensioned prestressed concrete beam with the reduced amount of shear reinforcement (Φ10@304.8 mm) led to unpredictable modes of failure by yielding the two bottom layers and crushing the concrete in the mid–shear span around the top unyielded strand. This beam exhibited less load capacity and lower ductility. On top of that, the ultimate load of the beam at failure was slightly influenced by the maximum aggregate size. The increase of the ultimate load was not significant, which is mostly due to the failure mode, which was shear, owing to the minimal shear reinforcement.
References
[1] E. Association, Syrian Arab code for the design and implementation of reinforced concrete structures. Damascus, Syrian Engineers Union, 2012.
[2] R. Rehan, M. Nehdi, "Carbon dioxide emissions and climate change: policy implications for the cement industry," Environmental Science & Policy, vol. 8, no. 2, pp. 105-114, 2005. View Article
[3] Z. Alkurdi, "Influence of Concrete Compressive Strength on Transfer Length in Pretensioned Concrete Members Using 3D Nonlinear FEM Analysis," 6th International Conference On Civil Structural and Transportation Engineering (ICCSTE'21), Virtually, 2021. View Article
[4] D. P. Billington, "Historical perspective on prestressed concrete," PCI Journal, vol. 21, no. 5, pp. 48-71, 1976. View Article
[5] M. L. Arnold, "Un-tensioned pullout tests to predict the bond quality of different prestressing reinforcements used in concrete railroad ties," Doctoral dissertation, Kansas State University, Manhattan, 2013.
[6] M. A. Abed, Z. Alkurdi, J. Fořt, R. Černý, S. Solyom, "Bond Behavior of FRP Bars in Lightweight SCC under Direct Pull-Out Conditions: Experimental and Numerical Investigation," Materials, vol. 15, no. 10: 3555, 2022. View Article
[7] O. Yapar, P. K. Basu, N. Nordendale, "Accurate finite element modeling of pretensioned prestressed concrete beams," Engineering Structures, vol. 101, pp. 163-178, 2015. View Article
[8] T. Doi, Y. Murono, and H. Cho, "Model Test and Corresponding Simulation on Compressive Characteristics of Soilbags," International Journal of Civil Infrastructure, vol. 3, pp. 41-47, 2020. View Article
[9] A. J. Tavares, M. P. Barbosa, T. N. Bittencourt, M. Lorrain, “Aderência aço-concreto: simulação numéricadosensaios de arran-chamento pull-out e APULOT usando o programa ATENA (Bond steel-concrete: simulation analysis of the pull-out tests and APULOT using the program ATENA),” Revista IBRACON de Estruturas e Materiais, vol. 7, no. 1, pp. 138–157, 2014. View Article
[10] A. Le Hoang, E. Fehling, "Numerical study of circular steel tube confined concrete (STCC) stub columns," Journal of Constructional Steel Research, vol. 136, pp. 238-255, 2017. View Article
[11] M. A. Abed, Z. Alkurdi, A. Kheshfeh, T. Kovács, and S. Nehme, "Numerical Evaluation of Bond Behavior of Ribbed Steel Bars or Seven-wire Strands Embedded in Lightweight Concrete," Period. Polytech. Civil Eng., vol. 65, no. 2, pp. 385-396, 2021. View Article
[12] R. Vajk, I. Sajtos, "The effect of aggregate size on the behaviour of beams without shear reinforcement," CONCRETE STRUCTURES: ANNUAL TECHNICAL JOURNAL: JOURNAL OF THE HUNGARIAN GROUP OF FIB, vol. 16, pp. 24-30, 2015.
[13] D. R. Daluga, "The effect of maximum aggregate size on the shear strength of geometrically scaled reinforced concrete beams," Doctoral dissertation, Purdue University, West Lafayette, 2015.
[14] M. A. Ismael, H. J. Abd, A. A. Hameed, "Effect of coarse aggregate size on shear behavior of self-compacting concrete and conventional concrete beams," International Journal of Engineering & Technology, vol. 7, no. 4.20, pp. 359-363, 2018. View Article
[15] Z. Alkurdi, "Evaluation of Pre-tensioned Prestressed Concrete Beam Behavior by Finite Element Analysis Using ATENA 3D," 7th International Conference On Civil Structural and Transportation Engineering (ICCSTE'22), Niagara Falls, 2022.
[16] S. H. Cowen, D. A. Van Horn, "End support effects on ultimate flexural bond in pre-tensioned beams," Doctoral dissertation, Lehigh University, Bethlehem, 1967.
[17] V. Červenka, L. Jendele, J. Cervenka, Atena theory. Prague , 2007.
[18] S. O. Ajamu, J. A. Ige, "Effect of coarse aggregate size on the compressive strength and the flexural strength of concrete beam," Journal of Engineering Research and Applications, vol. 5, no. 4, pp. 2248-2267, 2015.
[19] J. Červenka, Z. Procházková, T. Sajdlová, ATENA Program Documentation, Part 4-2, Tutorial for Program ATENA 3D. Cervenka Consulting, Prague, Czech Republic, 2017.
[20] F.J. Vecchio, M. P. Collins, "The modified compression-field theory for reinforced concrete elements subjected to shear," ACI J., vol. 83, no. 2, pp. 219-231, 1986. View Article
[21] M. R. Murray, "An investigation of the unit shear strength of geometrically scaled reinforced concrete beams," 2010.
[22] P. S. Chana, Some aspects of modelling the behaviour of reinforced concrete under shear loading (No. Monograph). Cement and Concrete Association, 1981.