International Journal of Civil Infrastructure (IJCI)
ISSN: 2563-8084

Volume 7 - Year 2024- Pages 50-61
DOI: 10.11159/ijci.2024.006
Stability Analysis of Surface and Subsurface Geological Hazards Using Numerical Approach in Hydropower Project of India- a Case Study
Mainak Ghosh Roy1, Nirmal Singh1, Sajan Moideen1
1NHPC Ltd.
Parbati Hydroelectric Project-II, Nagwain, District: Mandi, Himachal Pradesh, India-175121
mainakghosh@nhpc.nic.in; nirmalsingh@nhpc.nic.in; sajan@nhpc.nic.in
Abstract - The paper reviews major geological problems encountered during construction of a mega hydropower project in the Lesser Himalayan region of Himachal Pradesh, India. Major hindrances encountered during construction of the project were backslope failure during construction of surface powerhouse in metavolcanics with slumped rockmass and rock bursting during tunnelling in hard and brittle quartzite. Two different modes of failures occurred during excavation of 180m long backslope of surface Powehouse-circular failure along highly weathered slumped rockmass and planar failure along crushed rock filled valley dipping joints. Stability assessment of powerhouse backslope was carried out through Finite element based software and Limit equilibrium based software for analysis of planar failure in jointed rockmass and determine critical slip circle of failure and Factor of Safety of the slope through strength reduction technique. Optimum support analysis for stabilization of cutslope was carried out through numerical simulation. Deformation meshes, accumulated principal strain and total displacement are the other parameters obtained from the results computed and analysed using FEM. The paper also back analyzes magnitude of in-situ stresses in rock bursting zones encountered during tunnelling using finite element based software to determine role of depth of overburden and field stress ratio in causing rock bursting. The result indicates that magnitude of principal stresses and yielding zones increase with depth of overburden and decrease in field stress ratios.
Keywords: Slope stability, Numerical analysis, Factor of safety, In-situ stresses, Rock bursting
© Copyright 2024 Authors - This is an Open Access article published under the Creative Commons Attribution License terms. Unrestricted use, distribution, and reproduction in any medium are permitted, provided the original work is properly cited.
Date Received: 2023-10-01
Date Revised: 2024-05-16
Date Accepted: 2024-05-27
Date Published: 2024-07-02
1. Introduction
Being youngest of the mountain chains, Himalayas arguably pose the most challenging ground conditions although there is a huge potential of surface and underground constructions in the Himalayan region for hydropower and infrastructure development. The common geological hazards often encountered in Himalaya are thrust/shear zones, stress induced deformations like rock bursting and squeezing, ingress of groundwater, variety of slope failure processes which includes various kinds of rockfalls like planar, wedge, toppling and circular failure governed by the pattern of rock discontinuities. The paper reviews two major geological hindrances viz. 180m high backslope failure of powerhouse and rock bursting during excavation of 31.5km long headrace tunnel which were experienced in Parbati hydroelectric project-II, a 800MW capacity project in Lesser Himalayan region of India, presently under construction by NHPC Ltd.
2. Literature Review
Neo-tectonic activities along the zones of major thrusts cause a high frequency of slope failure [1]. Matthews et al. [2] in their study show that problems with complex geometries that requires analysis of seepage, consolidation and other coupled hydrological and mechanical behaviour (pore water pressure induced with more complex mechanical soil responses e.g. stress-strain behaviour and progressive failure) may be better tackled using numerical analysis. Burman et al. [3] in their study observed that limit equilibrium analysis involving ordinary slice method provides most conservative estimation of factor of safety values in comparison to finite element analysis. Therefore, any design of slopes carried out with limit equilibrium method is likely to be always on the safer side. Choi et al. [4] carried out stability analysis of jointed rock slopes by UDEC using Barton-Bandis constitutive model to analyse the shear movement due to dilation of rock slopes. Ghosh Roy et al [5] carried out stability analysis of a tunnel under rock bursting conditions using Finite element model and the study indicates that field stress ratio and depth of overburden plays an important role in causing rock bursting. Panthi [6] back calculated magnitude of in-situ stress state in a tunnel subjected to rock bursting using finite element modelling to evaluate the magnitude of tectonic horizontal stress component and estimate the rock burst depth impact. From various researches carried out around the world, it is well established that parametric studies using different numerical models play an important role in analysis of deformation behaviour of high slopes and deep seated tunnels under stress induced conditions and determination of effective support system to stabilize surface and subsurface engineering structures.
3. General Description of Project
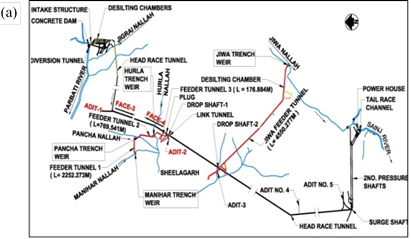
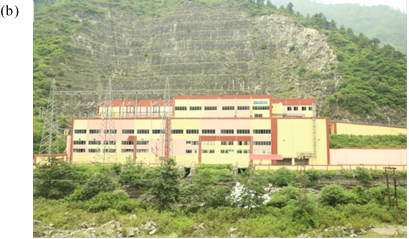
Parbati hydroelectric project-II is a run of river scheme located in Himachal Pradesh, India on the river Parbati, a tributary of Beas river. Major part of the project area falls within a tectonic window in close proximity to Jutogh thrust which is a part of Main Central Thrust. Project mainly comprises construction of 85m high Concrete Gravity Dam, 31.5km long, 6.0m diameter Head Race Tunnel, two 1.5km long inclined pressure shafts of 3.5m diameter and a surface power house (123m x 47m x 44m) (Fig. 1a)[7]. The power house utilizes a gross head of 862m and will have installed capacity of 800 MW. Layout plan of the project is shown in Fig. 1(a) and view of surface powerhouse is shown in Fig. 1b.
4. Major Geological Hazards Encountered During Surface Excavation
4.1. Backslope Failure of Surface Powerhouse
The failures of slopes in Himalaya are common particularly along the zones lying in close proximity of two major tectonic units i.e. Main Boundary Thrust (MBT) and Main Central Thrust (MCT) where the neo-tectonic activities along the zones of major thrusts cause a high frequency of slope failure [1].
In the present study, causative factors of the backslope failure in Parbati hydroelectric project-II are discussed. Further, numerical simulation is carried out with both Finite element and Limit equilibrium method to evaluate the failure mechanisms and factor of safety of the powerhouse backslope.
4.2. Geology of the Powerhouse Area
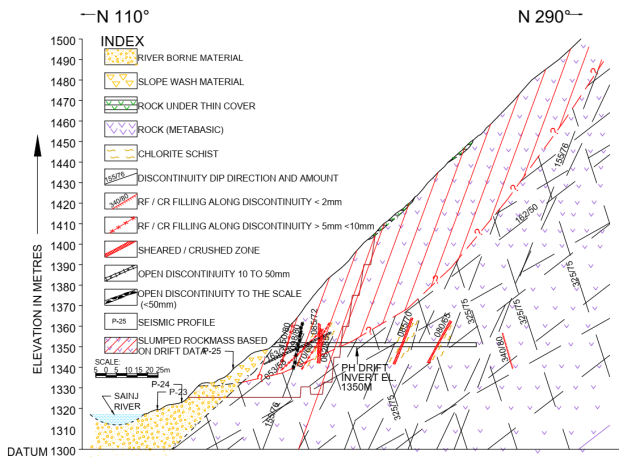
The surface powerhouse (Fig.1b) was constructed on a 40m wide multistage riverine terrace. The back slope of the powerhouse rises steeply (~45°) upto a height of 180m rising from El±1330M to EL±1510M beyond which a break in slope has resulted into relatively gentler slope of 25-30° upto the surge shaft ridge. During excavation, powerhouse slope was covered with thick slope wash material whereas the rock was exposed as steep escarpment around the surge shaft area. The bedrock in the powerhouse backslope area comprises of low grade metamorphic rocks of metabasics and chlorite schist. The bedrock is overlain by slope wash material and slumped rock mass at few places. The rock is dissected by one prominent foliation joint set (070°/50°) and one valley dipping joint set (150°/60°).
During investigation stage, the powerhouse area was thoroughly investigated by exploratory drilling, drifts and geophysical surveys. Two level drifts were excavated at El ±1350M and El. ±1346M respectively as shown in Fig. 2. Weak geological features such as sheared/crushed zone, rock flour/crushed rock filling along the joint plane, opening of upto 50mm along joint plane were observed in the drift. About 25-50% rockmass encountered in the drift belonged to poor to very poor category as per RMR classification. The presence of open joint planes (2mm to 100mm) in the drift indicates partial slumping of rockmasses upto an observed depth of 15 to 20m [8].
4.3. Design and Methodology of Powerhouse Excavation
From upstream to downstream portion, the entire powerhouse slope was divided in -6 to + 30 RD segments. The straight portion in the upstream from RD -6m to RD+24m was cut sub-perpendicular to the foliation whereas the cut faces in the downstream curved portion from RD+24m to RD+30m are sub parallel to the foliation planes.
The excavation of powerhouse backslope was designed in steps of 15m with berm width of 4m as shown in Fig. 3. The excavation was initially proposed upto EL.1417M with cut line at El. 1423M with recommended support measures of 6 to 9m long, 25-36 mm dia rock anchors along with wire mesh and shotcrete. During preliminary stage of rock cutting, no sound rock mass were encountered along the cut line in the upstream portion from RD -5m to +4m due to which the rock cutting started from higher elevation at around El 1450M. However, due to non-availability of sound and firm rock even upto El 1450M, loose boulders were removed and remaining surface comprising of bedrock overlain by slumped rockmass was treated with wire mesh and shotcrete along with rock anchors.
4.4. Slide in Powerhouse Area between RD -7m to +9m
During excavation of powerhouse backslope in the service bay area between RD-7m and RD+9m, 1-50mm wide cracks started to develop at the beginning. Later on these cracks resulted into slide starting from El ±1440M to ±1368M. This slide later on extended upto El ±1480M. Prior to failure, heavy rainfall further triggered rotational movement of rockmass along the weak plane (Fig. 4a). Slumped rockmass alongwith valley dipping joints with low shear strength vis-à-vis heavy precipitation culminated into slip circle failure and caused major slide in the service bay area (Fig. 4b).
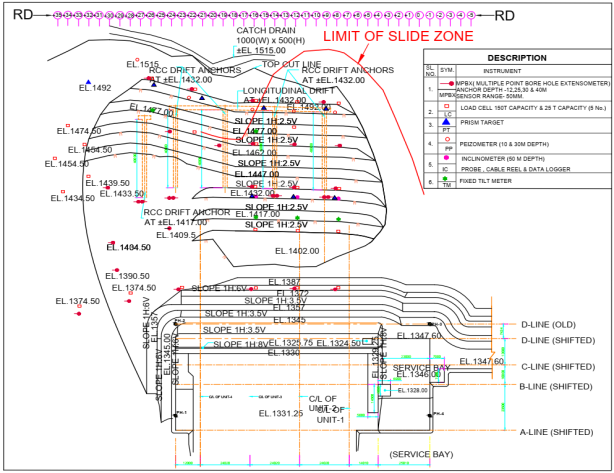
To monitor the behaviour of rockmass, 6-15m long Single/Multi-point borehole extensometers were installed in the cut slopes (Fig. 3). A major jump in the instruments readings and increase in width of the cracks upto 10cm were observed before failure (Fig. 5 and Fig. 6).
Restoration of the slope was carried out by slope dressing, wire meshing, installation of 6m and 9m long rock anchors, 25mm dia and 6m long soil nail and 150mm thick shotcrete in two layers. Drainage/pressure relief holes of length 3-4 m were also provided. The estimated amount of slided muck was around 30,000 m3 to 35,000 m3.
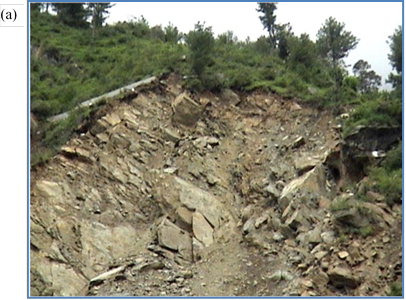
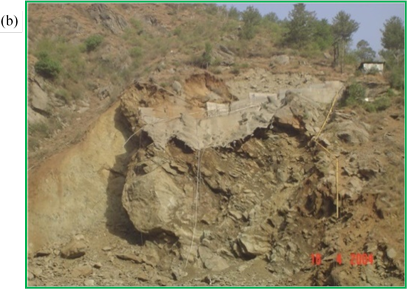 Figure 4 a,b. View of slide in the u/s of powerhouse cut slope between RD -7m and +9m starting from El±1440M to El±1368M
 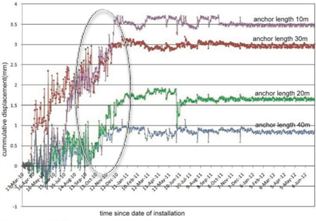 Figure 5. Cumulative displacement readings in MPBX, Bhatnagar and Das [8]
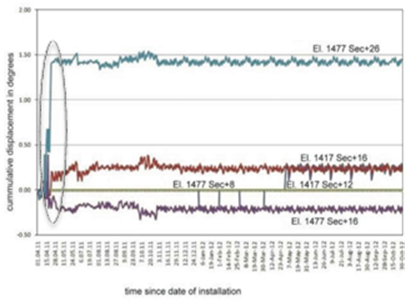 Figure 6. Cumulative displacement readings in Tiltmeter [8]
4.5 Kinematic Analysis of Slope Stability
Kinematic analysis of slope stability was carried out based on the following factors:
a) For planar failure, plane on which sliding occurs should strike subparallel to the slope face, pole of the sliding plane should fall within the daylight envelope of the slope and dip of the slope must be greater than the dip of the sliding plane as shown in Fig. 7.
b) For wedge failure, the spherical triangle must fall within the friction cone φ for potentially unstable wedges and intersection of joint planes should fall within the wedge sliding zone formed by the intersection of slope and friction cone (Fig. 8).
Taking above factors into consideration, it is found from Fig. 7 and Fig. 8 that the backslope of powerhouse is susceptible to planar failure along the foliation joint (086°/50°) and wedge failure due to intersection of J-1 (086°/50°) and J-2 (155°/76°) joint sets.
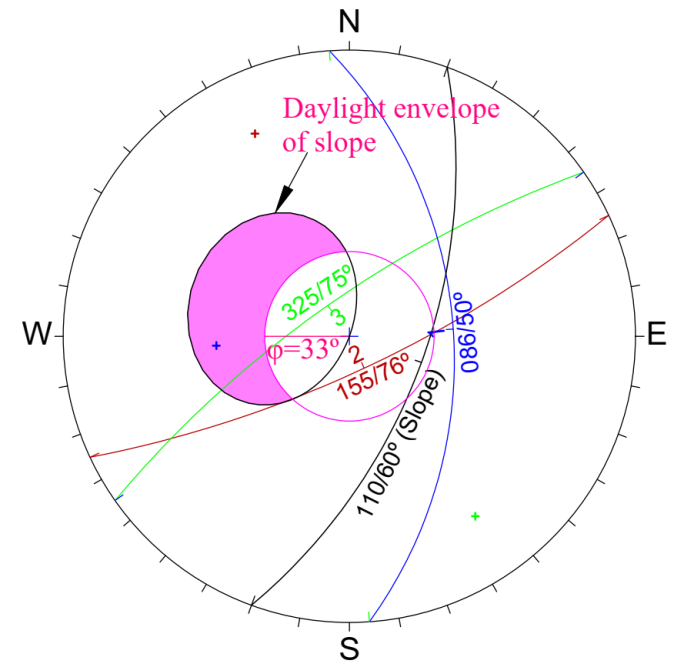 Figure 7. Stereographic projection for planar failure
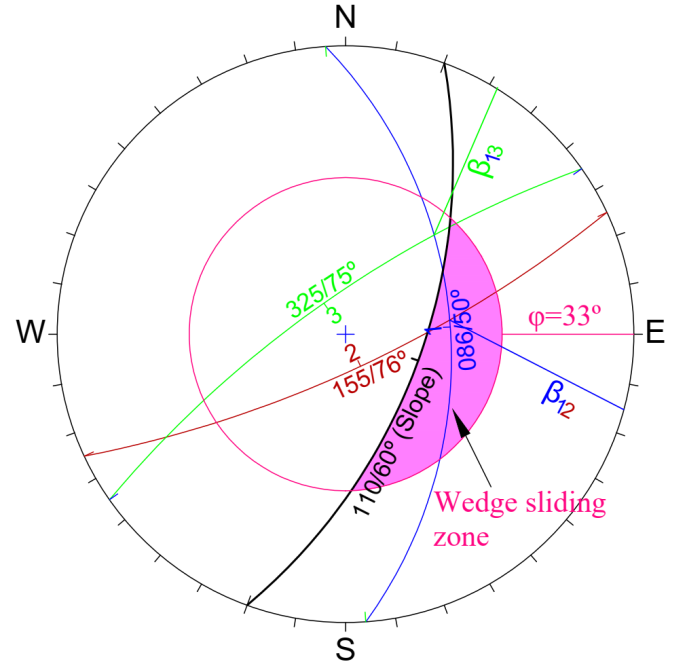 Figure 8. Stereographic projection for wedge failure
4.6 Limit Equilibrium Analysis for Planar Failure of Powerhouse Backslope
Slope stability analysis for planar failure was carried out using RocPlane software with deterministic approach. Sliding resistance is a function of the cohesion inherent in the materials and at their contact and angle of internal friction of the material at the surface of sliding. For the analysis of stability of the slope, partial factor of safety, Fc and Fφ for each of the shear strength parameters (cohesion, c and angle of friction, φ) has been used in the model parameters following IS code 14448:2022 [9]. The factor of safety against sliding on the basis of partial factor of safety in respect of friction (Fφ) and cohesion (Fc ) should not be less than 1.0 as per IS code 6512:2020 [10]. There is no need for reinforcement if static factor of safety of unreinforced slope is more than 1.2. Factor of safety against sliding is computed from the following equation:
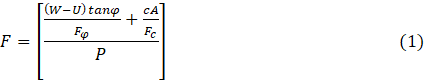
where F =factor of safety against sliding, W =total weight of the sliding mass, U =total uplift force, tanφ= coefficient of internal friction of the material, c= cohesion of the material, A=area under consideration for cohesion, Fφ= partial factor of safety in respect of friction, Fc= partial factor of safety in respect of cohesion, P = total normal force
Fc for cohesive strength =1.5, Modified cʹ= c/Fc
Fφ for frictional strength=1.2, Modified φʹ=tan-1(Tan φ/Fφ)
The resultant FoS for planar failure without considering support pressure is 0.26 (< 1) as driving force > resisting force as shown in Fig. 9a. After applying 35m long cable anchors, resisting force increases and FOS rises to 2.0 which is above desired factor of safety (Fig. 9b).
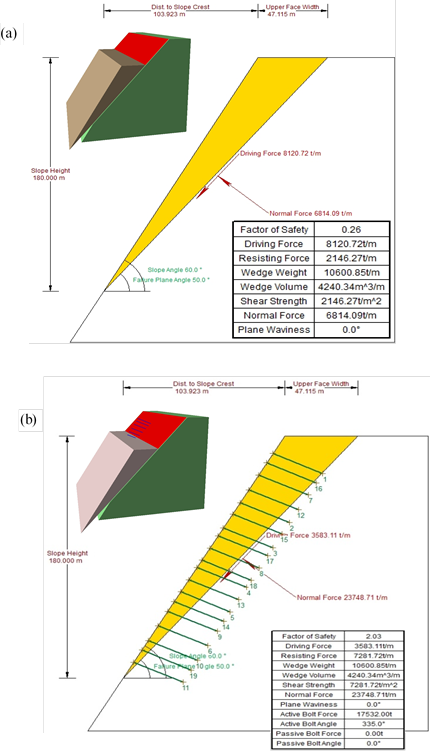 Figure 9. Limit equilibrium model showing factor of safety values for planar failure (a) before reinforcement and (b) after reinforcement
 4.7 Limit Equilibrium Analysis for Planar Failure of Powerhouse Backslope
Stability analysis for wedge failure was carried out using S-wedge software with deterministic approach. Partial factor of safety, Fc and Fφ for shear strength parameters, c and φ respectively were used for model parameters.
Wedge analysis was carried out to find out the potential sliding wedge formed out of combination of J-1 (086°/50°) and J-2 (155°/76°) joint sets by calculating their Factor of safety as shown in Fig. 10a. The resultant FOS for sliding wedge failure without considering support pressure is calculated as 0.27 (< 1) as driving force > resisting force
After applying 35m long cable anchors and 100mm thick shotcrete, resisting force increases and FoS rises to 2.0 which is above desired factor of safety (Fig. 10b).
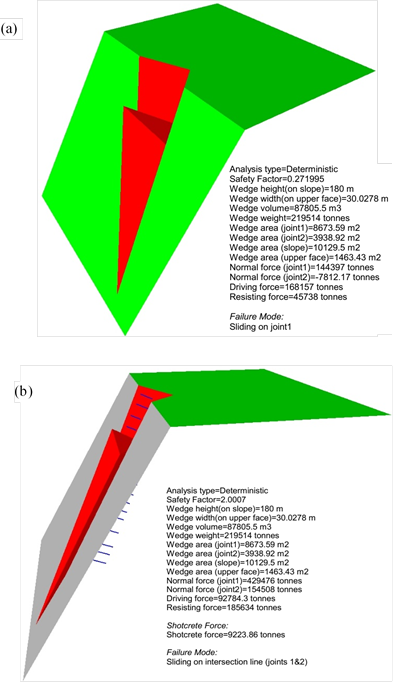 Figure 10. Limit equilibrium model showing factor of safety values for wedge failure (a) before reinforcement and (b) after reinforcement
 4.8. Numerical Modelling for Stability Analysis of Powerhouse Backslope
To carry out slope stability analysis, a two dimensional finite element model of the unsupported slope was created using Finite Element model (FEM) Plaxis 2D ver.8 [11]. An unsupported excavation of the cut slope will cause the instability of the rock slope. The geometry of the natural sloping ground wherein the cut slope was excavated is considered to be metabasics bedrock with slumped rockmass upto a depth of 20m alongwith open joints extending upto the entire height of the slope as shown in Fig. 11.
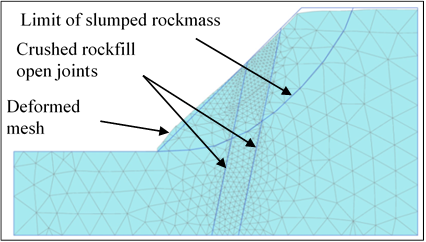 Figure 11. Mesh generation showing deformed mesh
 A plane strain model is used with uniform cross sections. The laboratory rock mechanic properties of metabasics, slumped rockmass and crushed rockfill along open joints are shown in Table 1.
To solve any geotechnical problem using numerical methods, the components of a problem certify three conditions i.e. generation of mesh, constitutive behaviour and material properties and boundary conditions [12]. In this project, the metabasic rock mass is modelled using the Hoek-Brown constitutive model and slumped rockmass is modelled using Mohr-Coulomb elasto-plastic model. Accordingly, both elastic parameters (E,ν) and plastic parameters (c, φ) are utilized in the model. The grid (mesh) defines the geometry of the problem under consideration as shown in Fig. 11. Medium size 15-node triangular element mesh is used to run the model within a reasonable time limit and yet yield higher accuracy. Ground water head or external water pressure is not taken into consideration.
Strength reduction technique was applied in the model to reduce the strength parameters (i.e. friction angle and cohesive force) of rock mass during the computation process to make slope reach the failure condition. The strength reduction method is selected when it is desired to calculate global factor of safety for a given situation. Therefore, φ-c reduction process is also adopted for calculating FoS. Critical slope angle is the key factor in the slope failure analysis. The deformation of mesh shown in Fig. 11 is maximum at the toe as shown in Fig. 12, since the toe is under heavy strain and is always vulnerable in a steep and large slope. The displacement of the toe of the slope leads to the formation of a failure zone as shown in Fig. 13. Maximum displacement at toe calculated by the model is 0.15mm. Total probable displacement of the slope due to toe deformation is calculated as 200-220mm (Fig. 13). The mode of failure of the slope is circular and critical depth of the failure zone is around 10m.
Table 1: Laboratory rock mechanic parameters used in the numerical model
|
Parameters |
Rock Type |
||
|
Metabasics |
Slumped rockmass |
Crushed rockfill along open joints |
|
|
Density |
24 kN/m3 |
18 kN/m3 |
--- |
|
Uniaxial Compressive Strength (UCS) |
41 MPa |
1-3MPa |
<1MPa |
|
Deformation Modulus |
3 GPa |
0.01 GPa |
0.01 GPa |
|
Poisson’s ratio, ν |
0.3 |
0.3 |
0.3 |
|
Cohesion, c |
3 MPa |
0.005 MPa |
0.005 MPa |
|
Friction Angle, φ |
33° |
20° |
24° |
|
Dilation angle |
10° |
0° |
0° |
|
Geological Strength Index (GSI) |
50 |
10 |
<5 |
|
mi |
10 |
--- |
--- |
|
Normal Stiffness, kn |
--- |
--- |
1 GPa |
|
Shear Stiffness, ks |
--- |
--- |
0.1GPa |
|
Mode of Failure |
Hoek-Brown |
Mohr-Coulomb |
Mohr-Coulomb |
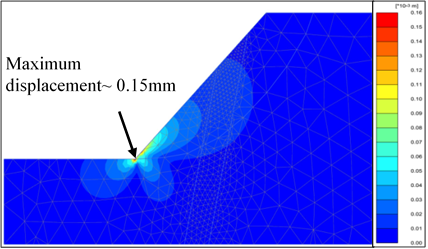 Figure 12. Total displacement maximum at the toe of the slope
 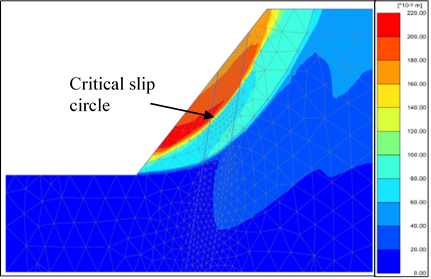 Figure 13. Critical slip circle showing the failure plane
 FoS of the slope as calculated by the model is 0.6 after 120 iterations as shown in the graph in Fig. 14. Fig. 15 shows the accumulation of maximum principal strain which commensurate with the depth of slip circle. The principal strain is concentrated more at the middle of the slope due to the presence of crushed rock filled valley dipping open joints of weak strength and forms a circular zone of failure.
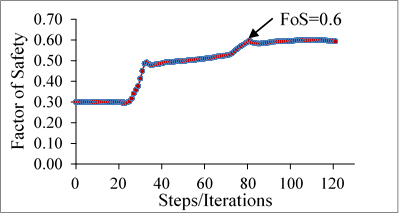 Figure 14. Calculated FoS by the model after 120 iterations
 Limit equilibrium (LEM) modelling with the help of Slide ver. 6.0 [13] software was carried out to correlate with the FoS value determined from the FEM using the same parameters for metabasics, slumped rockmass and crushed rock fill open joints. The FoS value was determined using Bishop simplified (BS) limit equilibrium method.
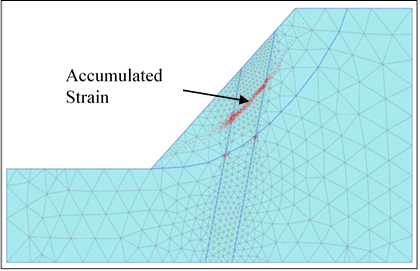 Figure 15. Maximum principal strain at the middle of slope due to valley dipping joints of low shear strength.
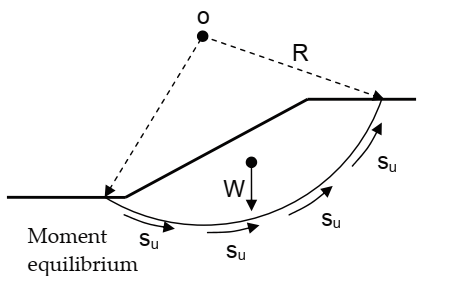
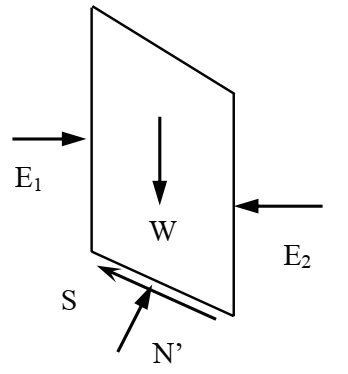
 The advantage of using BS method is that it considers the interslice normal forces, E as shown in Fig. 16 and the equation for FoS hence become non‐linear. However, it neglects the interslice shear forces. FoS is calculated for circular shear surface using the following equation:
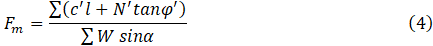
where Fm= FoS for Moment equilibrium, c'= effective cohesion, N'=effective base normal force, S= shear force at the base, φ'= effective internal angle of friction, W= weight of each slice, ∑W sinα = sum of driving forces, l=slice base length.
Effective base normal force, N' is given by the equation:
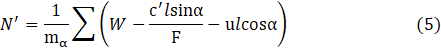
where, u=pore pressure, α=inclination of slip surface at the middle of slice, F=FoS for Force equilibrium
The deterministic factor of safety and critical slip circles are shown in Fig. 17. Comparison of FoS values determined from FEM and LEM shows that both the models indicate development of critical slip circle of failure at a depth of 10-15m as shown in Fig. 13 and Fig. 17. FoS values calculated from both LEM and FEM analysis are lower than the desired factor of safety and indicate unstable slope condition. The fundamental reason which explains the difference in computed FoS by FEM and LEM is that LEM depends on static force or moment equilibrium whereas FEM is based on stress-strain relationship which can accommodate change in stress. Moreover, FEM considers elastic parameters such as Young’s modulus and Poisson’s ratio in their material properties and lay more emphasis on the geometry of the slope whereas LEM considers uniaxial compressive strength of the rock, disturbance factors like blasting damage during slope excavation and also mi and s parameters of Hoek-Brown [15]. Based on the experience of sliding and slope failure experienced during excavation of powerhouse backslope, LEM appears to give a more conservative assessment of the instability of the powerhouse backslope than FEM.

where mα= moment equilibrium
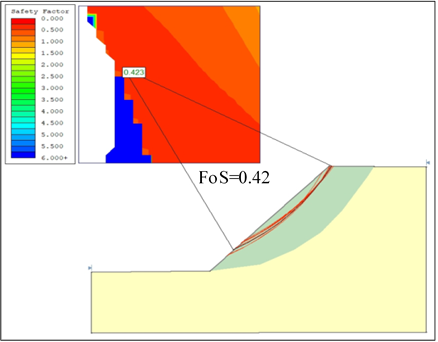 Figure 17. Critical slip circle and calculated FOS determined by Slide
 4.9. Analysis of the Support Installed to Stabilize the Powerhouse Backslope
Redesign of powerhouse backslope excavation was carried out following its major failure. The excavation of the backslope started from EL ±1510M. A cross drain was constructed at El±1520M to drain out the surface runoff. The slope was cut down to the level of ±1330M. Thus a vertical slope of about 180m height with intermediate benches at 15m interval was to be stabilized, which was a challenging task.
Back analysis was carried out with the cable anchor support in the backslope of the powerhouse by LEM and the result shows that FoS increased considerably upto 1.7 as shown in Fig. 18. Thus installation of cable anchors restricted the movement of the slumped rockmass leading to the stabilization of backslope which was also reaffirmed by various instrumentation readings installed in the powerhouse backslope. In addition, four number of drifts were excavated to carry out grouting of the open joints as shown in Fig. 3. The drifts were reinforced with steel and concrete up to crown to bear the induced stresses imparted by the rock cover.
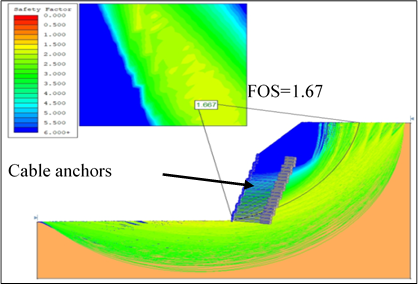 Figure 18. LEM analysis showing increase in FoS value after installation of cable anchors
 As per the support analysis, cable anchors of length 35m were provided in the cutslope above each benches as shown in Fig. 19. The fixed and free length of the cable anchors are 9m and 26m respectively. The fixed 9m length at the end of cable anchor was fully grouted in the beginning and stressing was done for checking the performance of grout/fixed length.
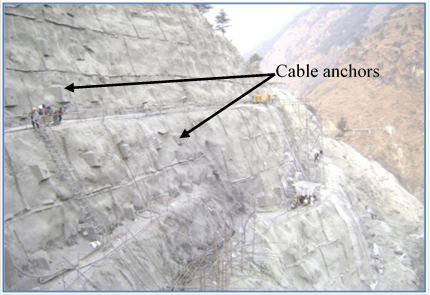 Figure 19. Backslope stabilization by cable anchors
 5. Analysis of Stress and Deformation Encountered during Rock Bursting
5.1 Back Calculation of Magnitude of In-Situ Stresses to Analyze Rock Bursting
Based on the world stress map [16], it is found that in the study area, the direction of in-situ vertical and horizontal stresses (S65°W) are oriented subparallel to the major joint set (270°/70°) and at high angle (50°) with the tunnel alignment (N195°) as shown in Fig. 20.
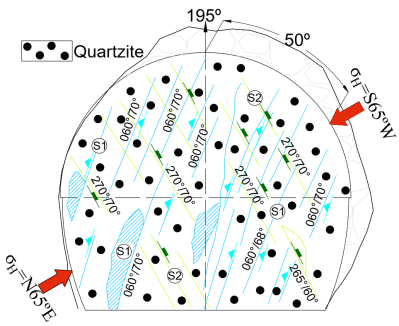 Figure 20. Geological face log of HRT showing principal stress direction, σH
According to Laubscher [17], both the above conditions are conducive for rock bursting which has been experienced frequently during tunnel excavation in massive and brittle quartzite under a high superincumbent cover ranging from 750m to 1600m. On the basis of rock bursting events experienced during excavation in quartzite rockmass in head race tunnel (HRT) of Parbati hydroelectric project-II as shown in Fig. 21, back analysis of magnitude of in-situ stresses in rock bursting zones was carried out using FEM software Phase 2, v.8.0 [18] to determine the role of strength, elastic properties of the rockmass and field stress ratio in causing rock bursting.
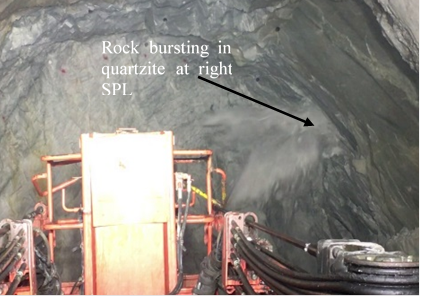 Figure 21. Rock bursting in right springline (SPL) area of HRT
 Principal stress, deformation values and strength factors at two different stress ratios corresponding to minimum and maximum overburden cover of 750m and 1600m respectively were determined using numerical method.
In-situ vertical stress σV was calculated from the equation:
where γ = density of the rock, Z= superincumbent cover above the tunnel section.
In-situ horizontal stress σH was calculated from Hoek and Brown [15] equation:
where K0 is the field stress ratio defined by the equation:
In this study, the rockmass inside the tunnel has been considered homogeneous, perfectly plastic material subjected to uniform near field stresses. Generalized Hoek and Brown failure criterion was adopted for calculation of stress and deformation parameters. Geomechanical and stress parameters of the rockmass considered for study are shown in Table 2 and Table 3.
Table 2. Geomechanical parameters of rockmass considered for the study
|
Rock type |
Geomechanical parameters of rockmass |
||||||||
|
Z (M) |
GSI |
UCS (MPa) |
γ (MN/m3) |
mi |
φ (°) |
c (MPa) |
ν |
Ei (GPa) |
|
|
Quartzite |
750 |
70 |
100 |
0.026 |
20 |
48.5 |
31 |
0.2 |
41 |
|
1600 |
70 |
100 |
0.026 |
20 |
48.5 |
31 |
0.2 |
41 |
|
Table 3. Stress parameters of rockmass considered for the study
|
Rock type |
Stresses |
||
| K0 | σV | σH | |
|
Quartzite |
1.47 |
20 |
29 |
|
0.9 |
42 |
37 |
|
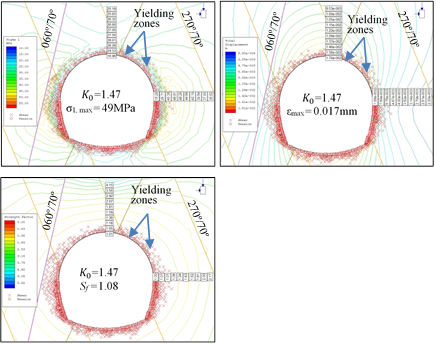
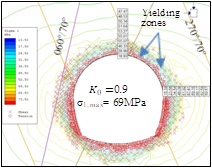
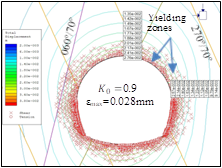
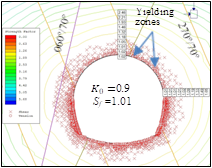
From Fig. 22 & Fig. 23, it can be interpreted that with decrease in field stress ratio, K0 or with increase in in-situ stresses, σV and σH due to increase in depth of overburden, the values of principal stress, σ1 and deformation, ε increase leading to the decrease in strength factor, Sf (<1.5) in both the crown and spring line area of the tunnel. The magnitude of the principal stress, σ1 increases upto 1.75 times after excavation under both the minimum and maximum overburden cover as determined from the numerical modelling and shown in Fig. 24. The yielding due to shear also concentrates more at lower field stress ( K0=0.97) while the yielding due to tension concentrates more in the area of intersection of the strike of the major joints with the tunnel axis (Fig. 22 & 23).
5.2 Stabilization Measures adopted for Rock Bursting
Drilling of stress relief holes of 76mm dia at face, application of 100-150mm thick steel fibre reinforced shotcrete along tunnel profile and installation of long rock anchors in crown and wall at smaller spacing were the rock support installed in the tunnel to negotiate rock bursting conditions.
Stress relief holes release the accumulated elastic strain energy and convert radial stress into tangential stress as shown in Fig. 25. It also transfers the high stresses to the deeper surrounding rock, thus reducing the intensity of bursting. The position and orientation of stress relief holes were improvised depending on the direction of stress release. Shotcrete has higher ductility than backfill concrete and is thus a more effective support measure than rigid rib support in rock bursting conditions. The above installed support measures effectively decrease total deformations due to rock bursting in quartzite as shown in Fig. 26.
the intensity of bursting. The position and orientation of stress relief holes were improvised depending on the direction of stress release. Shotcrete has higher ductility than backfill concrete and is thus a more effective support measure than rigid rib support in rock bursting conditions. The above installed support measures effectively decrease total deformations due to rock bursting in quartzite as shown in Fig. 26.
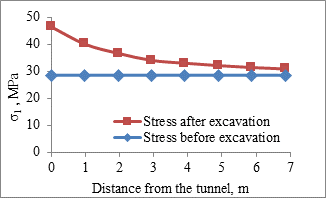 Figure 24. Stress magnitude before and after excavation under rock bursting conditions in the study area
 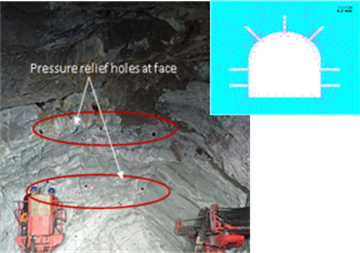 Figure 25. Drilling of stress relief holes in the tunnel of the study area to reduce rock bursting; (Inset) stress relief holes converting radial stress to tangential stress
 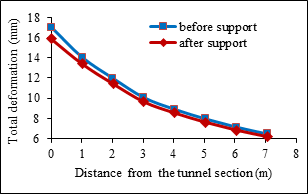 Figure 26. Deformation magnitude before and after installation of support in the study area
 6. Conclusion
The paper reviews two events of geological hazards encountered in a mega hydropower project located in Lesser Himalayan region of India. The inferences drawn from the study are as follows:
(a) The causative factors of powerhouse backslope failure in the study area are slumped rockmass of weak strength, valley dipping open joints, crushed rockfill shear seams and heavy rainfall.
(b) Kinematic analysis shows that the slope is vulnerable to both planar and wedge failure due to unfavourable orientation of major joint sets intersecting the rockmass.
(c) Stability analysis by FEM & LEM shows elasto-plastic deformation in toe area of the slope and development of critical shear/slip surface failure upto the depth of 10-15m. FoS calculated through FEM & LEM shows a value of 0.6 and 0.4 respectively which is substantially lower than the desired factor of safety.
(d) After the failure, height of the backslope was increased upto 180m with berms at 15m interval. 35m long fully grouted cable anchors, consolidation grouting, shotcrete, excavation and concreting of 4 no. drifts were carried out to stabilize the backslope.
(e) Frequent rock bursting during tunnelling were experienced due to high overburden cover, unfavourable orientation of tunnel and major joint sets w.r.t. the direction of principal stresses.
(f) Stress analysis through FEM shows both yield and deformation increase with decrease in field stress ratio. Drilling of stress relief holes, 100mm thick steel fibre reinforced shotcrete and 4m long rock anchors @ 1.5m c/c spacing were applied to stabilize rock bursting.
References
[1] K.S.Valdiya and S.K. Bartarya, "Diminishing discharges of mountain spring in a part of Kumaun Himalaya," Current Science, vol. 58, pp.417-426, 1989.
[2] C. Matthews, Z. Farook and P.R. Helm, "Slope stability analysis-limit equilibrium or the finite element method?," Ground Engineering, pp. 22-28, 2014.
View Article
[3] A. Burman, S.P. Acharya, R. Sahay and D. Maity, "Comparative study of slope stability analysis using traditional limit equilibrium method and finite element method," Asian Journal of Civil Engineering, vol. 16 (4), pp. 467-492, 2015.
[4] S. O. Choi and S.K. Chung, "Stability analysis of jointed rock slopes using the Barton-Bandis constitutive model in UDEC," International Journal of Rock Mechanics and Mining Sciences, vol. 41, pp 469, 2004.
View Article
[5] M. GhoshRoy, N. Singh, S. Moideen and B. Basu, "Analysis of stress induced deformation and evaluation of performance of Tunnel Boring Machine in extraordinary geological conditions encountered during excavation of longest head race tunnel in Himalaya: a case study," Lecture Notes in Civil Engineering, vol. 481, pp 285-295, 2024.
View Article
[6] K.K. Panthi, "Evaluation of rock bursting phenomena in a tunnel in the Himalayas," Bulletin of Engineering Geology and Environment, vol. 71, pp 761-769, 2012.
View Article
[7] NHPC, "Salient Features-Parbati hydroelectric project stage II, Himachal Pradesh, India," Contract agreement for civil and hydro-mechanical works for headrace tunnel and associated works (PB-2A), vol. 1, NHPC, India, 2000.
[8] S. Bhatnagar and R. Das, "Managing Powerhouse Back slope: A case study," Proceedings of Indorock Conference, India, pp. 575-583, 2013.
[9] IS: 14448, "Indian Standard method for reinforcement of rock slopes with plane wedge failure," Bureau of Indian Standards, New Delhi, 2022.
[10] IS: 6512, "Indian Standard method for criteria for design of solid gravity dams," Bureau of Indian Standards, New Delhi, 2020.
[11] PLAXIS, "Finite element code for soil and rock analyses," PLAXIS‐2D Version 8, Reference Manual, Edited by Brinkgreve, et al., DUT, the Netherlands, www.plaxis.nl, 2004.
[12] T.N. Singh, V. Bhardwaj, L. Dhonta and K. Sarkar, "Numerical analysis of instability of slope near Rudraprayag area, Uttaranchal, India," Journal of Engineering Geology, vol. 34, pp. 33-41, 2005.
[13] SLIDE, "Stability analysis for soil and rock slopes," Slide, User's Guide, Geomechanics Software Solutions, Rocscience Inc., Canada, www.rocscience.com, 2003.
[14] L. W. Abramson, T. S. Lee, S. Sharma and G. M. Boyce, "Slope stability concepts. Slope stabilisation and stabilisation methods," Second edition, published by John Willey & Sons Inc., pp. 329‐461, 2002.
[15] E. Hoek and E. T. Brown, "Underground excavations in rock," The Institute of Mining and Metallurgy, London, 1980.
[16] World Stress Map, "World stress map based on the database release 2016," http://www-wsm.physik.uni-karlsruhe.de/pub/stress_data/stress_data_frame.html,2016 [17] D.H. Laubscher, "A geomechanics classification system for the rating of rockmass in mine design," Journal of South African Institute of Mining and Metallurgy, vol. 90, pp. 257-273, 1990.
[18] Rocscience, "A 2D finite element program for calculating stresses and estimating support around the underground excavation," Geomechanics software and Research, Rocscience Inc, Canada, www.rocscience.com, 2012
[1] K.S.Valdiya and S.K. Bartarya, "Diminishing discharges of mountain spring in a part of Kumaun Himalaya," Current Science, vol. 58, pp.417-426, 1989.
[2] C. Matthews, Z. Farook and P.R. Helm, "Slope stability analysis-limit equilibrium or the finite element method?," Ground Engineering, pp. 22-28, 2014. View Article
[3] A. Burman, S.P. Acharya, R. Sahay and D. Maity, "Comparative study of slope stability analysis using traditional limit equilibrium method and finite element method," Asian Journal of Civil Engineering, vol. 16 (4), pp. 467-492, 2015.
[4] S. O. Choi and S.K. Chung, "Stability analysis of jointed rock slopes using the Barton-Bandis constitutive model in UDEC," International Journal of Rock Mechanics and Mining Sciences, vol. 41, pp 469, 2004. View Article
[5] M. GhoshRoy, N. Singh, S. Moideen and B. Basu, "Analysis of stress induced deformation and evaluation of performance of Tunnel Boring Machine in extraordinary geological conditions encountered during excavation of longest head race tunnel in Himalaya: a case study," Lecture Notes in Civil Engineering, vol. 481, pp 285-295, 2024. View Article
[6] K.K. Panthi, "Evaluation of rock bursting phenomena in a tunnel in the Himalayas," Bulletin of Engineering Geology and Environment, vol. 71, pp 761-769, 2012. View Article
[7] NHPC, "Salient Features-Parbati hydroelectric project stage II, Himachal Pradesh, India," Contract agreement for civil and hydro-mechanical works for headrace tunnel and associated works (PB-2A), vol. 1, NHPC, India, 2000.
[8] S. Bhatnagar and R. Das, "Managing Powerhouse Back slope: A case study," Proceedings of Indorock Conference, India, pp. 575-583, 2013.
[9] IS: 14448, "Indian Standard method for reinforcement of rock slopes with plane wedge failure," Bureau of Indian Standards, New Delhi, 2022.
[10] IS: 6512, "Indian Standard method for criteria for design of solid gravity dams," Bureau of Indian Standards, New Delhi, 2020.
[11] PLAXIS, "Finite element code for soil and rock analyses," PLAXIS‐2D Version 8, Reference Manual, Edited by Brinkgreve, et al., DUT, the Netherlands, www.plaxis.nl, 2004.
[12] T.N. Singh, V. Bhardwaj, L. Dhonta and K. Sarkar, "Numerical analysis of instability of slope near Rudraprayag area, Uttaranchal, India," Journal of Engineering Geology, vol. 34, pp. 33-41, 2005.
[13] SLIDE, "Stability analysis for soil and rock slopes," Slide, User's Guide, Geomechanics Software Solutions, Rocscience Inc., Canada, www.rocscience.com, 2003.
[14] L. W. Abramson, T. S. Lee, S. Sharma and G. M. Boyce, "Slope stability concepts. Slope stabilisation and stabilisation methods," Second edition, published by John Willey & Sons Inc., pp. 329‐461, 2002.
[15] E. Hoek and E. T. Brown, "Underground excavations in rock," The Institute of Mining and Metallurgy, London, 1980.
[16] World Stress Map, "World stress map based on the database release 2016," http://www-wsm.physik.uni-karlsruhe.de/pub/stress_data/stress_data_frame.html,2016 [17] D.H. Laubscher, "A geomechanics classification system for the rating of rockmass in mine design," Journal of South African Institute of Mining and Metallurgy, vol. 90, pp. 257-273, 1990.
[18] Rocscience, "A 2D finite element program for calculating stresses and estimating support around the underground excavation," Geomechanics software and Research, Rocscience Inc, Canada, www.rocscience.com, 2012