International Journal of Civil Infrastructure (IJCI)
ISSN: 2563-8084

Volume 8 - Year 2025- Pages 235-241
DOI: 10.11159/ijci.2025.024
Interpretable Machine Learning Framework for Understanding Steel Bridge Corrosion Using Nationwide Inspection Data
Yongpeng Zhao1, Kouichi Takeya1, Yuichi Ito1, Eiichi Sasaki1
1Institute of Science Tokyo, Department of Civil and Environmental Engineering
2-12-1 Ookayama, Meguro-ku, Tokyo, Japan 152-8550
zhao.y.0782@m.isct.ac.jp, takeya.k.aa@m.titech.ac.jp, ito-y@fa2.so-net.ne.jp, sasaki.e.55bb@m.isct.ac.jp
Abstract - Considering the increasing number of aging infrastructure and the declining availability of skilled technicians in Japan, there is a growing demand for more efficient maintenance strategies. Leveraging information from existing inspection data presents a promising approach to address this challenge. This study proposes a novel model-interpretation-based framework that integrates multiple databases to quantitatively evaluate the effects of internal structural conditions and environmental factors on the corrosion of steel bridge main girders. By enhancing the interpretability of predictive models, the proposed framework provides actionable insights to support targeted data-driven maintenance planning. The proposed approach shows potential to be broadly applicable for the maintenance of various civil engineering structures, contributing to the development of more efficient inspection and maintenance programs, which can rapidly adapt to changing environmental conditions.
Keywords: corrosion, steel bridge, deterioration model, machine learning, model interpretation.
© Copyright 2025 Authors - This is an Open Access article published under the Creative Commons Attribution License terms. Unrestricted use, distribution, and reproduction in any medium are permitted, provided the original work is properly cited.
Date Received: 2025-05-26
Date Revised: 2025-09-30
Date Accepted: 2025-11-26
Date Published: 2025-12-22
1. Introduction
Road infrastructure built in Japan during the post-war economic boom is aging while the maintenance workforce continues to decline [1] [2]. In response, standardized inspections were mandated in 2014, resulting in a nationwide data platform, xROAD (the nationally unified data platform) to be constructed. This platform remains under construction and is based on the digital road map database and other databases, and promotes the development of databases for each road facility. Integrating these platforms with publicly available environmental and bridge data is expected to help promote the development of data-based technologies that can be used in various fields beyond maintenance and management.
Machine learning (ML) provides powerful capabilities for extracting valuable insights from large-scale infrastructure inspection data. However, although complex models can achieve high predictive accuracy, their limited interpretability often constrains practical implementation in engineering decision-making. Model interpretation techniques address this challenge by revealing the key factors that drive model predictions [3], thereby enhancing transparency, credibility, and the overall applicability of ML-based approaches in infrastructure asset management.
Several studies have explored bridge deterioration using bridge inspection data from various methods. Minami et al. [4] identified coastline proximity and material of the structure as key factors in Ishikawa Prefecture. Okazaki et al. [5] emphasized the role of age in crack propagation for concrete girders. Miao [6] applied artificial neural networks (ANN) and sensitivity analysis to predict deterioration with approximately 65% accuracy. Santos et al. [7] used Markov and ANN models for inspection interval optimization on over 10,000 Brazilian bridges. Igarashi and Abe [8] combined ensemble learning with interpretability techniques to assess crack severity but noted limitations in classification-based approaches. Saito [9] used multiple regression on public data to evaluate geographic and weather-related factors, highlighting the need for bridge-type-specific analysis. While these studies have contributed valuable insights, several limitations remain. Firstly, many approaches prioritized predictive accuracy at the cost of interpretability or relied on limited regional datasets, hindering their generalization ability and practical use for maintenance planning. Secondly, few studies have focused on the corrosion of steel bridge main girders, despite their critical role in structural safety.
To bridge these research gaps, this study establishes a model-interpretation-based analytical framework that integrates nationwide bridge inspection records with publicly accessible structural and environmental datasets. Focusing specifically on the main girders of steel bridges, the proposed framework employs interpretable machine learning techniques to quantitatively evaluate the relative influence of key factors on corrosion progression. Through this approach, the study aims to derive actionable, data-driven insights that can inform more efficient and targeted maintenance strategies for aging bridge infrastructure.
2. Methodology
2. 1. Corrosion mechanism
Corrosion in steel bridges is driven by both environmental exposure and structural configuration. It occurs when steel is exposed to moisture and oxygen, with salts, acids, and higher temperatures accelerating the process, particularly in coastal and mountainous regions. Structural details such as girder ends and joints tend to trap moisture and contaminants, increasing deterioration risk. Prolonged sunlight exposure further degrades protective coatings, heightening surface vulnerability. Accordingly, this study’s data collection was designed to capture these environmental and structural factors influencing corrosion progression.
2. 2. Data collection and integration
In this study, multiple publicly accessible datasets were integrated to obtain comprehensive information on bridge characteristics, environmental conditions, and bridge maintenance history. The primary source of inspection data is the national road facility inspection database, part of the xROAD platform, which has been publicly available since mid-2022. This centralized database promotes technological advancement, efficient maintenance planning, and academic research by providing access to periodic inspection records. It includes detailed damage assessments categorized, as well as records of various major bridge components, along with traffic volumes and large vehicle mixing rates.
Additional structural and maintenance attributes, including bridge type, repair history, and coating information, were obtained from MICHI (Bridge Management Chart and Road Management Data), which provides open access through APIs and downloadable datasets.
Meteorological parameters were derived from AMeDAS (Automated Meteorological Data Acquisition System), operated by the Japan Meteorological Agency (JMA). Two complementary datasets were utilized: long-term average values from the nearest observation stations and high-resolution mesh annual normals interpolated from AMeDAS data, thereby enabling localized climate characterization for each bridge.
To further represent environmental exposure, two geographical indicators, elevation and distance from the shoreline, were incorporated. Elevation data were obtained from the Geospatial Information Authority of Japan (GSI), while shoreline distances were computed based on bridge coordinates and coastal boundary datasets.
2.3. Data Preprocessing
2.3.1. Deterioration Indicator
The inspection records used for this study document bridge damage taken at three different levels: full bridge, per span, and component element. Among these, component-level damage can be assessed using a quantitative criterion, whereas evaluations at the span and bridge levels rely more heavily on the experience and subjective judgment of an inspector.
Indicators of existing bridge health, such as soundness level, provide a broad view into overall bridge condition but fail to capture the severity of specific deterioration types in individual components. However, the available data that details the damage level of individual component elements is very fragmented and inconvenient to use. This hinders the development of targeted maintenance strategies, as understanding specific deterioration is essential for prioritizing interventions and allocating resources efficiently. This study has considered several conventional bridge health indicators, including the maximum damage level, soundness level, and the damage level development rate. However, these indicators often lack sensitivity to damage distribution or require subjective interpretation by inspectors. A new indicator, the damage score per unit area (Saa), has therefore been developed in this study to overcome these shortcomings.
The proposed indicator, Saa, transforms component-level damage assessments into quantitative scores according to the classification scheme presented in Table 1 and normalizes the cumulative damage score by the bridge’s deck area (length × width). This normalization enables consistent comparison of deterioration severity across structures of varying dimensions. Designed to capture specific deterioration patterns within individual components, Saa provides a refined, component-level assessment of structural health. Compared with conventional categorical soundness ratings, Saa offers three major advantages:
(1) It supports detailed and component-specific maintenance planning,
(2) It provides continuous rather than discrete values, allowing more precise differentiation of damage severity,
(3) It reduces dependence on subjective judgment by inspectors, thereby enhancing objectivity and reproducibility in condition evaluation.
Table 1: Damage Level to Score.
|
Damage Level |
a |
b |
c |
d |
e |
|
Score |
0 |
1 |
2 |
3 |
4 |
2.3.2. Data cleaning and selection
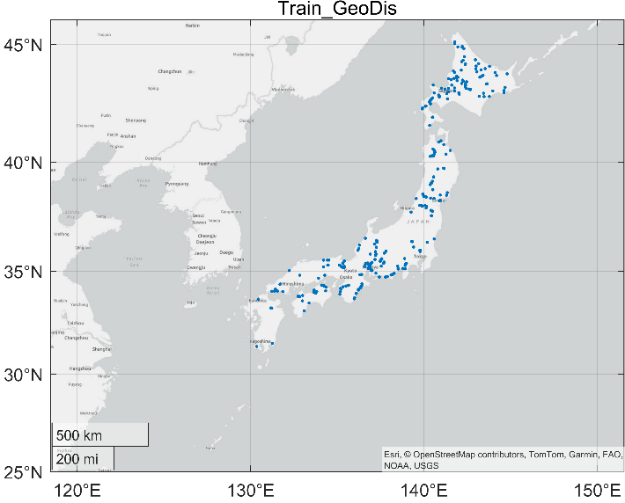
The original dataset consisted of 32,174 inspection records of both steel and concrete bridges from two rounds of nationwide surveys conducted between 2014 and 2018, and 2019 to 2023. Among these records, complete information from both inspections was available for 12,279 bridges, and these were merged into a single dataset. As this study focuses on the corrosion behaviour of steel bridge main girders and to reduce noise, the samples were limited to those from steel bridges. Among 3,981 steel bridge samples, bridges with only simple girder structures (n = 2,005) were selected as these structures are more uniform in behaviour and easier to compare. Since coating materials affect the development of corrosion, only samples (n = 1,365) with clearly recorded painting histories were included. Finally, to ensure consistency in the coating conditions across samples and to avoid the influence of mixed coatings, samples with only phthalic resin coating (n = 375) were selected, as this was the most common coating type in the dataset. Figure 1 shows the distribution of the selected bridges. Bridges from Kyushu and Okinawa are underrepresented in the final dataset. These regions have higher annual temperatures and different corrosion environments compared with the rest of Japan. Because of this imbalance, the model does not fully capture how high-temperature conditions influence corrosion progression. Adding more samples from warm climatic zones would help improve the robustness of the model.
This cleaning and selection process was carried out to reduce data noise while ensuring the selected dataset retains structural diversity and sufficient generality for steel girder bridges.
2.3.3. Normalization
To ensure consistency across variables and improve the stability of model training, all feature values were normalized to a comparable scale. Based on the distributional characteristics of each feature, two normalization approaches were adopted according to skewness values. Logarithmic scaling for features with skewness greater than one, and z-score standardization for those with skewness less than or equal to one. Since logarithmic transformation requires strictly positive values, a data-shifting procedure was applied when necessary. Specifically, for any feature x with a minimum value min(x) < 1, all observations were adjusted by adding (1 − min(x)) before transformation, ensuring that the scaled values remained positive and numerically stable.
2.3.4. Dimensionality reduction
Principal Component Analysis (PCA) was employed to reduce feature dimensionality and alleviate multicollinearity among correlated variables. By deriving orthogonal principal components (PCs) as linear combinations of the original features, PCA projects high-dimensional data into a lower-dimensional subspace while preserving most of the variance. Although this transformation inevitably leads to partial information loss and reduced interpretability, it enhances model stability and computational efficiency. Accordingly, PCA was applied exclusively to groups of variables exhibiting strong intercorrelation.
2.4. Model Selection and Evaluation
Considering the small dataset size, this study avoided overly complex models. This study focuses on commonly used nonlinear algorithms that are effective in capturing nonlinear patterns and feature interactions, namely Support Vector Machine (SVM), Artificial Neural Networks (ANNs), Random Forest (RF), and Gaussian Process Regression (GPR). Hyperparameter optimization enhances performance, which mean squared error (MSE) is evaluated. Grid Search is applied to both ANN and RF, while Random Search is used for GPR and SVM to balance search efficiency with model complexity. A 5-fold cross-validation was conducted for the accurate assessment of the performance of the model.
2.5. Model Interpretation
Model interpretation is a critical tool to help clarify the underlying mechanisms of machine learning models and facilitate prediction validation, model refinement, and extraction of actionable insights. While interpretable models such as decision trees permit direct analysis of feature contributions, more complex models require advanced interpretability techniques. Among these techniques, SHapley Additive exPlanations (SHAP) [10], proposed in 2017 and grounded in game-theoretic Shapley values, has gained prominence for its model-agnostic nature and capacity to provide local and global interpretative insights. Through interpretation algorism, it has become possible to quantify feature importance, capture feature interactions, and understand their influence on model outputs.
3. Results and Discussion
3.1. Dataset
There were 375 samples retained after cleaning and filtering, where all feature values were normalized to an approximate range. Correlation analysis revealed strong interdependencies among meteorology-related features (Figure 2). Features that exhibited correlation coefficients ≥0.7 with at least two other features were selected for PCA. PC1 and PC2 are the first and second principal components derived through PCA applied to highly correlated meteorological features. These 2 Principal components explained 94.57% of the total variance, effectively capturing most of the information in the original six features. Accordingly, the original variables were replaced by PC1 and PC2 in subsequent analyses. As shown in Figure 3, the features remaining after the PCA exhibit weaker correlations with each other.
The target variable Saa, introduced in this study, quantifies the severity of corrosion damage by normalizing damage scores across the bridge area. Saa provides a continuous and component-specific measure of deterioration, enhancing objectivity compared with traditional categorical indicators like soundness level.
Although the final analytical set only included 375 bridges, which may appear limited, this sample was intentionally selected to maintain uniformity across structure and coating and thus improve internal validity. A five-fold cross-validation was utilized during the model training step to reduce the risk of overfitting due to the limited sample size.
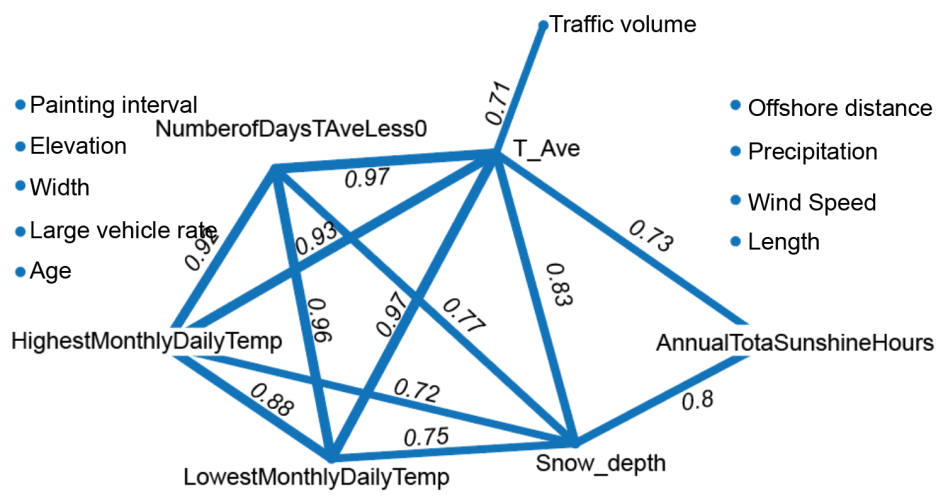
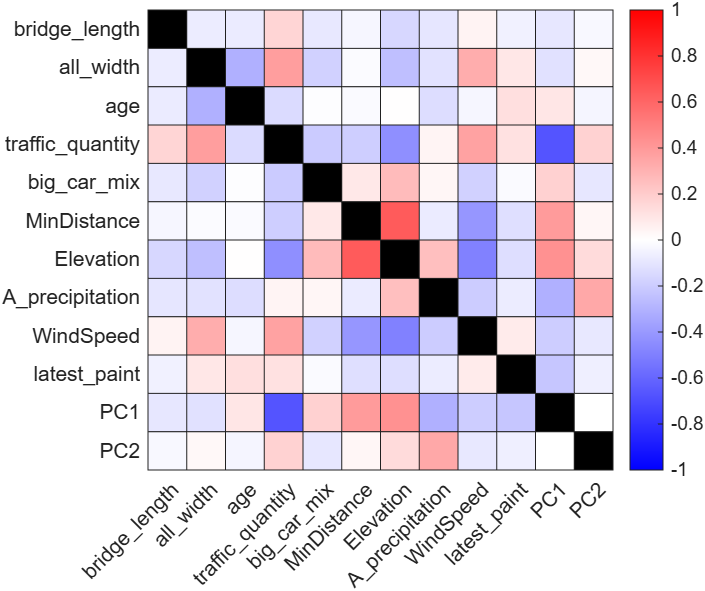
Table 2: Summary statistics of input features used for model training
|
Before Normalization |
After Normalization |
|||||||||
|
Features |
Min |
Max |
Avg |
Std |
Min |
Max |
Mean |
Std |
||
|
Length |
7.4 |
521.1 |
46.0 |
51.9 |
2.0 |
6.3 |
3.5 |
0.7 |
||
|
Width |
4.1 |
51.5 |
11.4 |
4.6 |
1.4 |
3.9 |
2.4 |
0.3 |
||
|
Age |
19.0 |
82.0 |
45.3 |
9.0 |
-2.9 |
4.1 |
0.0 |
1.0 |
||
|
Traffic volume |
35 |
89697 |
13910 |
13911.0 |
3.6 |
11.4 |
9.0 |
1.2 |
||
|
Large vehicle rate |
2.5 |
69.4 |
20.3 |
9.3 |
-1.9 |
5.3 |
0.0 |
1.0 |
||
|
Offshore distance |
0.1 |
106.9 |
28.9 |
24.4 |
-1.2 |
3.2 |
0.0 |
1.0 |
||
|
Elevation |
0.0 |
1053.1 |
149.0 |
189.1 |
0.0 |
7.0 |
4.1 |
1.5 |
||
|
Precipitation |
778.9 |
3469.0 |
1734.3 |
574.8 |
-1.7 |
3.0 |
0.0 |
1.0 |
||
|
Wind Speed |
0.0 |
4.9 |
2.0 |
0.8 |
-2.4 |
3.5 |
0.0 |
1.0 |
||
|
Painting interval |
3.0 |
50.0 |
20.4 |
7.5 |
-2.3 |
4.0 |
0.0 |
1.0 |
||
|
PC1 |
-3.9 |
4.8 |
0.0 |
2.7 |
||||||
|
PC2 |
-2.3 |
2.6 |
0.0 |
0.9 |
||||||
|
Saa |
0.0 |
0.8 |
0.1 |
0.1 |
0.0 |
0.8 |
0.1 |
0.1 |
||
3.2. Model
Table 2 summarizes the statistical characteristics of the features used for model training. Table 3 shows the minimum cross-validation MSE and hyperparameters, where GPR was identified as the most suitable approach. The model for interpretation was trained using the complete dataset and specified hyperparameters, achieving high accuracy (MSE=1.69×10⁻⁶, MAE=4.25×10⁻⁴, R2=0.99). Its performance, based on MSE considering the full dataset, exceeded that of cross-validation, raising concerns of overfitting, which limits accurate predictions on unseen data. However, since hyperparameter tuning guided by cross-validation and evaluation occurred on the test set, the performance difference is likely due to insufficient data rather than overfitting. To improve model performance, it is important to ensure an adequate sample size, minimize conditional biases during data screening, and perform careful hyperparameter tuning within the training process.
Table 3: Minimum MSE (CV) results from hyperparameter tuning.
|
Model |
MSE(CV) |
Hyperparameters |
|
|
ANN |
0.00656 |
Activation |
"sigmoid" |
|
Layer size |
[60] |
||
|
Lambda |
7.7e-4 |
||
|
RF |
0.00637 |
Min Leaf Size |
3 |
|
Max Num Splits |
155 |
||
|
GPR |
0.00606 |
Sigma |
0.005301 |
|
Basis Function |
"linear" |
||
|
Kernel Function |
"ARDRationalQuadratic" |
||
|
SVM |
0.00671 |
Epsilon |
0.466 |
|
Kernal Founction |
"gaussian" |
||
|
Box Constraint |
638.07 |
||
3.3. Interpretation
Table 4 presents Spearman's correlation coefficients between each predictor feature and its Shapley value. Age, elevation, and length show the highest correlations.
The Shapley analysis results (Figure 4) indicate that shorter and narrower bridges exhibit higher Shapley values, suggesting that corrosion tends to concentrate in smaller structures where girder-end regions, typically more prone to moisture retention and paint degradation, represent a larger proportion of the main girder area. Conversely, the relative influence of localized corrosion diminishes as bridge size increases. Bridge age shows a strong positive correlation with Shapley values, reflecting the cumulative effect of long-term exposure and material degradation. Although proximity to the coastline itself does not directly affect the Shapley distribution, bridges located in low-elevation areas demonstrate higher values, consistent with the moderate correlation between elevation and offshore distance (ρ = 0.64) and the enhanced corrosion risk in coastal environments. Wind speed displays a negative association with Shapley values, likely due to its role in promoting surface drying and reducing moisture accumulation. These findings imply that maintenance efforts should prioritize older, smaller bridges situated in low-lying, low-wind, and high-precipitation regions. As summarized in Figure 5, the five most influential factors identified by mean absolute Shapley values are PC2 (the dominant meteorological component), traffic volume, annual precipitation, bridge width, and bridge length.
Table 4. The correlation between feature value and its Shapley value.
|
Feature |
Correlation coefficient |
|
Length |
-0.75 |
|
Width |
-0.52 |
|
Age |
0.95 |
|
Traffic volume |
-0.39 |
|
Large vehicle rate |
0.28 |
|
Offshore distance |
-0.45 |
|
Elevation |
-0.81 |
|
Precipitation |
0.54 |
|
Wind Speed |
-0.58 |
|
Painting interval |
0.48 |
|
PC1 |
0.74 |
|
PC2 |
0.57 |
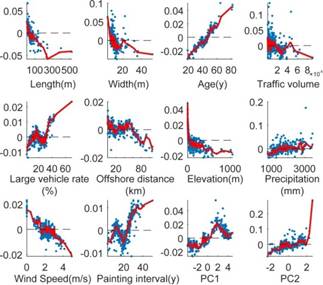
The analysis revealed a weak negative correlation between traffic volume and corrosion severity. Although higher traffic volumes are generally expected to increase emissions of acidic pollutants that accelerate corrosion, this effect was not evident in the present dataset. The weak association suggests that other factors, such as regional climate, bridge type, or maintenance frequency, may play more dominant roles in influencing corrosion progression. Further research incorporating maintenance records, traffic composition, and site-specific environmental data is required to clarify the underlying mechanisms governing this relationship.
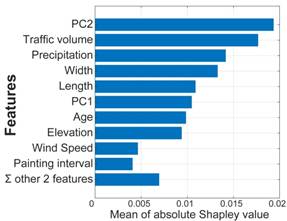
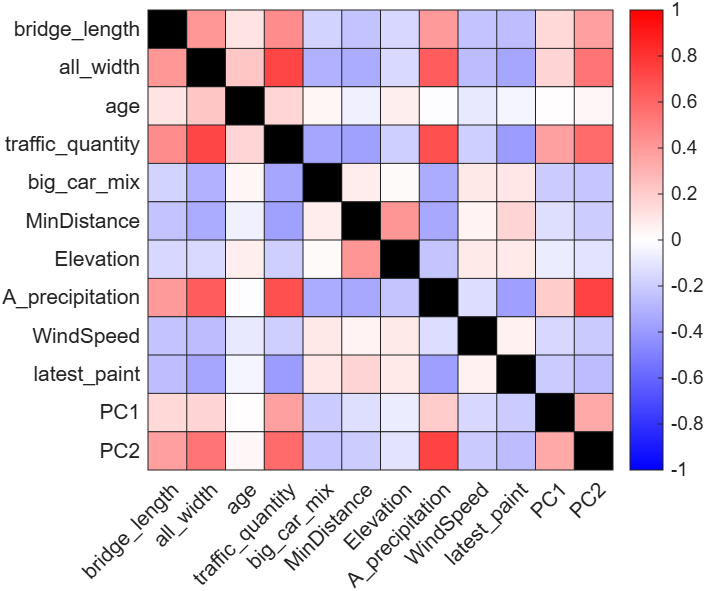
Figure 6 presents the correlation matrix of the SHAP values among all explanatory variables. In Figure 6, the SHAP values of traffic volume and annual precipitation show a clear positive correlation, indicating an interaction between these two factors. Combined with the trends in Figure 4, this suggests that in regions with high precipitation, bridges with low traffic volume tend to exhibit larger SHAP values and therefore higher corrosion risk. One possible reason is that low-traffic bridges in humid climates dry more slowly and allow moisture to remain on girder surfaces for longer periods, which accelerates corrosion. In daily maintenance practice, this implies that low-traffic bridges located in wet climatic zones may need more attention in inspection, even if their traffic demand is low.
While SHAP assumes that features contribute independently to the model output, the observed correlations indicate that the model jointly utilizes several features with similar influence patterns. Interestingly, some features with low correlations in the input data (see Figure 3) still exhibit strong correlations in their SHAP values, implying that the model learns nonlinear interactions among them. Therefore, the SHAP correlations reflect functional dependencies captured by the model rather than simple statistical associations among input variables.
The results highlight that environmental conditions and traffic volume play predominant roles in bridge deterioration. Due to the small sample size in this study, the generalization ability of these results is open to discussion.
4. Conclusion
This study developed an interpretable machine learning framework to analyse steel bridge corrosion using nationwide inspection data. By integrating structural, environmental, and maintenance databases and introducing a new corrosion indicator (Saa), the framework quantified the influence of key factors with high interpretability through SHAP analysis. Results highlighted that meteorological conditions, bridge geometry, and traffic volume are dominant in corrosion progression. Despite limitations in sample size and spatial balance, this approach establishes a foundation for scalable, data-driven, and transparent maintenance planning. Furthermore, by capturing the relationships between environmental factors and deterioration mechanisms, the proposed framework offers potential for assessing future corrosion risks under evolving climatic conditions. Future work will integrate sensor-based monitoring and spatial–temporal modelling to enhance real-time adaptability and support smart infrastructure management.
Acknowledgements
The author sincerely acknowledges the Subcommittee on Practical Research of AI and Data Science, Committee on Structural Engineering, Japan Society of Civil Engineers, for providing access to the bridge inspection and management database used in this study. The author also gratefully appreciates the financial support provided by the WISE-SSS Program of the Academy for Super Smart Society, Institute of Science Tokyo.
References
[1] MLIT, "Current Situation and Issues in the Construction Industry," 2023. [Online]. Available: https://www.mlit.go.jp/policy/shingikai/content/001610913.pdf View Article
[2] MLIT, "Percentage of social infrastructure that is more than 50 years old after construction," Accessed: Jan. 01, 2025. [Online]. Available: https://www.mlit.go.jp/sogoseisaku/maintenance/_pdf/50year_percentage.pdf View Article
[3] A. Adadi and M. Berrada, "Peeking Inside the Black-Box: A Survey on Explainable Artificial Intelligence (XAI)," IEEE Access, vol. 6, pp. 52138-52160, 2018. View Article
[4] Takahiro MINAMI, Makoto FUJIU, Shoichiro NAKAYAMA, Jyunichi TAKAYAMA, and Yasuo CHIKATA, " Analysis of Relationship between Soundness of Bridges and Natural Environments," Journal of Japan Society of Civil Engineers, Ser. D3 (Infrastructure Planning and Management), vol. 72, no. 5, Art. no. 5, 2016. View Article
[5] Yuriko OKAZAKI, Shinichiro OKAZAKI, Pang-jo CHUN, Shingo ASAMOTO, and Kazuaki OKUBO, "Crack Propergation Model of Concrete Bridges in Shikoku Based Data Driven Approach," Journal of Japan Society of Civil Engineers, Ser. F4 (Construction and Management), vol. 74, no. 2, p. I_107-I_118, 2018. View Article
[6] P. Miao, "Prediction-Based Maintenance of Existing Bridges Using Neural Network and Sensitivity Analysis," Advances in Civil Engineering, vol. 2021, pp. 1-17, 2021. View Article
[7] A. F. Santos, M. S. Bonatte, H. S. Sousa, T. N. Bittencourt, and J. C. Matos, "Improvement of the Inspection Interval of Highway Bridges through Predictive Models of Deterioration," Buildings, vol. 12, no. 2, Art. no. 2, Jan. 2022. View Article
[8] Kouji IGARASHI, and Kazuhisa ABE, "Examination of Crack Damage Prediction in Concrete Bridges using Machine Learning Algorithms," Artificial Intelligence and Data Science, vol. 4, no. 4, pp. 1-15, 2023.
[9] Junpei Saito, "Factor Analysis of Geographical and Weather Conditions and Traffic Conditions Affecting the Deterioration Rate of Road Bridges in Japan," Journal of Structural Engineering A, vol. 70, pp. 126-140, 2024.
[10] S. M. Lundberg and S.-I. Lee, "A Unified Approach to Interpreting Model Predictions," Advances in Neural Information Processing Systems, vol. 30, 2017.