International Journal of Civil Infrastructure (IJCI)
ISSN: 2563-8084

Volume 8 - Year 2025- Pages 250-259
DOI: 10.11159/ijci.2025.026
A Workflow for Integrating Point Cloud Data and Eddy Current Measurements into 3D Digital Modelling of Existing Steel Structures
Ayako Akutsu1, Rikuo Omae1, Eiichi Sasaki1
1Institute of Science Tokyo
2-12-1 Ookayama Meguro, Tokyo, Japan
akutsu.a.aa@m.titech.ac.jp; omae.r.aa@m.titech.ac.jp; sasaki.e.ab@m.titech.ac.jp
Abstract - This paper presents a workflow that integrates point cloud data and pulsed eddy current measurements for developing 3D digital models that accurately represent the actual condition of existing steel structures, including areas affected by corrosion and subsequent retrofitting. The proposed workflow combines external geometric information obtained through terrestrial 3D laser scanning with internal material and thickness information derived from pulsed eddy current testing, thereby enabling both surface and subsurface conditions to be incorporated into a unified digital modelling framework. To evaluate its feasibility, a case study was conducted on a steel tubular column located in a coastal environment that had experienced corrosion and multiple reinforcement interventions. The workflow was applied to construct a finite element model capable of reproducing complex geometries and variable plate thicknesses caused by damage and repair, demonstrating the applicability of the proposed modelling process to deteriorated steel members. In addition, laboratory experiments were performed to examine the applicability of pulsed eddy current testing for estimating the thickness of overlapping steel plates, which cannot be captured by laser scanning alone. The results confirmed that the eddy current technique can provide internal information necessary for complementing point cloud–based surface models, thus improving the completeness of digital representations. Overall, this integrated workflow has the potential to enhance the accuracy and efficiency of structural modelling and assessment. By linking external and internal inspection data within a single digital framework, the proposed method supports data-driven decision-making for the maintenance and life-cycle management of ageing steel infrastructure.
Keywords: 3D digital modelling, Laser scanning, Point Cloud Data, FEA, Eddy Current.
© Copyright 2025 Authors - This is an Open Access article published under the Creative Commons Attribution License terms. Unrestricted use, distribution, and reproduction in any medium are permitted, provided the original work is properly cited.
Date Received: 2025-04-10
Date Revised: 2025-09-30
Date Accepted: 2025-10-19
Date Published: 2025-12-26
1. Introduction
Infrastructures that exceed their 50-year service life are expected to rapidly increase in number over the next five to ten years in Japan. Although 50 years is generally considered as the standard service life of such structures, infrastructures are now required to have a longer service life, and this can be extended using appropriate maintenance and management. However, current maintenance practices rely heavily on visual inspections, which require a large workforce. Also, due to the ageing population in Japan, securing sufficient personnel is becoming increasingly more difficult.
Moreover, in recent years, 3D data has proven to enhance and improve the efficiency of construction and infrastructure maintenance [1]. As a result, the use of 3D data is expected to become more critical, as well as the development of practical implementation methods. There are two main approaches for obtaining 3D data: constructing models based on design drawings and utilising point cloud data from laser scanning [2]-[4] or photogrammetry [5] [6]. The former approach can be problematic for older structures, as drawings may either be unavailable or fail to accurately reflect more recent structural changes due to corrosion damage or reinforcement. Although photogrammetry more accurately reflects current conditions, the volume of data and manual processing required proves challenging, particularly for large-scale structures.
In this study, a method to construct 3D models using point cloud data was investigated to more accurately represent the actual conditions of a given structure. Laser scanning was employed to capture point cloud data as it can perform efficient data acquisition in a short time. A high-precision 3D model was then constructed to reflect any changes in cross-section due to reinforcement or corrosion damage. The case study which followed focused on an existing steel tubular column located in a coastal area, tried using a 3D solid model to accurately incorporate and capture any surface irregularities due to corrosion or reinforcement plates. However, as the steel tubular column comprises a closed cross-section, it was not feasible to capture internal data. Therefore, a method was proposed to estimate and model the internal surface condition based on externally acquired point cloud data, and its effectiveness was examined. Furthermore, to evaluate the remaining thickness of corroded and any overlapping steel plates in reinforced areas, a non-destructive method employing pulsed eddy current testing was also investigated.
This study focuses on modelling corroded and reinforced steel structures that include complex surface irregularities and hidden multi-layered regions with unknown internal thickness. To complement point cloud–based external modelling, pulsed eddy current testing is introduced to evaluate the feasibility of estimating internal plate thickness, aiming to achieve a more complete digital representation of deteriorated steel members.
2. Development of a 3D Modelling Method Based on Point Cloud Data
This chapter outlines the development of a method to convert laser-scanned point cloud data into a 3D model suitable for finite element analysis (FEA).
2. 1. Point Cloud Data Acquisition
Point cloud data was acquired using the BLK360 G1 scanner manufactured by Leica Geosystems, which was selected as it is lightweight, highly portable and offers a distance measurement accuracy of 4 mm at 10 m and 7 mm at 20 m. In this study, all scanning positions were located within 10 m of the target structure. Point clouds obtained from multiple positions around the target were merged for use. Irrelevant background elements, such as surrounding objects or people, were removed using CloudCompare v.2.13.1 software.
2. 1. 1. Target Structure
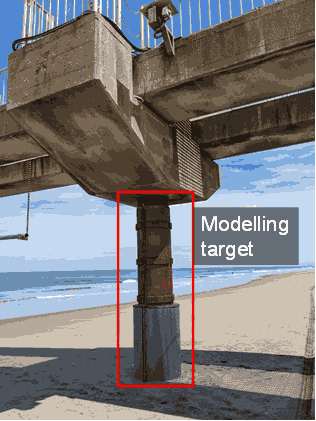
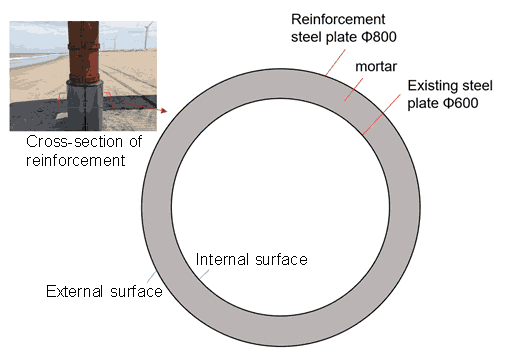
The target structure for this study was a steel tubular column that forms part of a pier managed by a marine research facility located on the Pacific coast of Japan, as shown in Figure 1. The selected column was reinforced in June 2024 after suffering significant corrosion. As shown in Figure 1, the structure features a complex shape and comprises both corroded areas and externally welded steel plates, making it increasingly difficult to apply conventional 3D modelling techniques. This study aimed to accurately model this complex structure and examine the effects of its reinforcement through analysis. Figure 2 shows a cross-sectional view of the reinforced section, where the external surface has been defined in this research as the exterior part of the structure accessible to the scanner. In contrast, the internal surface refers to the part that cannot be seen or accessed from the outside, as shown in Figure 2.
2. 1. 2. Point Cloud Acquisition for the Target Structure
The scanner locations where point cloud data was acquired are indicated by the red circles in Figure 3. The software used for data registration was Leica Register360-BLK-2023.0.3.r25010. Since the maximum misalignment between datasets was found to be approximately 4 mm and within the specified measurement accuracy, it was confirmed that this equipment could provide sufficiently accurate point cloud data. To construct a 3D digital model from point cloud data, down-sampling must be carried out to ensure only the specific nodes necessary for analysis are extracted from the vast dataset. For this down-sampling process, it is essential that the axis of the steel tubular column is accurately identified so that the point cloud can be sliced perpendicular to its longitudinal direction. In this study, the central axis was estimated using the least squares method and considering the distance between the centre point and the surrounding point cloud. The axis inclination was iteratively corrected through repeated calculations. Figure 4 presents the distance distribution from the central axis before and after inclination correction, along with the results of colour-coding the point cloud according to distance. The point cloud groups are shown in black near the mode, in red for points closer to the centre, and in blue for those farther away. As shown in Figure 4(a), three peaks can be observed in the distribution; however, the central peak appears distorted without a clearly defined maximum, and the steel tubular column is confirmed to be inclined toward the left-hand side of the Figure. In contrast, in the corrected distribution shown in Figure 4(b), each of the three peaks is clearly distinguished, demonstrating that the inclination was appropriately corrected. Since the target steel tubular column has a nearly circular cross-section, it is considered that the measurement error of the 3D scanner directly affected the distance distribution. Based on these results, the median value was adopted as the representative distance in the subsequent point cloud processing.
2. 2. Proposed 3D Modelling Method
This section presents a method to construct a 3D model using the inclination-corrected point cloud data. As the target structure is an existing steel tubular column, it was difficult to obtain internal data via laser scanning. Therefore, a method to estimate the internal surface based on design drawings was proposed. Namely, the distance between the estimated internal surface and the external surface derived from the point cloud data was calculated and used to develop a modelling approach that considers the plate thickness at each location.
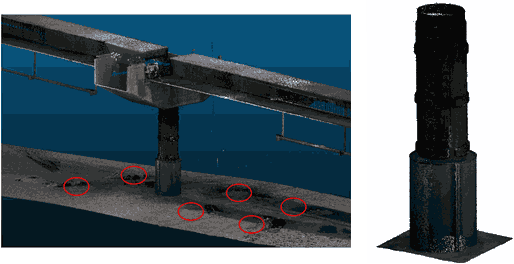
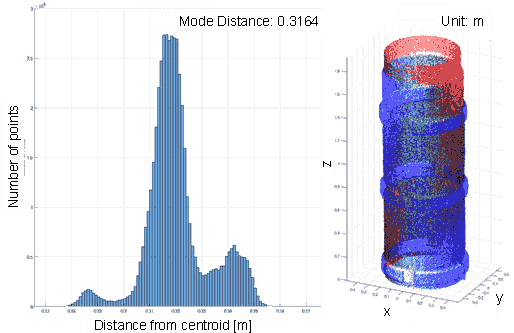
Figure 4. Distance Distribution and Colour-Coded Point Cloud before and after Inclination Correction.
2. 2. 1. Node Selection Method
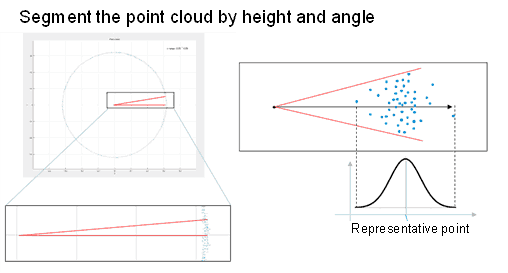
Given that the number of data points acquired by the point cloud exceeds 1.2 million even within the area of interest, it was not appropriate to use all points as nodes in the finite element model. Therefore, a uniform spatial grid was applied, and the centroid of all points within each grid was adopted as a node. The point cloud data was then segmented by height and the centroid of each cross-section was determined. Using these centroids as a reference, the point cloud data was further segmented by angle, and the median distance from the centroid within each angular segment was selected as the representative point (Figure 5). Since the density of point clouds varies depending on scanning conditions, the centroid of each cross-section was calculated using the average of the maximum and minimum values for both the x and y coordinates to minimise the influence of uneven density. The representative points obtained for each height and angle were adopted as nodes on the external surface.
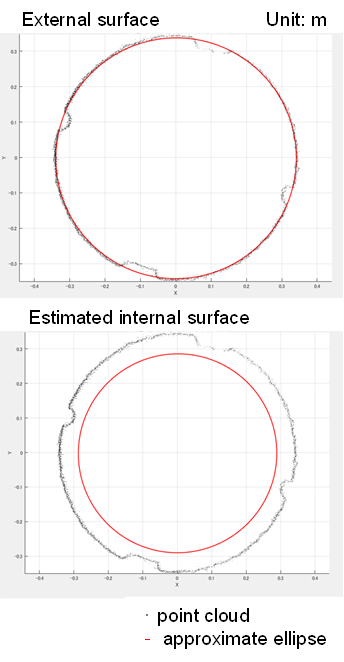
2. 2. 2. Estimation Method for the Internal Surface
As direct observation of the internal surface was not feasible, internal dimensions could have been based on design drawings. However, design drawings do not reflect any deformation due to construction conditions and ageing, and since this study aims to construct a model that accurately reflects the actual condition of a structure, an estimation method using elliptical approximation was proposed. More specifically, an ellipse was fitted to the extracted external surface points using a high-precision algorithm known as the Fitzgibbon method [7][8]. The internal perimeter was first determined from the design drawings, and then a scaled ellipse, maintaining the same shape (i.e., aspect ratio and inclination) as the fitted external ellipse, was used to define the internal surface (Figure 6).
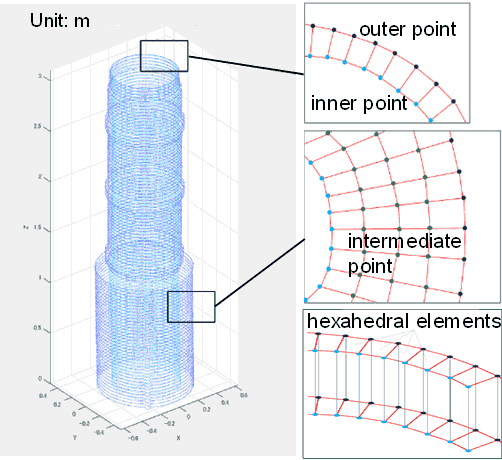
2. 2. 3. Construction of Hexahedral Elements
To reflect surface irregularities caused by reinforcement or corrosion damage, a solid model was generated using hexahedral elements for the external and internal surface points. As shown in Figure 7, the external and internal points were connected and divided by height to form quadrilateral elements for each cross-section. However, when the thickness varies greatly between reinforced and unreinforced sections, as is the case for the target column, using a uniform number of divisions for both the radial and angular directions can result in extremely thin or elongated elements, significantly reducing analysis accuracy. Therefore, intermediate nodes were introduced based on the plate thickness (i.e., the distance between corresponding external and internal points) to both improve element shape and analysis accuracy. Finally, the quadrilateral elements used in each cross-section were vertically connected to construct a complete set of hexahedral elements.
3. Application of the Proposed 3D Modelling Method
The results of a trial FEA conducted on the target steel tubular column are presented in this chapter. The FEA model was constructed using the proposed 3D modelling method based on point cloud data, where analysis was carried out using Abaqus 6.14 finite element software.
3. 1. Results of 3D Modelling
The target steel tubular column for this study, was modelled using the proposed 3D method. Modelling parameters included 100 divisions in the cross-sectional direction, 180 points per section (angular divisions) and a plate thickness ratio of 1:3:10. Plate thickness ratio serves as a scaling factor to determine the number of intermediate nodes that need to be inserted between internal and external surface points when there is a significant difference in distance. In regions where abrupt changes in the cross-sectional geometry exist, a threshold was set as the distance between internal and external points to ensure element quality. Based on this threshold and the plate thickness ratio, intermediate nodes were appropriately distributed to maintain stable element shapes.
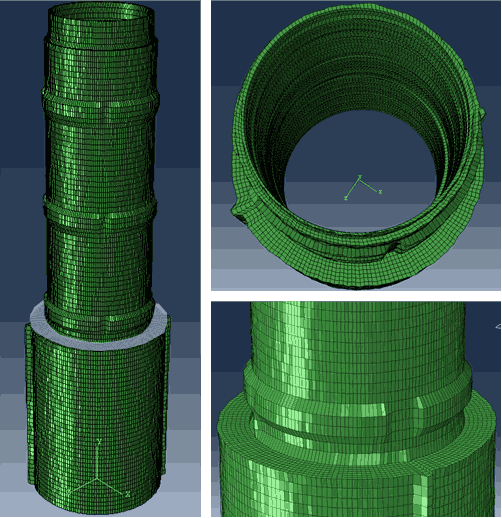
The constructed 3D model is shown in Figure 8, where irregularities in the reinforced areas are accurately reproduced, and the transition zones between reinforced and unreinforced regions are modelled stably without distortion of elements. For the target steel column, intermediate nodes were not added to unreinforced areas, two intermediate nodes were inserted in previously reinforced sections, and nine nodes were used in the lower area reinforced with concrete. Steel and mortar are indicated by green and grey, respectively, with the mortar shown to fully fill the lower section of the column.
3. 2. Trial Structural Analysis Using the Constructed 3D Model
This section outlines the trial analysis conducted using the 3D model shown in Figure 8. Material properties and boundary conditions were set to reflect steel and mortar properties, namely a Young's modulus and Poisson's ratio of 210,000 MPa and 0.3 for steel and 23,500 MPa and 0.2 for mortar. Considering the weight of an average passenger car and a wind load corresponding to a wind speed of 40 m/s blowing against the side of the pier, a horizontal load of 4,900 N (approx. 500 kgf) and a vertical load of -9,800 N (approx. 1,000 kgf) were applied to the top of the steel tubular column. Boundary conditions at the bottom of the column were defined as fully fixed and dead loads were not considered in this analysis.
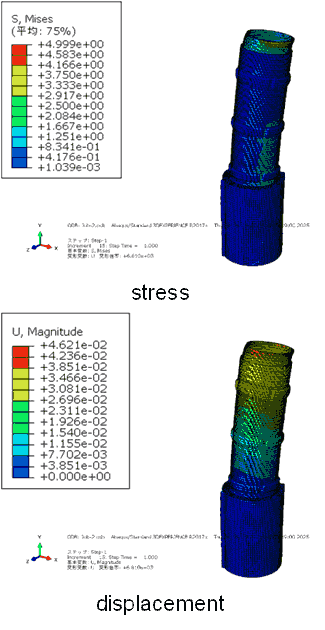
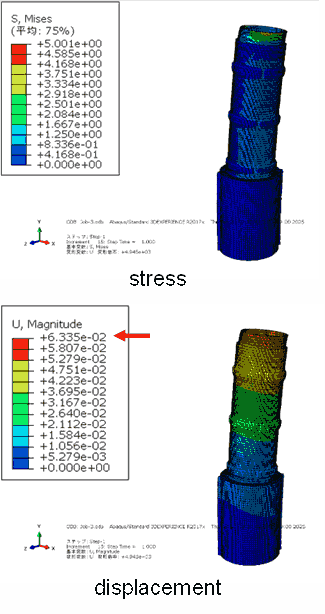
To examine the effectiveness of the reinforcement, two cases were compared; one with reinforcement and one without reinforcement. In the non-reinforced case, the material properties of the mortar and the external steel plate were set to extremely low values to simulate the absence of reinforcement. The von Mises stress and displacement distribution for the reinforced case and non-reinforced case are shown in Figure 9 and Figure 10,
respectively. The results show that for the reinforced model, stress and deformation trends due to applied loads are reasonable and within acceptable limits. Moreover, the stress distributions for the two models remain comparable whereas the displacement values for the non-reinforced case are significantly higher. These results suggest that the proposed 3D digital modelling method enables simplified and appropriate modelling. They also indicate there is potential to perform a simplified assessment of structural capacity improvements through reinforcement of the target steel columns. It is noted that this trial analysis was performed under simplified assumptions, such as uniform loading and the omission of dead loads. While these settings were sufficient to demonstrate the feasibility of the proposed modelling approach, they may limit the generalization of the numerical results. Further studies with more realistic loading conditions and boundary constraints will be necessary to verify the applicability of the model under practical scenarios and to better evaluate its potential for structural performance assessment.
4. Investigation on Thickness Measurements for Multi-layered Steel Plates using Pulsed Eddy Current
This section presents an experimental investigation into the use of pulsed eddy current (PEC) testing, further developing the aforementioned 3D digital modelling method and enabling the thickness of multi-layered steel plates to be measured. The study focuses on structural areas that are difficult to access, such as internal regions of tubular steel columns or areas only accessible from one side. The target steel tubular column structure was reinforced by wrapping an additional steel plate around the original section. It has been demonstrated that by using parameters such as the peak value of detected voltage and the decay time of this signal, pulsed eddy current testing can prove a viable method for measuring plate thickness [9]-[12]. However, previous studies have only focused on detecting the thickness of single-layer plates, even when corrosion layers or coatings were present. In contrast, this study aims to explore whether it is feasible to measure the thickness of steel plates in overlapping regions, particularly where the internal plate is not in direct contact with the PEC probe. Thickness measurements taken from backside steel plates, behind other layers or in areas where access is only possible from one side, will be used to assess the proposed method.
4. 1. Overview of the Experiment
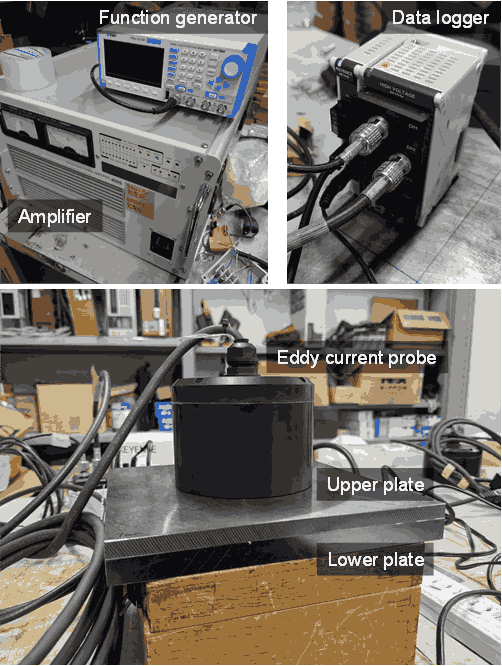
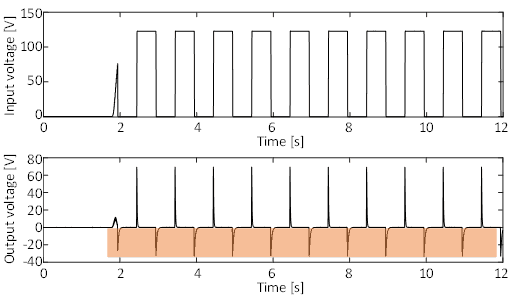
This experiment was designed to simulate the conditions of a target steel tubular column by overlapping two steel plates. The upper plate, i.e., the side in contact with the eddy current probe, was fixed at a thickness of 9 mm, while the lower plate thickness varied in 1 mm increments from 10 mm to 14 mm. The plates measured 200 mm on each side and were made of SS400 steel. The eddy current probe consisted of a detection coil approximately 45 mm in diameter and placed inside an excitation coil of approximately 80 mm in diameter. At the centre of the detection coil was a ferrite core with a diameter of 30 mm. The excitation coil had approximately 5,000 turns of 0.4 mm wire, while the detection coil had around 4,000 turns of 0.3 mm wire. Plastic spacers were introduced to simulate conditions such as corrosion or mortar infill between plates, creating gaps of approximately 0 mm, 0.1 mm, 9 mm, and 90 mm. Figure 11 shows this experimental setup. The excitation signal was generated as a pulse wave using a function generator, amplified and then applied to the probe. Detection signals from the probe were recorded using a data logger. The pulse wave had a period of 1 second, with a rise time of 0.005 seconds. Data acquisition was performed using a sampling rate of 50 kHz for 10–12 seconds, which corresponds to 10 pulse cycles. Figure 12 presents the excitation and detection voltages for the case of a 12 mm lower plate with 0 mm gap.
4. 2. Noise Reduction Method for Obtained Pulse Waves Based on Cross-Correlation and Waveform Alignment
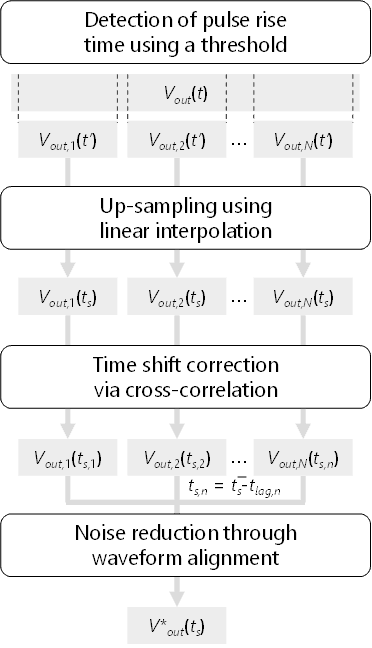
The pulse waveforms obtained in this experiment contained a considerable amount of noise, which needed to be reduced to enable reliable comparison among different experimental cases. The overall procedure is illustrated in Figure 13. In each case, 9 to 11 pulse waves were acquired. To suppress noise, these individual pulse waves were averaged after alignment. A key issue encountered was that the number of data points per pulse was limited, resulting in sub-sampling time shifts smaller than the sampling interval (20 μs) when the waveforms were superimposed. To address this problem, the proposed noise reduction method incorporates up-sampling and cross-correlation to minimize temporal misalignment.
The proposed method consists of four steps. First, a threshold is set to detect the pulse rising time. Second, linear interpolation is applied to perform up-sampling. Third, the time shift of each pulse waveform is estimated and corrected using cross-correlation with a reference waveform. Finally, all aligned pulse waveforms are summed and averaged to reduce random noise. In Figure 13, 𝑉out(𝑡) denotes the overall obtained waveform, 𝑉out,N(𝑡) represents the segmented waveform for each pulse, and 𝑡lag indicates the estimated time shift.
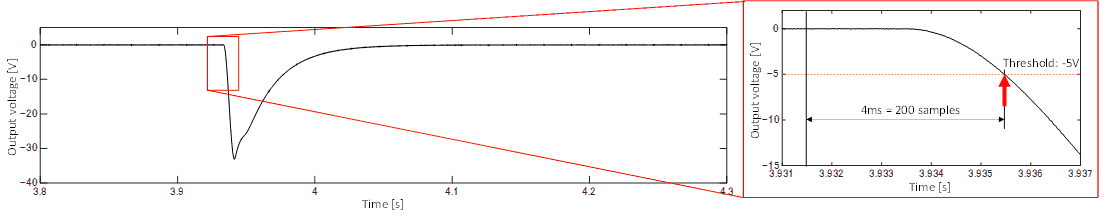
In this study, the threshold for detecting the rising edge was set at −5 V, and the alignment reference was defined as 4 ms (200 samples) prior to the threshold crossing point (Figure 14). Subsequently, linear interpolation was applied to achieve an effective sampling frequency approximately 10 times higher. Each pulse was then aligned with the reference pulse at the time corresponding to the maximum peak of the cross-correlation function. Finally, 9 to 11 aligned pulse waveforms were averaged, thereby reducing random noise components that did not originate from the input. The subsequent analysis presented in this paper is based on waveforms processed using this noise reduction method.
4. 3. Experimental Results
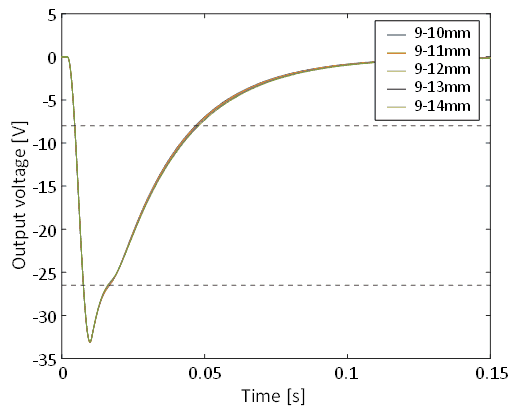
The focus of this study was the detection voltage immediately following the termination of a pulsed signal (highlighted region in Figure 12). Each waveform was divided by pulse cycle and aligned using up-sampling and cross-correlation. The average values of 9 to 11 waves were then used for analysis. Figure 15 shows the detection voltage waveforms when there was no gap between the plates. As the upper plate thickness was fixed at 9 mm, the colour variations reflect the differences in lower plate thickness. Since the waveforms align well, disturbances in the voltage signal can be clearly seen around -26 V and above -15 V. While previous studies have reported differences in peak voltage values, no such difference was observed in this experiment. Since these disturbances were absent during the single-plate tests, it can be assumed that these anomalies were due to the overlapping plate configuration.
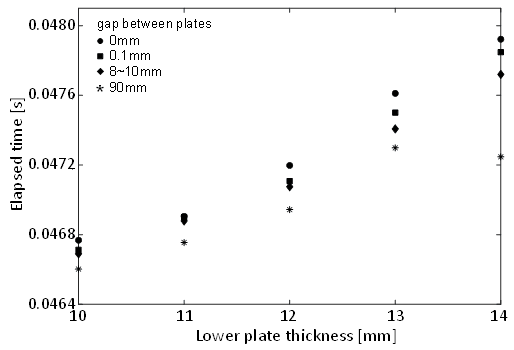
Assuming the upper plate thickness is known, as in this experiment, the point at which disturbance in the detection voltage is most pronounced and least affected by noise (at -8 V) is chosen as a threshold. The elapsed time before reaching this threshold voltage is then used as an indicator. Figure 16 illustrates the relationship between elapsed time and lower plate thickness. The different shapes used for the data points indicate the presence or absence of a gap between plates and the size of the gap. The results show that an increased thickness correlates with a longer decay time, and that the presence of a gap reduces decay duration. The results for the 14 mm lower plate were nearly identical to those for the 13 mm plate. This result can be explained by empirical understanding that PEC signal penetration depth is approximately equal to the probe diameter [9], where the input signal strength was also likely insufficient. Potential improvements include increasing the pulse duration, enhancing the input signal strength, or employing a larger probe. Nevertheless, the overall relationship between plate thickness and decay time could be clearly observed.
These results indicate that, assuming the upper plate thickness is known, the lower plate thickness, and even gaps due to corrosion or other damage, can potentially be estimated using the relationship shown in Figure 16. Moreover, by combining the point cloud-based 3D modelling method proposed in this study with the PEC-based thickness estimation technique for overlapping plates, it has proven possible to construct 3D models that can more accurately reflect actual structural conditions. With further refinement, this approach could facilitate not only the detection of surface-level corrosion damage but also enable measurement estimations of internal plate thickness and interlayer corrosion before reinforcement.
5. Conclusions
In this study, a method to efficiently construct 3D models that accurately reflect the actual condition of structures using point cloud data has been investigated. The main conclusions of this study are as follows:
1) The proposed 3D modelling method, using point cloud data obtained via laser scanning, enabled hexahedral solid elements to be generated using one-to-one correspondence between the external and internal surfaces modelled using elliptical fitting.
2) The results from applying the proposed method to an existing steel tubular column confirm that a 3D model can be constructed to accurately reflect actual conditions, including reinforcement and corrosion. Furthermore, since the model was constructed using a finite element analysis program, the effectiveness of any reinforcement could also be evaluated.
3) Since internal conditions must be estimated for the proposed modelling method, a plate thickness detection method using pulsed eddy current testing was further proposed. Experimental results confirm that the thickness of the lower (i.e., internal) plate in an overlapping configuration can successfully be estimated. The integration of this thickness detection method with the 3D modelling approach has demonstrated the potential of constructing 3D models that can more accurately represent actual structural conditions.
While the proposed 3D modelling method based on point cloud data still requires fine-tuning of certain parameters, such as plate thickness ratio and threshold settings, reducing manual input remains critical to ensure modelling efficiency. Accordingly, further optimisation and process automation should be pursued. Additionally, regarding the thickness detection method, developing a technique capable of simultaneously estimating the upper and lower plate thicknesses as well as any gaps in between remains a challenge. Moreover, the finite element analysis presented in this study was conducted under simplified assumptions, and future work will involve incorporating more realistic loading conditions and boundary constraints to further verify the applicability of the proposed model. Integration with the 3D modelling method also remains a topic for future research.
From a practical perspective, the workflow proposed in this study is expected to serve as a digital foundation for inspection and maintenance activities. By providing three-dimensional data that represent both the visible and hidden conditions of steel members, the proposed method supports a more objective evaluation of corrosion progression, reinforcement effectiveness, and structural integrity. In the context of Japan’s ageing infrastructure, such integrated 3D models have the potential to facilitate data-driven maintenance planning, rational decision-making, and long-term digital archiving for infrastructure asset management.
Acknowledgements
This research was conducted in conjunction with the Cross-ministerial Strategic Innovation Promotion Program (SIP), under the project "Smart Infrastructure Management System: Building an Advanced Infrastructure Maintenance Cycle." The authors would like to express their sincere gratitude to all those involved for their support and cooperation throughout this study.
References
[1] N. S. Dang and C. S. Shim, "BIM authoring for an image-based bridge maintenance system of existing cable-supported bridges," in IOP Conf. Ser.: Earth Environ. Science, vol. 143, pp. 1-10, 2018. View Article
[2] H. H. Hosamo and M. H. Hosamo, "Digital twin technology for bridge maintenance using 3D laser scanning: A review," Advances in Civil Engineering, vol. 2022, pp. 1-15, 2022. [Online]. Available: https://doi.org/10.1155/2022/2194949 View Article
[3] M. Soilán, A. Sánchez-Rodríguez, P. del Río-Barral, C. Perez-Collazo, P. Arias, and B. Riveiro, "Review of laser scanning technologies and their applications for road and railway infrastructure monitoring," Infrastructures, vol. 4, no. 4, pp. 1-29, Sep. 2019, doi: 10.3390/infrastructures4040058 View Article
[4] C. Hu, L. Kong, and F. Lv, "Application of 3D laser scanning technology in engineering field," IAECT2020 E3S Web of Conferences, vol. 233, 2021, [Online]. Available: https://doi.org/10.1051/e3s-conf/202123304014 View Article
[5] L. Attard, C. J. Debono, G. Valentino, and M. D. Castro, "Tunnel inspection using photogrammetric techniques and image processing: A review," ISPRS Journal of Photogrammetry and Remote Sensing, vol. 144, pp. 180-188, 2018. [Online]. Available: https://doi.org/10.1016/j.isprsjprs.2018.07.003 View Article
[6] M. Pepe, and D. Costantino, “UAV photogrammetry and 3D modelling of complex architecture for maintenance purposes: The case study of the masonry bridge on the Sele River, Italy,” Periodica Polytechnica Civil Engineering, vol. 65, no. 1, pp. 191-203, 2021. [Online]. Available: View Article
[7] A. Fitzgibbon, M. Pilu, and R. B. Fisher, "Direct Least Square Fitting of Ellipses," TERN ANALYSIS AND MACHINE INTELLIGENCE, vol. 21, no. 5, pp. 476-480, 1999. View Article
[8] T. Masuzaki, Y. Sugaya, and K. Kanatani, "High accuracy ellipse-specific fitting," IPSJ SIG Technical Report, vol. 2012-CVIM-183, no. 3, pp. 1-7, 2012. (in Japanese)
[9] S. Yoshioka and Y. Gotoh, "Proposal of quantitative evaluation method of covered steel tube thickness using pulse eddy current testing method," Transactions of the Society of Instrument and Control Engineers, vol. 54, no. 12, pp. 894-899, 2018. (in Japanese) View Article
[10] D. G. Park, C. S. Angani, G. D. Kim, C. G. Kim, and Y. M. Cheong, "Evaluation of pulsed eddy current response and detection of the thickness variation in the stainless steel," IEEE Transactions on Magnetics, vol. 45, no. 10, pp. 3893-3896, 2009. View Article
[11] L. Zhao, C. J. Li, Z. X. Duan, W. Wang, and X. D. Wu, "The metal thickness detection using pulsed eddy-current computation and detection method," Cluster Computing, vol. 22, pp. S6551-S6562, 2019. [Online]. Available: https://doi.org/10.1007/s10586-017-1515-3 View Article
[12] Y. Wang, M. Fan, B. Cao, B. Ye, and D. Wen, "Measurement of coating thickness using lift-off point of intersection features from pulsed eddy current signals," NDT and E International, vol. 116, pp. 1-12, 2020. [Online]. Available: https://doi.org/10.1016-/j.ndteint.2020.102333 View Article